

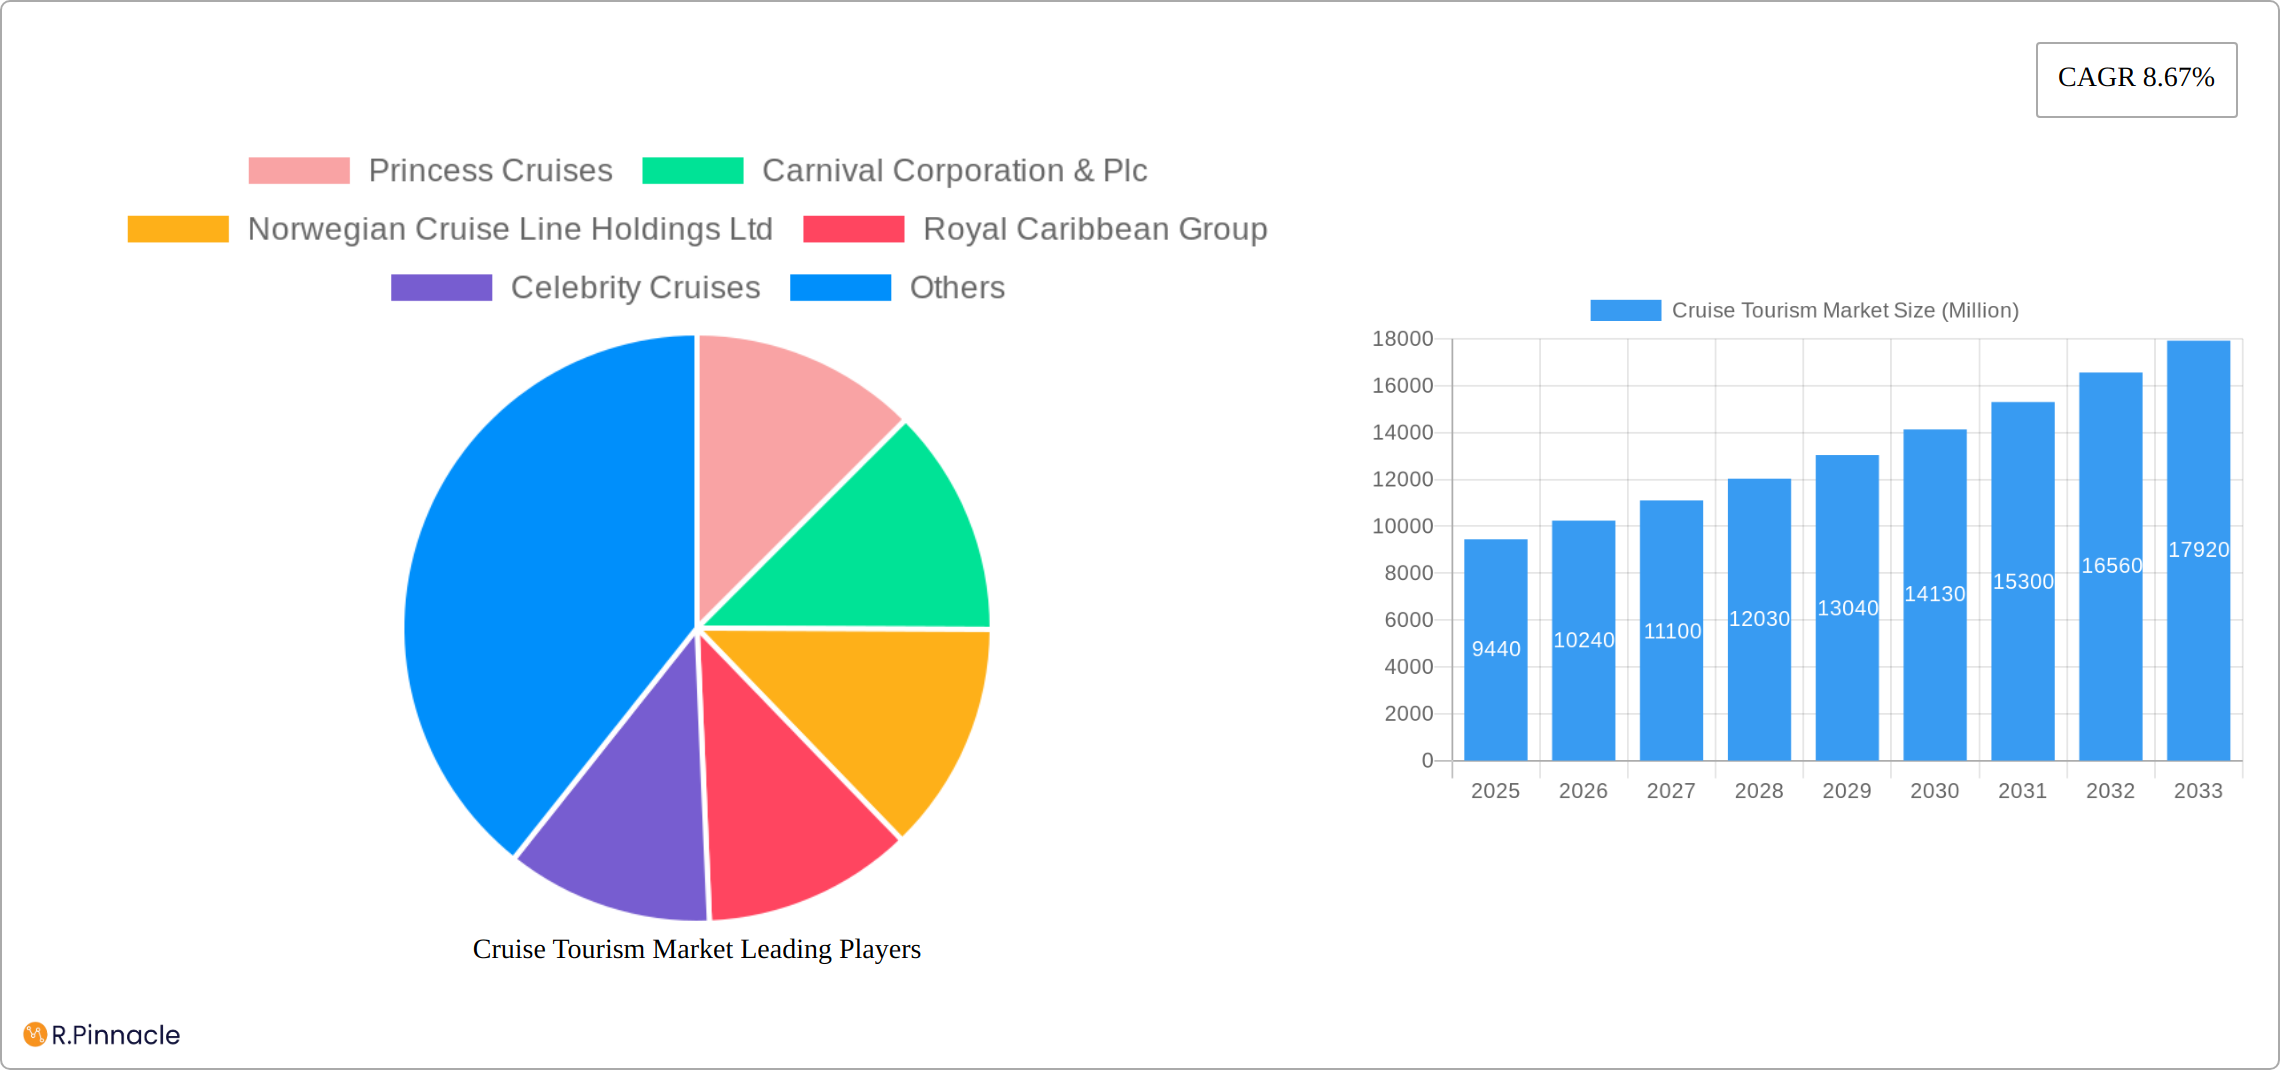
Key Insights
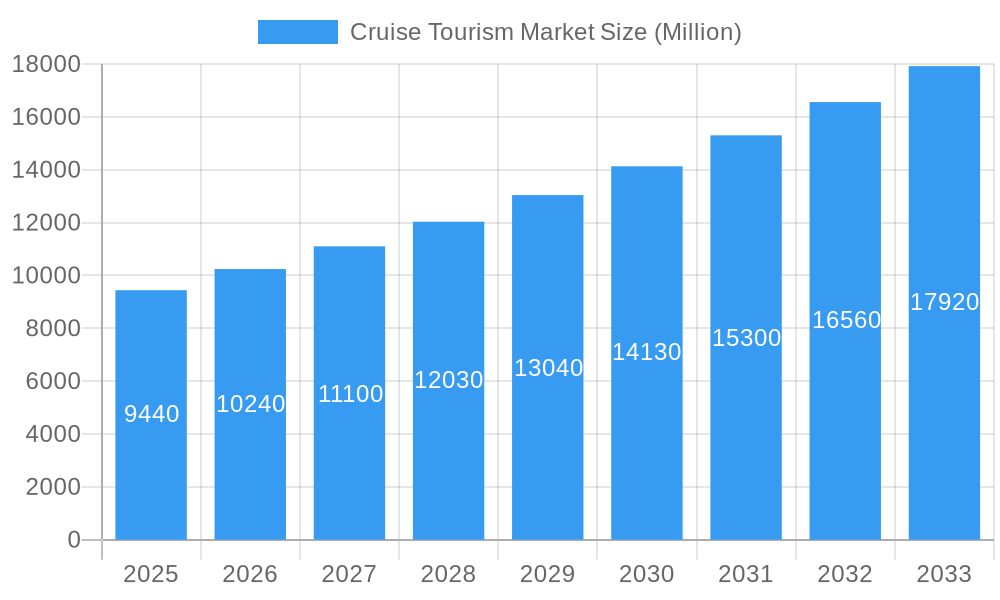
The global cruise tourism market, valued at $9.44 billion in 2025, is projected to experience robust growth, driven by a compound annual growth rate (CAGR) of 8.67% from 2025 to 2033. This expansion is fueled by several key factors. Increased disposable incomes in emerging economies are leading to a rise in leisure travel, with cruises becoming an increasingly popular choice due to their all-inclusive nature and diverse offerings. The industry's continuous innovation in cruise ship design and onboard experiences, including the introduction of themed cruises and unique itineraries, further enhances its appeal. Furthermore, strategic marketing campaigns targeting diverse age demographics and the development of sustainable tourism practices are contributing to market expansion. The market segmentation reveals significant opportunities across various passenger age groups, cruise types (river, ocean, expedition, etc.), and trip durations, allowing for targeted marketing and product development. North America and Europe currently dominate the market, but Asia-Pacific is poised for significant growth given its expanding middle class and increasing interest in international travel. However, factors such as economic downturns, geopolitical instability, and environmental concerns related to cruise ship emissions present potential restraints.
Cruise Tourism Market Market Size (In Billion)
The competitive landscape is characterized by a mix of large global players, such as Carnival Corporation & Plc, Royal Caribbean Group, and Norwegian Cruise Line Holdings Ltd., alongside smaller, niche operators focusing on specific segments like expedition cruises or river cruises. Maintaining a competitive edge requires continuous investment in innovative offerings, effective marketing, and sustainable practices. The projected growth trajectory suggests significant investment potential in the cruise tourism sector, though careful consideration of potential risks, including fluctuations in fuel prices and global health concerns, is crucial for long-term success. Analyzing regional trends and evolving consumer preferences will be essential for maximizing returns in this dynamic market.
Cruise Tourism Market Company Market Share
Cruise Tourism Market: A Comprehensive Report (2019-2033)
This in-depth report provides a comprehensive analysis of the global cruise tourism market, offering valuable insights for industry professionals, investors, and stakeholders. With a study period spanning 2019-2033, a base year of 2025, and a forecast period of 2025-2033, this report leverages historical data (2019-2024) to project future market trends and opportunities. The market is valued at xx Million in 2025 and is projected to reach xx Million by 2033, exhibiting a CAGR of xx%. The report segments the market by passenger age, cruise type, and duration, providing a granular understanding of market dynamics and growth potential.
Cruise Tourism Market Structure & Innovation Trends
This section analyzes the competitive landscape of the cruise tourism market, exploring market concentration, innovation drivers, regulatory frameworks, and M&A activities. The market is characterized by a moderately concentrated structure with key players such as Carnival Corporation & Plc, Royal Caribbean Group, and MSC Cruises holding significant market share. However, smaller niche players focusing on specific segments like river cruises or expedition cruises also contribute significantly. The estimated combined market share of the top five players is approximately xx%. Recent M&A activities have involved smaller deals focused on enhancing technology and expanding geographical reach, with total deal values estimated to be in the range of xx Million over the past five years.
- Market Concentration: High, with a few major players dominating the ocean cruise segment.
- Innovation Drivers: Technological advancements in booking platforms, onboard experiences, and sustainable cruising practices.
- Regulatory Frameworks: International maritime regulations and port infrastructure development influence market growth.
- Product Substitutes: Other forms of leisure travel, such as land-based holidays and alternative adventure tourism.
- End-User Demographics: Growing demand from millennial and Gen Z travelers, coupled with a strong presence of the 40-59 age group.
- M&A Activities: Primarily focused on technological integration and strategic partnerships.
Cruise Tourism Market Dynamics & Trends
The cruise tourism market is experiencing robust growth fueled by several key factors. Rising disposable incomes in emerging economies, a growing preference for experiential travel, and the increasing accessibility of cruise packages are driving market expansion. Technological advancements, such as online booking platforms and personalized onboard experiences, enhance customer satisfaction and drive demand. Competitive dynamics are intense, with major players investing heavily in new ship construction, itinerary diversification, and enhanced customer service to maintain their market share. The market penetration of cruise tourism is increasing globally, particularly in Asia-Pacific and Latin America, but faces challenges like seasonality and sustainability concerns.
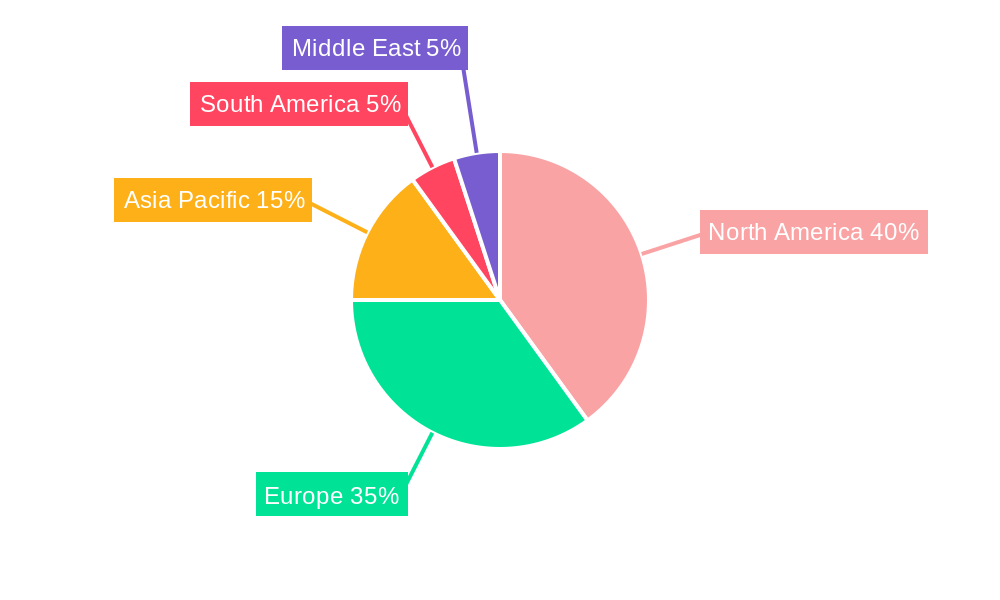
Dominant Regions & Segments in Cruise Tourism Market
The North American region continues to be the undisputed leader in the global cruise tourism market, a position bolstered by robust domestic demand, extensive cruise infrastructure, and a strong established network of ports and services. Europe also maintains a significant presence, with a mature market characterized by diverse offerings and a loyal customer base. The Asia-Pacific region is a dynamic growth engine, showing remarkable expansion driven by emerging economies, increasing middle-class populations, and a burgeoning appetite for international travel experiences. Latin America is also demonstrating promising upward trends, with untapped potential for cruise tourism development.
Dominant Segments:
- By Passenger Age: The 40-59 age demographic remains the largest and most influential segment, demonstrating a strong propensity for cruise vacations due to disposable income and established travel patterns. The 20-39 age group is showing a notable and increasing contribution, signifying a vital broadening of the customer base and a growing appeal of cruising to younger demographics seeking adventure and unique experiences.
- By Type: Ocean cruises continue to command the largest market share, offering a wide array of destinations and onboard activities that appeal to a broad spectrum of travelers. However, the river cruise segment is experiencing a meteoric rise in popularity, driven by its intimate, destination-focused approach, immersive cultural experiences, and a perception of higher value and exclusivity. Expedition cruises are also gaining traction, catering to adventurous travelers seeking exploration in remote and unique environments.
- By Duration: Cruises ranging from 8 to 14 days represent the most significant market share, offering a balanced combination of relaxation, exploration, and onboard engagement. Shorter cruise durations, specifically 1-7 days, are experiencing substantial growth, proving highly attractive to first-time cruisers, those with limited vacation time, and individuals seeking quick getaways and accessible travel options. Longer, immersive itineraries are also appealing to a niche but growing segment seeking in-depth exploration.
Key Drivers:
- Economic Factors: Sustained economic growth leading to increased disposable incomes globally, coupled with a general uplift in consumer confidence and a propensity for discretionary spending on leisure and travel, are fundamental drivers.
- Infrastructure Development: Continuous and significant investments in modernizing and expanding port facilities, cruise terminals, and related transportation networks are crucial for accommodating larger vessels, enhancing passenger experience, and facilitating seamless embarkation and disembarkation.
- Government Policies: Proactive and supportive government policies aimed at promoting tourism, including streamlined visa regulations, infrastructure development incentives, and marketing initiatives, play a vital role in fostering a favorable environment for cruise tourism growth.
Cruise Tourism Market Product Innovations
Recent innovations include enhanced onboard technologies, sustainable cruise options, and immersive destination experiences. The integration of smart technologies, personalized entertainment, and improved connectivity aboard cruise ships is transforming the passenger experience. Emphasis on sustainable practices, such as reducing carbon emissions and promoting responsible tourism, is becoming a key differentiator. These innovations address evolving consumer preferences for personalized, technologically advanced, and environmentally responsible travel options, enhancing market fit and driving future growth.
Report Scope & Segmentation Analysis
This report segments the cruise tourism market by passenger age (less than 12 years, 13-19 years, 20-39 years, 40-59 years, above 60 years), cruise type (river cruise, ocean cruise, expedition cruise, theme cruise, adventure cruise, others), and cruise duration (1-7 days, 8-14 days, 15-20 days, more than 21 days). Each segment's market size, growth projections, and competitive dynamics are analyzed to provide a comprehensive market overview.
Key Drivers of Cruise Tourism Market Growth
The cruise tourism market is experiencing a robust expansion fueled by a confluence of innovative technological advancements in cruise ship design and the integration of cutting-edge onboard amenities, enhancing passenger comfort and entertainment. Favorable global economic conditions, characterized by rising disposable incomes and a growing middle class, are significantly contributing to increased travel spending. Furthermore, strategic investments in infrastructure, coupled with supportive government policies that facilitate travel and promote tourism, are creating a fertile ground for market growth. The escalating demand for experiential travel, where travelers seek immersive and memorable journeys, aligns perfectly with the inherent offerings of cruise vacations. This, combined with increasingly competitive pricing and package deals, is making cruise holidays more accessible and appealing to a wider demographic, driving sustained market expansion.
Challenges in the Cruise Tourism Market Sector
The cruise tourism market, while experiencing robust growth, is not without its significant challenges. Fluctuating and often volatile fuel prices represent a substantial operational cost that can directly impact profitability and necessitate agile pricing strategies. Increasingly stringent environmental regulations worldwide require substantial investment in sustainable technologies and practices, adding to operational expenses. The highly competitive nature of the market, with numerous cruise lines vying for passenger attention, can lead to price wars and pressure on margins. Supply chain disruptions, exacerbated by global events, can impact the availability and cost of goods and services onboard. Moreover, rising operational costs across the board, from crew wages to shore excursions, present ongoing financial hurdles. These combined factors collectively present a complex operating environment that demands strategic foresight and adaptability from market players. The estimated negative impact of these challenges on overall market growth is currently being closely monitored and could potentially represent a reduction of X-Y% annually if not effectively mitigated.
Emerging Opportunities in Cruise Tourism Market
The cruise tourism market is ripe with emerging opportunities, particularly in the rapidly developing markets of Asia and South America, where a growing middle class and increasing interest in international travel present vast untapped potential. The discernible shift in consumer preference towards sustainable and ethically responsible travel is creating significant demand for eco-friendly cruise experiences, opening avenues for innovative product development in areas such as waste reduction, renewable energy adoption, and conservation-focused itineraries. The growing desire for highly personalized and niche cruise experiences, including wellness retreats, culinary adventures, and educational journeys, allows for the creation of specialized offerings that cater to specific traveler interests. Furthermore, advancements in digital technologies, from seamless online booking systems and AI-powered customer service to immersive onboard entertainment and connectivity, offer unparalleled opportunities to enhance customer satisfaction, foster loyalty, and streamline operations.
Leading Players in the Cruise Tourism Market Market
- Princess Cruises
- Carnival Corporation & Plc
- Norwegian Cruise Line Holdings Ltd
- Royal Caribbean Group
- Celebrity Cruises
- Costa Cruises
- Holland America Line
- MSC Cruises
- Disney Cruise Line
- Cunard Line
Key Developments in Cruise Tourism Market Industry
- November 2023: TravClan and Resorts World Cruises partnered to revolutionize cruise tourism in India, focusing on affordability and accessibility.
- October 2023: Traveltek and Cruise Planners formed a strategic alliance to enhance cruise booking technology nationwide.
Future Outlook for Cruise Tourism Market Market
The cruise tourism market is poised for continued growth, driven by increasing disposable incomes, technological advancements, and the expanding popularity of experiential travel. Strategic investments in sustainable practices and personalized experiences will be crucial for maintaining competitiveness and capturing market share in the years to come. The market is projected to experience substantial growth, reaching xx Million by 2033.
Cruise Tourism Market Segmentation
-
1. Type
- 1.1. River Cruise
- 1.2. Ocean Cruise
- 1.3. Expedition Cruise
- 1.4. Theme Cruise
- 1.5. Adventure Cruise
- 1.6. Others
-
2. Duration
- 2.1. 1-7Days
- 2.2. 8-14 Days
- 2.3. 15-20 Days
- 2.4. More than 21 Days
-
3. Passenger Age
- 3.1. Less than 12 years
- 3.2. 13-19 Years
- 3.3. 20-39 Years
- 3.4. 40-59 Years
- 3.5. Above 60 Years
Cruise Tourism Market Segmentation By Geography
-
1. North America
- 1.1. US
- 1.2. Canada
- 1.3. Mexico
- 1.4. Rest of North America
-
2. Europe
- 2.1. Germany
- 2.2. UK
- 2.3. France
- 2.4. Russia
- 2.5. Spain
- 2.6. Rest of Europe
-
3. Asia Pacific
- 3.1. India
- 3.2. China
- 3.3. Japan
- 3.4. Rest of Asia Pacific
-
4. South America
- 4.1. Brazil
- 4.2. Argentina
- 4.3. Rest of South America
-
5. Middle East
- 5.1. UAE
- 5.2. Saudi Arabia
- 5.3. Rest of Middle East
Cruise Tourism Market Regional Market Share
Geographic Coverage of Cruise Tourism Market
Cruise Tourism Market REPORT HIGHLIGHTS
| Aspects | Details |
|---|---|
| Study Period | 2020-2034 |
| Base Year | 2025 |
| Estimated Year | 2026 |
| Forecast Period | 2026-2034 |
| Historical Period | 2020-2025 |
| Growth Rate | CAGR of 8.67% from 2020-2034 |
| Segmentation |
|
Table of Contents
- 1. Introduction
- 1.1. Research Scope
- 1.2. Market Segmentation
- 1.3. Research Objective
- 1.4. Definitions and Assumptions
- 2. Executive Summary
- 2.1. Market Snapshot
- 3. Market Dynamics
- 3.1. Market Drivers
- 3.2. Market Restrains
- 3.3. Market Trends
- 3.4. Market Opportunities
- 4. Market Factor Analysis
- 4.1. Porters Five Forces
- 4.1.1. Bargaining Power of Suppliers
- 4.1.2. Bargaining Power of Buyers
- 4.1.3. Threat of New Entrants
- 4.1.4. Threat of Substitutes
- 4.1.5. Competitive Rivalry
- 4.2. PESTEL analysis
- 4.3. BCG Analysis
- 4.3.1. Stars (High Growth, High Market Share)
- 4.3.2. Cash Cows (Low Growth, High Market Share)
- 4.3.3. Question Mark (High Growth, Low Market Share)
- 4.3.4. Dogs (Low Growth, Low Market Share)
- 4.4. Ansoff Matrix Analysis
- 4.5. Supply Chain Analysis
- 4.6. Regulatory Landscape
- 4.7. Current Market Potential and Opportunity Assessment (TAM–SAM–SOM Framework)
- 4.8. PRI Analyst Note
- 4.1. Porters Five Forces
- 5. Market Analysis, Insights and Forecast 2021-2033
- 5.1. Market Analysis, Insights and Forecast - by Type
- 5.1.1. River Cruise
- 5.1.2. Ocean Cruise
- 5.1.3. Expedition Cruise
- 5.1.4. Theme Cruise
- 5.1.5. Adventure Cruise
- 5.1.6. Others
- 5.2. Market Analysis, Insights and Forecast - by Duration
- 5.2.1. 1-7Days
- 5.2.2. 8-14 Days
- 5.2.3. 15-20 Days
- 5.2.4. More than 21 Days
- 5.3. Market Analysis, Insights and Forecast - by Passenger Age
- 5.3.1. Less than 12 years
- 5.3.2. 13-19 Years
- 5.3.3. 20-39 Years
- 5.3.4. 40-59 Years
- 5.3.5. Above 60 Years
- 5.4. Market Analysis, Insights and Forecast - by Region
- 5.4.1. North America
- 5.4.2. Europe
- 5.4.3. Asia Pacific
- 5.4.4. South America
- 5.4.5. Middle East
- 5.1. Market Analysis, Insights and Forecast - by Type
- 6. Global Cruise Tourism Market Analysis, Insights and Forecast, 2021-2033
- 6.1. Market Analysis, Insights and Forecast - by Type
- 6.1.1. River Cruise
- 6.1.2. Ocean Cruise
- 6.1.3. Expedition Cruise
- 6.1.4. Theme Cruise
- 6.1.5. Adventure Cruise
- 6.1.6. Others
- 6.2. Market Analysis, Insights and Forecast - by Duration
- 6.2.1. 1-7Days
- 6.2.2. 8-14 Days
- 6.2.3. 15-20 Days
- 6.2.4. More than 21 Days
- 6.3. Market Analysis, Insights and Forecast - by Passenger Age
- 6.3.1. Less than 12 years
- 6.3.2. 13-19 Years
- 6.3.3. 20-39 Years
- 6.3.4. 40-59 Years
- 6.3.5. Above 60 Years
- 6.1. Market Analysis, Insights and Forecast - by Type
- 7. North America Cruise Tourism Market Analysis, Insights and Forecast, 2020-2032
- 7.1. Market Analysis, Insights and Forecast - by Type
- 7.1.1. River Cruise
- 7.1.2. Ocean Cruise
- 7.1.3. Expedition Cruise
- 7.1.4. Theme Cruise
- 7.1.5. Adventure Cruise
- 7.1.6. Others
- 7.2. Market Analysis, Insights and Forecast - by Duration
- 7.2.1. 1-7Days
- 7.2.2. 8-14 Days
- 7.2.3. 15-20 Days
- 7.2.4. More than 21 Days
- 7.3. Market Analysis, Insights and Forecast - by Passenger Age
- 7.3.1. Less than 12 years
- 7.3.2. 13-19 Years
- 7.3.3. 20-39 Years
- 7.3.4. 40-59 Years
- 7.3.5. Above 60 Years
- 7.1. Market Analysis, Insights and Forecast - by Type
- 8. Europe Cruise Tourism Market Analysis, Insights and Forecast, 2020-2032
- 8.1. Market Analysis, Insights and Forecast - by Type
- 8.1.1. River Cruise
- 8.1.2. Ocean Cruise
- 8.1.3. Expedition Cruise
- 8.1.4. Theme Cruise
- 8.1.5. Adventure Cruise
- 8.1.6. Others
- 8.2. Market Analysis, Insights and Forecast - by Duration
- 8.2.1. 1-7Days
- 8.2.2. 8-14 Days
- 8.2.3. 15-20 Days
- 8.2.4. More than 21 Days
- 8.3. Market Analysis, Insights and Forecast - by Passenger Age
- 8.3.1. Less than 12 years
- 8.3.2. 13-19 Years
- 8.3.3. 20-39 Years
- 8.3.4. 40-59 Years
- 8.3.5. Above 60 Years
- 8.1. Market Analysis, Insights and Forecast - by Type
- 9. Asia Pacific Cruise Tourism Market Analysis, Insights and Forecast, 2020-2032
- 9.1. Market Analysis, Insights and Forecast - by Type
- 9.1.1. River Cruise
- 9.1.2. Ocean Cruise
- 9.1.3. Expedition Cruise
- 9.1.4. Theme Cruise
- 9.1.5. Adventure Cruise
- 9.1.6. Others
- 9.2. Market Analysis, Insights and Forecast - by Duration
- 9.2.1. 1-7Days
- 9.2.2. 8-14 Days
- 9.2.3. 15-20 Days
- 9.2.4. More than 21 Days
- 9.3. Market Analysis, Insights and Forecast - by Passenger Age
- 9.3.1. Less than 12 years
- 9.3.2. 13-19 Years
- 9.3.3. 20-39 Years
- 9.3.4. 40-59 Years
- 9.3.5. Above 60 Years
- 9.1. Market Analysis, Insights and Forecast - by Type
- 10. South America Cruise Tourism Market Analysis, Insights and Forecast, 2020-2032
- 10.1. Market Analysis, Insights and Forecast - by Type
- 10.1.1. River Cruise
- 10.1.2. Ocean Cruise
- 10.1.3. Expedition Cruise
- 10.1.4. Theme Cruise
- 10.1.5. Adventure Cruise
- 10.1.6. Others
- 10.2. Market Analysis, Insights and Forecast - by Duration
- 10.2.1. 1-7Days
- 10.2.2. 8-14 Days
- 10.2.3. 15-20 Days
- 10.2.4. More than 21 Days
- 10.3. Market Analysis, Insights and Forecast - by Passenger Age
- 10.3.1. Less than 12 years
- 10.3.2. 13-19 Years
- 10.3.3. 20-39 Years
- 10.3.4. 40-59 Years
- 10.3.5. Above 60 Years
- 10.1. Market Analysis, Insights and Forecast - by Type
- 11. Middle East Cruise Tourism Market Analysis, Insights and Forecast, 2020-2032
- 11.1. Market Analysis, Insights and Forecast - by Type
- 11.1.1. River Cruise
- 11.1.2. Ocean Cruise
- 11.1.3. Expedition Cruise
- 11.1.4. Theme Cruise
- 11.1.5. Adventure Cruise
- 11.1.6. Others
- 11.2. Market Analysis, Insights and Forecast - by Duration
- 11.2.1. 1-7Days
- 11.2.2. 8-14 Days
- 11.2.3. 15-20 Days
- 11.2.4. More than 21 Days
- 11.3. Market Analysis, Insights and Forecast - by Passenger Age
- 11.3.1. Less than 12 years
- 11.3.2. 13-19 Years
- 11.3.3. 20-39 Years
- 11.3.4. 40-59 Years
- 11.3.5. Above 60 Years
- 11.1. Market Analysis, Insights and Forecast - by Type
- 12. Competitive Analysis
- 12.1. Company Profiles
- 12.1.1 Princess Cruises
- 12.1.1.1. Company Overview
- 12.1.1.2. Products
- 12.1.1.3. Company Financials
- 12.1.1.4. SWOT Analysis
- 12.1.2 Carnival Corporation & Plc
- 12.1.2.1. Company Overview
- 12.1.2.2. Products
- 12.1.2.3. Company Financials
- 12.1.2.4. SWOT Analysis
- 12.1.3 Norwegian Cruise Line Holdings Ltd
- 12.1.3.1. Company Overview
- 12.1.3.2. Products
- 12.1.3.3. Company Financials
- 12.1.3.4. SWOT Analysis
- 12.1.4 Royal Caribbean Group
- 12.1.4.1. Company Overview
- 12.1.4.2. Products
- 12.1.4.3. Company Financials
- 12.1.4.4. SWOT Analysis
- 12.1.5 Celebrity Cruises
- 12.1.5.1. Company Overview
- 12.1.5.2. Products
- 12.1.5.3. Company Financials
- 12.1.5.4. SWOT Analysis
- 12.1.6 Costa Cruises
- 12.1.6.1. Company Overview
- 12.1.6.2. Products
- 12.1.6.3. Company Financials
- 12.1.6.4. SWOT Analysis
- 12.1.7 Holland America Line
- 12.1.7.1. Company Overview
- 12.1.7.2. Products
- 12.1.7.3. Company Financials
- 12.1.7.4. SWOT Analysis
- 12.1.8 MSC Cruises
- 12.1.8.1. Company Overview
- 12.1.8.2. Products
- 12.1.8.3. Company Financials
- 12.1.8.4. SWOT Analysis
- 12.1.9 Disney Cruise Line
- 12.1.9.1. Company Overview
- 12.1.9.2. Products
- 12.1.9.3. Company Financials
- 12.1.9.4. SWOT Analysis
- 12.1.10 Cunard Line**List Not Exhaustive
- 12.1.10.1. Company Overview
- 12.1.10.2. Products
- 12.1.10.3. Company Financials
- 12.1.10.4. SWOT Analysis
- 12.1.1 Princess Cruises
- 12.2. Market Entropy
- 12.2.1 Company's Key Areas Served
- 12.2.2 Recent Developments
- 12.3. Company Market Share Analysis 2025
- 12.3.1 Top 5 Companies Market Share Analysis
- 12.3.2 Top 3 Companies Market Share Analysis
- 12.4. List of Potential Customers
- 13. Research Methodology
List of Figures
- Figure 1: Global Cruise Tourism Market Revenue Breakdown (Million, %) by Region 2025 & 2033
- Figure 2: North America Cruise Tourism Market Revenue (Million), by Type 2025 & 2033
- Figure 3: North America Cruise Tourism Market Revenue Share (%), by Type 2025 & 2033
- Figure 4: North America Cruise Tourism Market Revenue (Million), by Duration 2025 & 2033
- Figure 5: North America Cruise Tourism Market Revenue Share (%), by Duration 2025 & 2033
- Figure 6: North America Cruise Tourism Market Revenue (Million), by Passenger Age 2025 & 2033
- Figure 7: North America Cruise Tourism Market Revenue Share (%), by Passenger Age 2025 & 2033
- Figure 8: North America Cruise Tourism Market Revenue (Million), by Country 2025 & 2033
- Figure 9: North America Cruise Tourism Market Revenue Share (%), by Country 2025 & 2033
- Figure 10: Europe Cruise Tourism Market Revenue (Million), by Type 2025 & 2033
- Figure 11: Europe Cruise Tourism Market Revenue Share (%), by Type 2025 & 2033
- Figure 12: Europe Cruise Tourism Market Revenue (Million), by Duration 2025 & 2033
- Figure 13: Europe Cruise Tourism Market Revenue Share (%), by Duration 2025 & 2033
- Figure 14: Europe Cruise Tourism Market Revenue (Million), by Passenger Age 2025 & 2033
- Figure 15: Europe Cruise Tourism Market Revenue Share (%), by Passenger Age 2025 & 2033
- Figure 16: Europe Cruise Tourism Market Revenue (Million), by Country 2025 & 2033
- Figure 17: Europe Cruise Tourism Market Revenue Share (%), by Country 2025 & 2033
- Figure 18: Asia Pacific Cruise Tourism Market Revenue (Million), by Type 2025 & 2033
- Figure 19: Asia Pacific Cruise Tourism Market Revenue Share (%), by Type 2025 & 2033
- Figure 20: Asia Pacific Cruise Tourism Market Revenue (Million), by Duration 2025 & 2033
- Figure 21: Asia Pacific Cruise Tourism Market Revenue Share (%), by Duration 2025 & 2033
- Figure 22: Asia Pacific Cruise Tourism Market Revenue (Million), by Passenger Age 2025 & 2033
- Figure 23: Asia Pacific Cruise Tourism Market Revenue Share (%), by Passenger Age 2025 & 2033
- Figure 24: Asia Pacific Cruise Tourism Market Revenue (Million), by Country 2025 & 2033
- Figure 25: Asia Pacific Cruise Tourism Market Revenue Share (%), by Country 2025 & 2033
- Figure 26: South America Cruise Tourism Market Revenue (Million), by Type 2025 & 2033
- Figure 27: South America Cruise Tourism Market Revenue Share (%), by Type 2025 & 2033
- Figure 28: South America Cruise Tourism Market Revenue (Million), by Duration 2025 & 2033
- Figure 29: South America Cruise Tourism Market Revenue Share (%), by Duration 2025 & 2033
- Figure 30: South America Cruise Tourism Market Revenue (Million), by Passenger Age 2025 & 2033
- Figure 31: South America Cruise Tourism Market Revenue Share (%), by Passenger Age 2025 & 2033
- Figure 32: South America Cruise Tourism Market Revenue (Million), by Country 2025 & 2033
- Figure 33: South America Cruise Tourism Market Revenue Share (%), by Country 2025 & 2033
- Figure 34: Middle East Cruise Tourism Market Revenue (Million), by Type 2025 & 2033
- Figure 35: Middle East Cruise Tourism Market Revenue Share (%), by Type 2025 & 2033
- Figure 36: Middle East Cruise Tourism Market Revenue (Million), by Duration 2025 & 2033
- Figure 37: Middle East Cruise Tourism Market Revenue Share (%), by Duration 2025 & 2033
- Figure 38: Middle East Cruise Tourism Market Revenue (Million), by Passenger Age 2025 & 2033
- Figure 39: Middle East Cruise Tourism Market Revenue Share (%), by Passenger Age 2025 & 2033
- Figure 40: Middle East Cruise Tourism Market Revenue (Million), by Country 2025 & 2033
- Figure 41: Middle East Cruise Tourism Market Revenue Share (%), by Country 2025 & 2033
List of Tables
- Table 1: Global Cruise Tourism Market Revenue Million Forecast, by Type 2020 & 2033
- Table 2: Global Cruise Tourism Market Revenue Million Forecast, by Duration 2020 & 2033
- Table 3: Global Cruise Tourism Market Revenue Million Forecast, by Passenger Age 2020 & 2033
- Table 4: Global Cruise Tourism Market Revenue Million Forecast, by Region 2020 & 2033
- Table 5: Global Cruise Tourism Market Revenue Million Forecast, by Type 2020 & 2033
- Table 6: Global Cruise Tourism Market Revenue Million Forecast, by Duration 2020 & 2033
- Table 7: Global Cruise Tourism Market Revenue Million Forecast, by Passenger Age 2020 & 2033
- Table 8: Global Cruise Tourism Market Revenue Million Forecast, by Country 2020 & 2033
- Table 9: US Cruise Tourism Market Revenue (Million) Forecast, by Application 2020 & 2033
- Table 10: Canada Cruise Tourism Market Revenue (Million) Forecast, by Application 2020 & 2033
- Table 11: Mexico Cruise Tourism Market Revenue (Million) Forecast, by Application 2020 & 2033
- Table 12: Rest of North America Cruise Tourism Market Revenue (Million) Forecast, by Application 2020 & 2033
- Table 13: Global Cruise Tourism Market Revenue Million Forecast, by Type 2020 & 2033
- Table 14: Global Cruise Tourism Market Revenue Million Forecast, by Duration 2020 & 2033
- Table 15: Global Cruise Tourism Market Revenue Million Forecast, by Passenger Age 2020 & 2033
- Table 16: Global Cruise Tourism Market Revenue Million Forecast, by Country 2020 & 2033
- Table 17: Germany Cruise Tourism Market Revenue (Million) Forecast, by Application 2020 & 2033
- Table 18: UK Cruise Tourism Market Revenue (Million) Forecast, by Application 2020 & 2033
- Table 19: France Cruise Tourism Market Revenue (Million) Forecast, by Application 2020 & 2033
- Table 20: Russia Cruise Tourism Market Revenue (Million) Forecast, by Application 2020 & 2033
- Table 21: Spain Cruise Tourism Market Revenue (Million) Forecast, by Application 2020 & 2033
- Table 22: Rest of Europe Cruise Tourism Market Revenue (Million) Forecast, by Application 2020 & 2033
- Table 23: Global Cruise Tourism Market Revenue Million Forecast, by Type 2020 & 2033
- Table 24: Global Cruise Tourism Market Revenue Million Forecast, by Duration 2020 & 2033
- Table 25: Global Cruise Tourism Market Revenue Million Forecast, by Passenger Age 2020 & 2033
- Table 26: Global Cruise Tourism Market Revenue Million Forecast, by Country 2020 & 2033
- Table 27: India Cruise Tourism Market Revenue (Million) Forecast, by Application 2020 & 2033
- Table 28: China Cruise Tourism Market Revenue (Million) Forecast, by Application 2020 & 2033
- Table 29: Japan Cruise Tourism Market Revenue (Million) Forecast, by Application 2020 & 2033
- Table 30: Rest of Asia Pacific Cruise Tourism Market Revenue (Million) Forecast, by Application 2020 & 2033
- Table 31: Global Cruise Tourism Market Revenue Million Forecast, by Type 2020 & 2033
- Table 32: Global Cruise Tourism Market Revenue Million Forecast, by Duration 2020 & 2033
- Table 33: Global Cruise Tourism Market Revenue Million Forecast, by Passenger Age 2020 & 2033
- Table 34: Global Cruise Tourism Market Revenue Million Forecast, by Country 2020 & 2033
- Table 35: Brazil Cruise Tourism Market Revenue (Million) Forecast, by Application 2020 & 2033
- Table 36: Argentina Cruise Tourism Market Revenue (Million) Forecast, by Application 2020 & 2033
- Table 37: Rest of South America Cruise Tourism Market Revenue (Million) Forecast, by Application 2020 & 2033
- Table 38: Global Cruise Tourism Market Revenue Million Forecast, by Type 2020 & 2033
- Table 39: Global Cruise Tourism Market Revenue Million Forecast, by Duration 2020 & 2033
- Table 40: Global Cruise Tourism Market Revenue Million Forecast, by Passenger Age 2020 & 2033
- Table 41: Global Cruise Tourism Market Revenue Million Forecast, by Country 2020 & 2033
- Table 42: UAE Cruise Tourism Market Revenue (Million) Forecast, by Application 2020 & 2033
- Table 43: Saudi Arabia Cruise Tourism Market Revenue (Million) Forecast, by Application 2020 & 2033
- Table 44: Rest of Middle East Cruise Tourism Market Revenue (Million) Forecast, by Application 2020 & 2033
Frequently Asked Questions
1. What is the projected Compound Annual Growth Rate (CAGR) of the Cruise Tourism Market?
The projected CAGR is approximately 8.67%.
2. Which companies are prominent players in the Cruise Tourism Market?
Key companies in the market include Princess Cruises, Carnival Corporation & Plc, Norwegian Cruise Line Holdings Ltd, Royal Caribbean Group, Celebrity Cruises, Costa Cruises, Holland America Line, MSC Cruises, Disney Cruise Line, Cunard Line**List Not Exhaustive.
3. What are the main segments of the Cruise Tourism Market?
The market segments include Type, Duration, Passenger Age.
4. Can you provide details about the market size?
The market size is estimated to be USD 9.44 Million as of 2022.
5. What are some drivers contributing to market growth?
Increasing Disposable Income is Driving the Market.
6. What are the notable trends driving market growth?
Increase in Number of Ocean Cruise Passengers in North America.
7. Are there any restraints impacting market growth?
High Costs is Restraining the Market.
8. Can you provide examples of recent developments in the market?
November 2023: TravClan and Resorts World Cruises joined forces in a groundbreaking partnership aimed at revolutionizing cruise tourism in India. Through this collaboration, TravClan embarks on a transformative journey that promises to redefine the landscape of cruise vacations in India, ensuring accessibility and affordability for all.
9. What pricing options are available for accessing the report?
Pricing options include single-user, multi-user, and enterprise licenses priced at USD 4750, USD 5250, and USD 8750 respectively.
10. Is the market size provided in terms of value or volume?
The market size is provided in terms of value, measured in Million.
11. Are there any specific market keywords associated with the report?
Yes, the market keyword associated with the report is "Cruise Tourism Market," which aids in identifying and referencing the specific market segment covered.
12. How do I determine which pricing option suits my needs best?
The pricing options vary based on user requirements and access needs. Individual users may opt for single-user licenses, while businesses requiring broader access may choose multi-user or enterprise licenses for cost-effective access to the report.
13. Are there any additional resources or data provided in the Cruise Tourism Market report?
While the report offers comprehensive insights, it's advisable to review the specific contents or supplementary materials provided to ascertain if additional resources or data are available.
14. How can I stay updated on further developments or reports in the Cruise Tourism Market?
To stay informed about further developments, trends, and reports in the Cruise Tourism Market, consider subscribing to industry newsletters, following relevant companies and organizations, or regularly checking reputable industry news sources and publications.
Methodology
Step 1 - Identification of Relevant Samples Size from Population Database


Step 2 - Approaches for Defining Global Market Size (Value, Volume* & Price*)

Note*: In applicable scenarios
Step 3 - Data Sources
Primary Research
- Web Analytics
- Survey Reports
- Research Institute
- Latest Research Reports
- Opinion Leaders
Secondary Research
- Annual Reports
- White Paper
- Latest Press Release
- Industry Association
- Paid Database
- Investor Presentations

Step 4 - Data Triangulation
Involves using different sources of information in order to increase the validity of a study
These sources are likely to be stakeholders in a program - participants, other researchers, program staff, other community members, and so on.
Then we put all data in single framework & apply various statistical tools to find out the dynamic on the market.
During the analysis stage, feedback from the stakeholder groups would be compared to determine areas of agreement as well as areas of divergence