

Key Insights
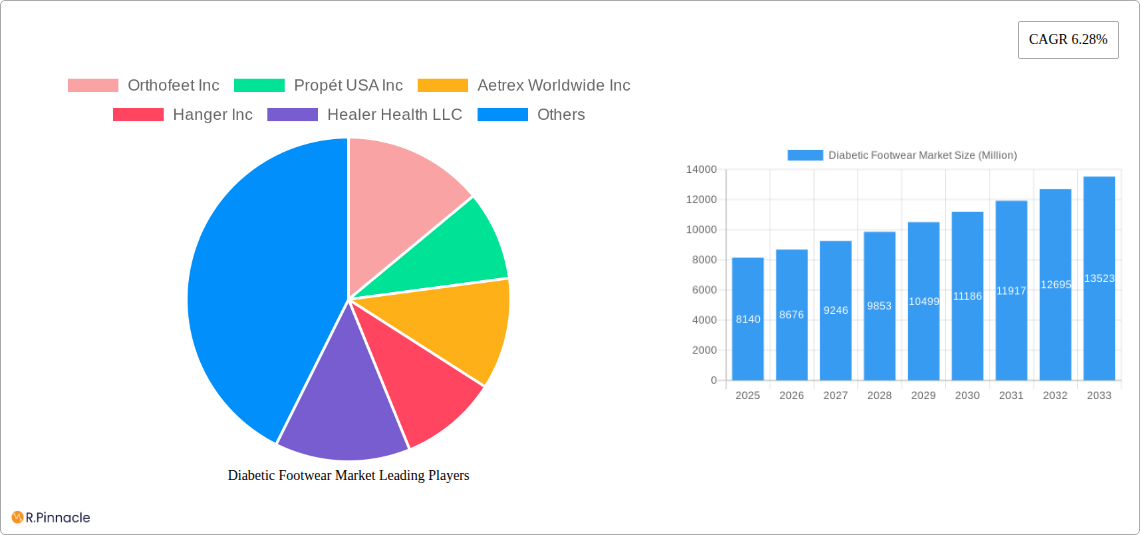
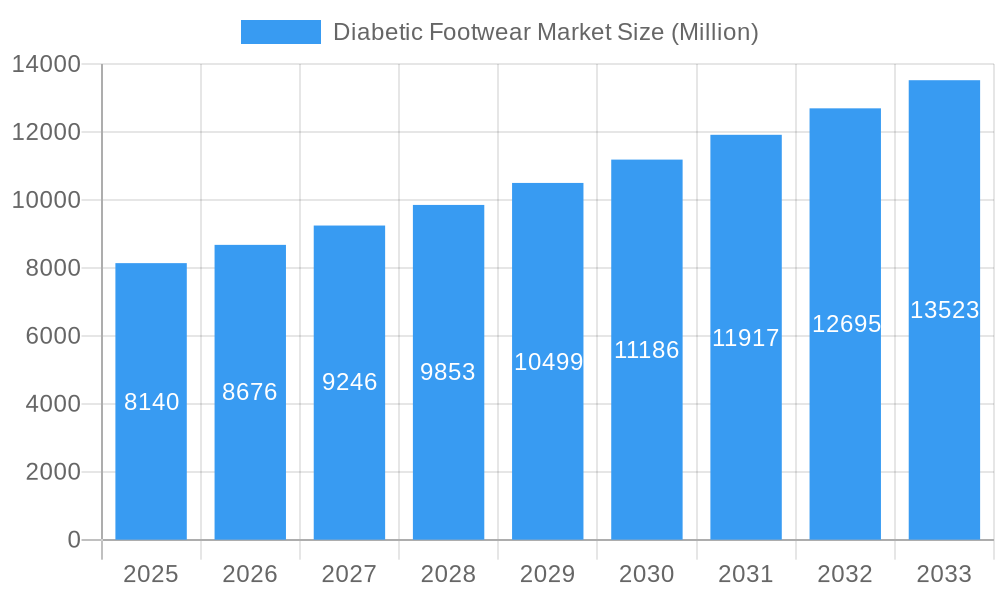
The global diabetic footwear market, valued at $8.14 billion in 2025, is projected to experience robust growth, driven by a rising prevalence of diabetes globally and increasing awareness regarding the importance of specialized footwear for managing diabetic foot complications. The market's Compound Annual Growth Rate (CAGR) of 6.28% from 2025 to 2033 indicates a significant expansion opportunity. Key drivers include the growing geriatric population (a demographic highly susceptible to diabetes), technological advancements in diabetic footwear design (incorporating features like improved cushioning, adjustable straps, and wider toe boxes), and increasing healthcare expenditure on diabetes management. Market segmentation reveals a relatively even split between men and women, with online retail channels gaining traction alongside traditional offline stores. The shoes segment dominates the product type category, reflecting the primary need for daily wear, while sandals and slippers cater to specific needs and preferences. Leading companies like Orthofeet Inc., Propét USA Inc., and Aetrex Worldwide Inc. are shaping market innovation and distribution. Geographic distribution shows strong market presence in North America and Europe, with the Asia-Pacific region exhibiting significant growth potential due to rising diabetes prevalence and increasing disposable incomes. Factors like the high cost of specialized footwear and limited access to quality products in certain regions represent key market restraints.
Diabetic Footwear Market Market Size (In Billion)
The forecast period (2025-2033) presents promising prospects for market players. Strategic partnerships between footwear manufacturers and healthcare providers can enhance market penetration. Furthermore, focusing on product innovation, particularly incorporating advanced materials and technologies for enhanced comfort and therapeutic benefits, will be critical for success. The increasing focus on preventive healthcare and personalized medicine will further drive market expansion. The market's growth trajectory is expected to be influenced by factors such as government initiatives to improve diabetes management, rising healthcare insurance coverage, and technological innovations aimed at improving the comfort and functionality of diabetic footwear. The competitive landscape will continue to evolve, with companies focusing on expanding their product portfolios, enhancing their distribution networks, and investing in research and development to meet the evolving needs of diabetic patients.
Diabetic Footwear Market Company Market Share
Diabetic Footwear Market Report: 2019-2033
This comprehensive report provides a detailed analysis of the Diabetic Footwear Market, offering invaluable insights for industry professionals, investors, and strategic decision-makers. Covering the period from 2019 to 2033, with a focus on 2025, this report unveils market trends, competitive dynamics, and future growth potential within this crucial healthcare sector. The global market size is projected to reach xx Million by 2033, presenting significant opportunities for growth and innovation.
Diabetic Footwear Market Structure & Innovation Trends
The Diabetic Footwear Market is characterized by a moderately concentrated landscape with several key players holding significant market share. Orthofeet Inc, Propét USA Inc, Aetrex Worldwide Inc, Hanger Inc, Healer Health LLC, Pilgrim Shoes, Drew Shoe Corporation, DJO Global Inc, Dr. Zen Products Inc, and Podartis srl Unipersonale are some of the major players, although the market is not limited to these companies. Market share data for these companies is currently unavailable and requires further investigation to be included, but it is a key metric to be considered. The market exhibits continuous innovation driven by advancements in materials science, 3D printing technology, and personalized footwear solutions. Stringent regulatory frameworks, particularly concerning safety and efficacy, shape market dynamics. Product substitutes such as custom orthotics exist, though specialized diabetic footwear offers superior comfort and protection. The end-user demographic is largely skewed towards the aging population with pre-existing conditions like diabetes. Recent years have witnessed moderate M&A activity, with deal values in the range of xx Million.
- Market Concentration: Moderately concentrated
- Innovation Drivers: Advancements in materials, 3D printing, personalization
- Regulatory Frameworks: Stringent safety and efficacy standards
- M&A Activity: Moderate, with deals valued at approximately xx Million
Diabetic Footwear Market Dynamics & Trends
The Diabetic Footwear Market is experiencing robust growth, fueled by rising diabetic prevalence globally and increasing awareness of the importance of foot care in managing the condition. Technological advancements, such as the integration of sensor technology and personalized fitting solutions, are driving market transformation. Consumer preferences are shifting towards comfortable, stylish, and technologically advanced footwear. Competitive dynamics are characterized by innovation, brand building, and strategic partnerships. The compound annual growth rate (CAGR) for the forecast period (2025-2033) is estimated at xx%, indicating strong market expansion. Market penetration of technologically advanced diabetic footwear is gradually increasing.
Dominant Regions & Segments in Diabetic Footwear Market
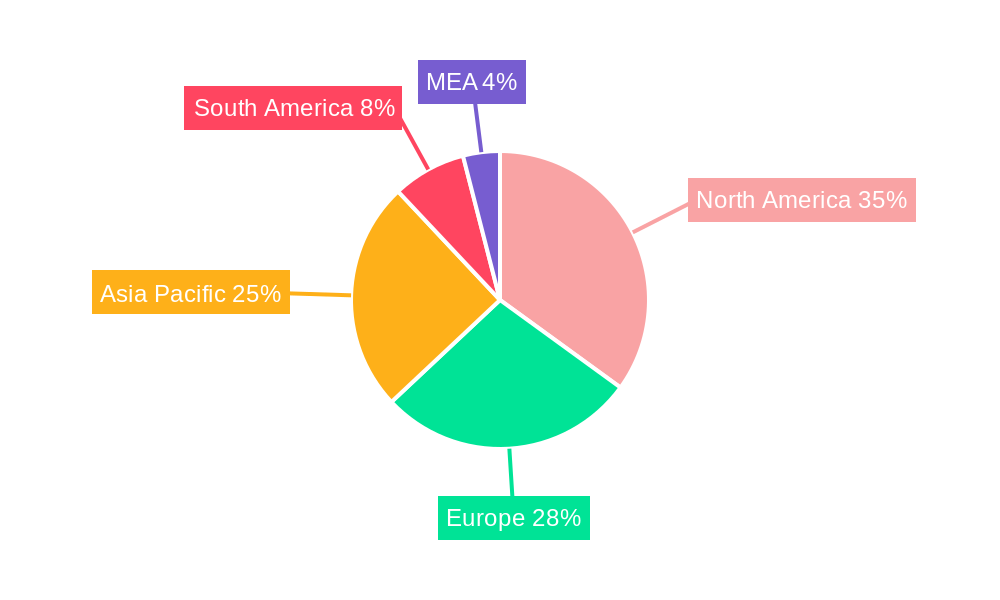
North America currently dominates the Diabetic Footwear Market, driven by high diabetic prevalence, strong healthcare infrastructure, and high disposable income. Within this region, the United States holds the largest market share.
- By End-User: The men's segment holds a slightly larger market share than the women's segment due to a higher prevalence of diabetes in men.
- By Distribution Channel: Offline retail stores currently dominate the distribution channel, although online retail stores are experiencing significant growth, driven by increased e-commerce adoption and convenience.
- By Product Type: Shoes represent the largest segment, followed by sandals and slippers.
Key drivers include robust healthcare infrastructure, increasing awareness of diabetic foot care, and strong regulatory support for diabetic footwear. Other regions, such as Europe and Asia-Pacific, are also witnessing considerable growth, albeit at a slower pace compared to North America. Growth in these regions is driven by increasing diabetes prevalence, rising healthcare expenditure, and improving access to advanced healthcare facilities.
Diabetic Footwear Market Product Innovations
The diabetic footwear market is experiencing a surge of innovation, driven by the imperative to improve patient comfort, prevent complications, and enhance overall foot health. Recent advancements include the integration of cutting-edge materials such as advanced cushioning foams, breathable and moisture-wicking fabrics, and antimicrobial linings that actively combat odor and infection. Furthermore, personalized fitting technologies are evolving rapidly, with the adoption of AI-powered gait analysis and sophisticated 3D scanning techniques allowing for truly custom-fit solutions. These technologies not only optimize comfort but also significantly reduce the risk of pressure points, friction, and subsequent ulcerations. The incorporation of embedded sensor technology is another groundbreaking development, enabling real-time monitoring of foot temperature, pressure distribution, and even early signs of edema, providing invaluable data for both patients and healthcare providers. These innovations are not merely incremental; they are transforming the user experience, leading to improved treatment outcomes, and establishing a distinct competitive advantage for forward-thinking manufacturers. The market is witnessing a powerful and sustained push towards bespoke footwear, meticulously crafted through the synergy of 3D scanning precision and advanced manufacturing processes.
Report Scope & Segmentation Analysis
This report segments the Diabetic Footwear Market by end-user (men, women), distribution channel (offline retail stores, online retail stores), and product type (shoes, sandals, slippers). Growth projections for each segment vary, with the shoes segment exhibiting the highest growth rate, driven by the wide range of available styles and features. Competitive dynamics within each segment differ based on brand positioning, product innovation, and distribution strategies. Market sizes for each segment are projected to grow significantly over the forecast period.
Key Drivers of Diabetic Footwear Market Growth
The Diabetic Footwear Market's growth is primarily driven by several factors: rising global prevalence of diabetes, increased awareness regarding the importance of foot care in diabetes management, advancements in materials science leading to more comfortable and functional footwear, and the growing adoption of technologically advanced footwear incorporating sensors and personalized fitting technologies. Government initiatives promoting diabetes prevention and management programs also contribute significantly to market expansion.
Challenges in the Diabetic Footwear Market Sector
The Diabetic Footwear Market faces challenges such as the high cost of advanced diabetic footwear, potentially limiting access for some patients. Supply chain disruptions and fluctuations in raw material prices can impact production costs and market stability. Intense competition among manufacturers necessitates continuous innovation and effective marketing strategies to maintain market share. Regulatory compliance requirements can be complex and costly, adding to operational challenges.
Emerging Opportunities in Diabetic Footwear Market
The landscape of the diabetic footwear market is ripe with emerging opportunities, reflecting both evolving healthcare paradigms and increasing patient needs. The burgeoning adoption of telemedicine and remote patient monitoring is creating a significant demand for digitally connected diabetic footwear. These smart shoes can transmit vital foot health data directly to healthcare professionals, facilitating proactive interventions and personalized care plans. The overarching trend towards personalized medicine and the demand for truly custom-fit solutions represents a substantial growth avenue for companies specializing in tailored footwear options that precisely address individual foot deformities and biomechanical issues. Beyond technological and customization aspects, there is immense potential in expanding into emerging markets characterized by a high prevalence of diabetes and a rapidly developing healthcare infrastructure. These regions offer untapped potential for both established and new players to establish a strong market presence and contribute to improved diabetic foot care globally.
Leading Players in the Diabetic Footwear Market Market
- Orthofeet Inc
- Propét USA Inc
- Aetrex Worldwide Inc
- Hanger Inc
- Healer Health LLC
- Pilgrim Shoes
- Drew Shoe Corporation
- DJO Global Inc
- Dr. Zen Products Inc
- Podartis srl Unipersonale
Key Developments in Diabetic Footwear Market Industry
- November 2023: Aetrex, a leader in foot health technology, launched FitStarter, an innovative personalized footwear recommendation platform designed to revolutionize the shoe fitting process. This initiative aims to enhance customer satisfaction by improving accuracy, minimizing returns, and ensuring a superior footwear experience for all consumers, including those with specific diabetic needs.
- November 2023: Fyous, a company at the forefront of custom-fit footwear technology, successfully secured a substantial GBP 1.4 Million grant. This funding will fuel the expansion of their advanced 3D-scanning and custom-fit footwear solutions specifically for diabetic patients, with a critical objective of significantly reducing the incidence of amputations.
- February 2022: The American Diabetes Association (ADA), a pivotal organization in diabetes advocacy and research, announced a significant partnership with Dr. Comfort, a renowned provider of therapeutic footwear. This collaboration is dedicated to advancing the prevention, education, and treatment strategies for diabetic foot complications, underscoring a unified commitment to better patient outcomes.
Future Outlook for Diabetic Footwear Market Market
The Diabetic Footwear Market is on a trajectory for sustained and robust expansion in the coming years. This growth will be propelled by a confluence of factors, including the persistently increasing global diabetic population, continuous technological advancements that enhance product functionality and personalization, and a heightened societal awareness regarding the critical importance of preventive foot care for individuals with diabetes. Strategic opportunities abound for market players to capitalize on these trends by developing next-generation, highly innovative, and personalized footwear solutions that address a wider spectrum of patient needs. Furthermore, strategic market entry and expansion into new geographical regions with high diabetes prevalence and developing healthcare systems offer significant avenues for growth. The integration and leveraging of digital technologies, from smart footwear to telehealth platforms, will be instrumental in improving patient care delivery, enhancing accessibility, and ultimately driving better health outcomes. The market is firmly projected to maintain a strong and consistent growth trajectory throughout the foreseeable forecast period, underscoring its critical role in managing diabetic health.
Diabetic Footwear Market Segmentation
-
1. Product Type
- 1.1. Shoes
- 1.2. Sandals
- 1.3. Slippers
-
2. End-User
- 2.1. Men
- 2.2. Women
-
3. Distribution Channel
- 3.1. Offline Retail Stores
- 3.2. Online Retail Stores
Diabetic Footwear Market Segmentation By Geography
-
1. North America
- 1.1. United States
- 1.2. Canada
- 1.3. Mexico
- 1.4. Rest of North America
-
2. Europe
- 2.1. United Kingdom
- 2.2. Germany
- 2.3. France
- 2.4. Italy
- 2.5. Spain
- 2.6. Russia
- 2.7. Rest of Europe
-
3. Asia Pacific
- 3.1. China
- 3.2. Japan
- 3.3. India
- 3.4. Australia
- 3.5. Rest of Asia Pacific
-
4. Rest of the World
- 4.1. South America
- 4.2. Middle East and Africa
Diabetic Footwear Market Regional Market Share
Geographic Coverage of Diabetic Footwear Market
Diabetic Footwear Market REPORT HIGHLIGHTS
| Aspects | Details |
|---|---|
| Study Period | 2020-2034 |
| Base Year | 2025 |
| Estimated Year | 2026 |
| Forecast Period | 2026-2034 |
| Historical Period | 2020-2025 |
| Growth Rate | CAGR of 6.28% from 2020-2034 |
| Segmentation |
|
Table of Contents
- 1. Introduction
- 1.1. Research Scope
- 1.2. Market Segmentation
- 1.3. Research Objective
- 1.4. Definitions and Assumptions
- 2. Executive Summary
- 2.1. Market Snapshot
- 3. Market Dynamics
- 3.1. Market Drivers
- 3.2. Market Restrains
- 3.3. Market Trends
- 3.4. Market Opportunities
- 4. Market Factor Analysis
- 4.1. Porters Five Forces
- 4.1.1. Bargaining Power of Suppliers
- 4.1.2. Bargaining Power of Buyers
- 4.1.3. Threat of New Entrants
- 4.1.4. Threat of Substitutes
- 4.1.5. Competitive Rivalry
- 4.2. PESTEL analysis
- 4.3. BCG Analysis
- 4.3.1. Stars (High Growth, High Market Share)
- 4.3.2. Cash Cows (Low Growth, High Market Share)
- 4.3.3. Question Mark (High Growth, Low Market Share)
- 4.3.4. Dogs (Low Growth, Low Market Share)
- 4.4. Ansoff Matrix Analysis
- 4.5. Supply Chain Analysis
- 4.6. Regulatory Landscape
- 4.7. Current Market Potential and Opportunity Assessment (TAM–SAM–SOM Framework)
- 4.8. PRI Analyst Note
- 4.1. Porters Five Forces
- 5. Market Analysis, Insights and Forecast 2021-2033
- 5.1. Market Analysis, Insights and Forecast - by Product Type
- 5.1.1. Shoes
- 5.1.2. Sandals
- 5.1.3. Slippers
- 5.2. Market Analysis, Insights and Forecast - by End-User
- 5.2.1. Men
- 5.2.2. Women
- 5.3. Market Analysis, Insights and Forecast - by Distribution Channel
- 5.3.1. Offline Retail Stores
- 5.3.2. Online Retail Stores
- 5.4. Market Analysis, Insights and Forecast - by Region
- 5.4.1. North America
- 5.4.2. Europe
- 5.4.3. Asia Pacific
- 5.4.4. Rest of the World
- 5.1. Market Analysis, Insights and Forecast - by Product Type
- 6. Global Diabetic Footwear Market Analysis, Insights and Forecast, 2021-2033
- 6.1. Market Analysis, Insights and Forecast - by Product Type
- 6.1.1. Shoes
- 6.1.2. Sandals
- 6.1.3. Slippers
- 6.2. Market Analysis, Insights and Forecast - by End-User
- 6.2.1. Men
- 6.2.2. Women
- 6.3. Market Analysis, Insights and Forecast - by Distribution Channel
- 6.3.1. Offline Retail Stores
- 6.3.2. Online Retail Stores
- 6.1. Market Analysis, Insights and Forecast - by Product Type
- 7. North America Diabetic Footwear Market Analysis, Insights and Forecast, 2020-2032
- 7.1. Market Analysis, Insights and Forecast - by Product Type
- 7.1.1. Shoes
- 7.1.2. Sandals
- 7.1.3. Slippers
- 7.2. Market Analysis, Insights and Forecast - by End-User
- 7.2.1. Men
- 7.2.2. Women
- 7.3. Market Analysis, Insights and Forecast - by Distribution Channel
- 7.3.1. Offline Retail Stores
- 7.3.2. Online Retail Stores
- 7.1. Market Analysis, Insights and Forecast - by Product Type
- 8. Europe Diabetic Footwear Market Analysis, Insights and Forecast, 2020-2032
- 8.1. Market Analysis, Insights and Forecast - by Product Type
- 8.1.1. Shoes
- 8.1.2. Sandals
- 8.1.3. Slippers
- 8.2. Market Analysis, Insights and Forecast - by End-User
- 8.2.1. Men
- 8.2.2. Women
- 8.3. Market Analysis, Insights and Forecast - by Distribution Channel
- 8.3.1. Offline Retail Stores
- 8.3.2. Online Retail Stores
- 8.1. Market Analysis, Insights and Forecast - by Product Type
- 9. Asia Pacific Diabetic Footwear Market Analysis, Insights and Forecast, 2020-2032
- 9.1. Market Analysis, Insights and Forecast - by Product Type
- 9.1.1. Shoes
- 9.1.2. Sandals
- 9.1.3. Slippers
- 9.2. Market Analysis, Insights and Forecast - by End-User
- 9.2.1. Men
- 9.2.2. Women
- 9.3. Market Analysis, Insights and Forecast - by Distribution Channel
- 9.3.1. Offline Retail Stores
- 9.3.2. Online Retail Stores
- 9.1. Market Analysis, Insights and Forecast - by Product Type
- 10. Rest of the World Diabetic Footwear Market Analysis, Insights and Forecast, 2020-2032
- 10.1. Market Analysis, Insights and Forecast - by Product Type
- 10.1.1. Shoes
- 10.1.2. Sandals
- 10.1.3. Slippers
- 10.2. Market Analysis, Insights and Forecast - by End-User
- 10.2.1. Men
- 10.2.2. Women
- 10.3. Market Analysis, Insights and Forecast - by Distribution Channel
- 10.3.1. Offline Retail Stores
- 10.3.2. Online Retail Stores
- 10.1. Market Analysis, Insights and Forecast - by Product Type
- 11. Competitive Analysis
- 11.1. Company Profiles
- 11.1.1 Orthofeet Inc
- 11.1.1.1. Company Overview
- 11.1.1.2. Products
- 11.1.1.3. Company Financials
- 11.1.1.4. SWOT Analysis
- 11.1.2 Propét USA Inc
- 11.1.2.1. Company Overview
- 11.1.2.2. Products
- 11.1.2.3. Company Financials
- 11.1.2.4. SWOT Analysis
- 11.1.3 Aetrex Worldwide Inc
- 11.1.3.1. Company Overview
- 11.1.3.2. Products
- 11.1.3.3. Company Financials
- 11.1.3.4. SWOT Analysis
- 11.1.4 Hanger Inc
- 11.1.4.1. Company Overview
- 11.1.4.2. Products
- 11.1.4.3. Company Financials
- 11.1.4.4. SWOT Analysis
- 11.1.5 Healer Health LLC
- 11.1.5.1. Company Overview
- 11.1.5.2. Products
- 11.1.5.3. Company Financials
- 11.1.5.4. SWOT Analysis
- 11.1.6 Pilgrim Shoes*List Not Exhaustive
- 11.1.6.1. Company Overview
- 11.1.6.2. Products
- 11.1.6.3. Company Financials
- 11.1.6.4. SWOT Analysis
- 11.1.7 Drew Shoe Corporation
- 11.1.7.1. Company Overview
- 11.1.7.2. Products
- 11.1.7.3. Company Financials
- 11.1.7.4. SWOT Analysis
- 11.1.8 DJO Global Inc
- 11.1.8.1. Company Overview
- 11.1.8.2. Products
- 11.1.8.3. Company Financials
- 11.1.8.4. SWOT Analysis
- 11.1.9 Dr Zen Products Inc
- 11.1.9.1. Company Overview
- 11.1.9.2. Products
- 11.1.9.3. Company Financials
- 11.1.9.4. SWOT Analysis
- 11.1.10 Podartis srl Unipersonale
- 11.1.10.1. Company Overview
- 11.1.10.2. Products
- 11.1.10.3. Company Financials
- 11.1.10.4. SWOT Analysis
- 11.1.1 Orthofeet Inc
- 11.2. Market Entropy
- 11.2.1 Company's Key Areas Served
- 11.2.2 Recent Developments
- 11.3. Company Market Share Analysis 2025
- 11.3.1 Top 5 Companies Market Share Analysis
- 11.3.2 Top 3 Companies Market Share Analysis
- 11.4. List of Potential Customers
- 12. Research Methodology
List of Figures
- Figure 1: Global Diabetic Footwear Market Revenue Breakdown (Million, %) by Region 2025 & 2033
- Figure 2: Global Diabetic Footwear Market Volume Breakdown (K Units, %) by Region 2025 & 2033
- Figure 3: North America Diabetic Footwear Market Revenue (Million), by Product Type 2025 & 2033
- Figure 4: North America Diabetic Footwear Market Volume (K Units), by Product Type 2025 & 2033
- Figure 5: North America Diabetic Footwear Market Revenue Share (%), by Product Type 2025 & 2033
- Figure 6: North America Diabetic Footwear Market Volume Share (%), by Product Type 2025 & 2033
- Figure 7: North America Diabetic Footwear Market Revenue (Million), by End-User 2025 & 2033
- Figure 8: North America Diabetic Footwear Market Volume (K Units), by End-User 2025 & 2033
- Figure 9: North America Diabetic Footwear Market Revenue Share (%), by End-User 2025 & 2033
- Figure 10: North America Diabetic Footwear Market Volume Share (%), by End-User 2025 & 2033
- Figure 11: North America Diabetic Footwear Market Revenue (Million), by Distribution Channel 2025 & 2033
- Figure 12: North America Diabetic Footwear Market Volume (K Units), by Distribution Channel 2025 & 2033
- Figure 13: North America Diabetic Footwear Market Revenue Share (%), by Distribution Channel 2025 & 2033
- Figure 14: North America Diabetic Footwear Market Volume Share (%), by Distribution Channel 2025 & 2033
- Figure 15: North America Diabetic Footwear Market Revenue (Million), by Country 2025 & 2033
- Figure 16: North America Diabetic Footwear Market Volume (K Units), by Country 2025 & 2033
- Figure 17: North America Diabetic Footwear Market Revenue Share (%), by Country 2025 & 2033
- Figure 18: North America Diabetic Footwear Market Volume Share (%), by Country 2025 & 2033
- Figure 19: Europe Diabetic Footwear Market Revenue (Million), by Product Type 2025 & 2033
- Figure 20: Europe Diabetic Footwear Market Volume (K Units), by Product Type 2025 & 2033
- Figure 21: Europe Diabetic Footwear Market Revenue Share (%), by Product Type 2025 & 2033
- Figure 22: Europe Diabetic Footwear Market Volume Share (%), by Product Type 2025 & 2033
- Figure 23: Europe Diabetic Footwear Market Revenue (Million), by End-User 2025 & 2033
- Figure 24: Europe Diabetic Footwear Market Volume (K Units), by End-User 2025 & 2033
- Figure 25: Europe Diabetic Footwear Market Revenue Share (%), by End-User 2025 & 2033
- Figure 26: Europe Diabetic Footwear Market Volume Share (%), by End-User 2025 & 2033
- Figure 27: Europe Diabetic Footwear Market Revenue (Million), by Distribution Channel 2025 & 2033
- Figure 28: Europe Diabetic Footwear Market Volume (K Units), by Distribution Channel 2025 & 2033
- Figure 29: Europe Diabetic Footwear Market Revenue Share (%), by Distribution Channel 2025 & 2033
- Figure 30: Europe Diabetic Footwear Market Volume Share (%), by Distribution Channel 2025 & 2033
- Figure 31: Europe Diabetic Footwear Market Revenue (Million), by Country 2025 & 2033
- Figure 32: Europe Diabetic Footwear Market Volume (K Units), by Country 2025 & 2033
- Figure 33: Europe Diabetic Footwear Market Revenue Share (%), by Country 2025 & 2033
- Figure 34: Europe Diabetic Footwear Market Volume Share (%), by Country 2025 & 2033
- Figure 35: Asia Pacific Diabetic Footwear Market Revenue (Million), by Product Type 2025 & 2033
- Figure 36: Asia Pacific Diabetic Footwear Market Volume (K Units), by Product Type 2025 & 2033
- Figure 37: Asia Pacific Diabetic Footwear Market Revenue Share (%), by Product Type 2025 & 2033
- Figure 38: Asia Pacific Diabetic Footwear Market Volume Share (%), by Product Type 2025 & 2033
- Figure 39: Asia Pacific Diabetic Footwear Market Revenue (Million), by End-User 2025 & 2033
- Figure 40: Asia Pacific Diabetic Footwear Market Volume (K Units), by End-User 2025 & 2033
- Figure 41: Asia Pacific Diabetic Footwear Market Revenue Share (%), by End-User 2025 & 2033
- Figure 42: Asia Pacific Diabetic Footwear Market Volume Share (%), by End-User 2025 & 2033
- Figure 43: Asia Pacific Diabetic Footwear Market Revenue (Million), by Distribution Channel 2025 & 2033
- Figure 44: Asia Pacific Diabetic Footwear Market Volume (K Units), by Distribution Channel 2025 & 2033
- Figure 45: Asia Pacific Diabetic Footwear Market Revenue Share (%), by Distribution Channel 2025 & 2033
- Figure 46: Asia Pacific Diabetic Footwear Market Volume Share (%), by Distribution Channel 2025 & 2033
- Figure 47: Asia Pacific Diabetic Footwear Market Revenue (Million), by Country 2025 & 2033
- Figure 48: Asia Pacific Diabetic Footwear Market Volume (K Units), by Country 2025 & 2033
- Figure 49: Asia Pacific Diabetic Footwear Market Revenue Share (%), by Country 2025 & 2033
- Figure 50: Asia Pacific Diabetic Footwear Market Volume Share (%), by Country 2025 & 2033
- Figure 51: Rest of the World Diabetic Footwear Market Revenue (Million), by Product Type 2025 & 2033
- Figure 52: Rest of the World Diabetic Footwear Market Volume (K Units), by Product Type 2025 & 2033
- Figure 53: Rest of the World Diabetic Footwear Market Revenue Share (%), by Product Type 2025 & 2033
- Figure 54: Rest of the World Diabetic Footwear Market Volume Share (%), by Product Type 2025 & 2033
- Figure 55: Rest of the World Diabetic Footwear Market Revenue (Million), by End-User 2025 & 2033
- Figure 56: Rest of the World Diabetic Footwear Market Volume (K Units), by End-User 2025 & 2033
- Figure 57: Rest of the World Diabetic Footwear Market Revenue Share (%), by End-User 2025 & 2033
- Figure 58: Rest of the World Diabetic Footwear Market Volume Share (%), by End-User 2025 & 2033
- Figure 59: Rest of the World Diabetic Footwear Market Revenue (Million), by Distribution Channel 2025 & 2033
- Figure 60: Rest of the World Diabetic Footwear Market Volume (K Units), by Distribution Channel 2025 & 2033
- Figure 61: Rest of the World Diabetic Footwear Market Revenue Share (%), by Distribution Channel 2025 & 2033
- Figure 62: Rest of the World Diabetic Footwear Market Volume Share (%), by Distribution Channel 2025 & 2033
- Figure 63: Rest of the World Diabetic Footwear Market Revenue (Million), by Country 2025 & 2033
- Figure 64: Rest of the World Diabetic Footwear Market Volume (K Units), by Country 2025 & 2033
- Figure 65: Rest of the World Diabetic Footwear Market Revenue Share (%), by Country 2025 & 2033
- Figure 66: Rest of the World Diabetic Footwear Market Volume Share (%), by Country 2025 & 2033
List of Tables
- Table 1: Global Diabetic Footwear Market Revenue Million Forecast, by Product Type 2020 & 2033
- Table 2: Global Diabetic Footwear Market Volume K Units Forecast, by Product Type 2020 & 2033
- Table 3: Global Diabetic Footwear Market Revenue Million Forecast, by End-User 2020 & 2033
- Table 4: Global Diabetic Footwear Market Volume K Units Forecast, by End-User 2020 & 2033
- Table 5: Global Diabetic Footwear Market Revenue Million Forecast, by Distribution Channel 2020 & 2033
- Table 6: Global Diabetic Footwear Market Volume K Units Forecast, by Distribution Channel 2020 & 2033
- Table 7: Global Diabetic Footwear Market Revenue Million Forecast, by Region 2020 & 2033
- Table 8: Global Diabetic Footwear Market Volume K Units Forecast, by Region 2020 & 2033
- Table 9: Global Diabetic Footwear Market Revenue Million Forecast, by Product Type 2020 & 2033
- Table 10: Global Diabetic Footwear Market Volume K Units Forecast, by Product Type 2020 & 2033
- Table 11: Global Diabetic Footwear Market Revenue Million Forecast, by End-User 2020 & 2033
- Table 12: Global Diabetic Footwear Market Volume K Units Forecast, by End-User 2020 & 2033
- Table 13: Global Diabetic Footwear Market Revenue Million Forecast, by Distribution Channel 2020 & 2033
- Table 14: Global Diabetic Footwear Market Volume K Units Forecast, by Distribution Channel 2020 & 2033
- Table 15: Global Diabetic Footwear Market Revenue Million Forecast, by Country 2020 & 2033
- Table 16: Global Diabetic Footwear Market Volume K Units Forecast, by Country 2020 & 2033
- Table 17: United States Diabetic Footwear Market Revenue (Million) Forecast, by Application 2020 & 2033
- Table 18: United States Diabetic Footwear Market Volume (K Units) Forecast, by Application 2020 & 2033
- Table 19: Canada Diabetic Footwear Market Revenue (Million) Forecast, by Application 2020 & 2033
- Table 20: Canada Diabetic Footwear Market Volume (K Units) Forecast, by Application 2020 & 2033
- Table 21: Mexico Diabetic Footwear Market Revenue (Million) Forecast, by Application 2020 & 2033
- Table 22: Mexico Diabetic Footwear Market Volume (K Units) Forecast, by Application 2020 & 2033
- Table 23: Rest of North America Diabetic Footwear Market Revenue (Million) Forecast, by Application 2020 & 2033
- Table 24: Rest of North America Diabetic Footwear Market Volume (K Units) Forecast, by Application 2020 & 2033
- Table 25: Global Diabetic Footwear Market Revenue Million Forecast, by Product Type 2020 & 2033
- Table 26: Global Diabetic Footwear Market Volume K Units Forecast, by Product Type 2020 & 2033
- Table 27: Global Diabetic Footwear Market Revenue Million Forecast, by End-User 2020 & 2033
- Table 28: Global Diabetic Footwear Market Volume K Units Forecast, by End-User 2020 & 2033
- Table 29: Global Diabetic Footwear Market Revenue Million Forecast, by Distribution Channel 2020 & 2033
- Table 30: Global Diabetic Footwear Market Volume K Units Forecast, by Distribution Channel 2020 & 2033
- Table 31: Global Diabetic Footwear Market Revenue Million Forecast, by Country 2020 & 2033
- Table 32: Global Diabetic Footwear Market Volume K Units Forecast, by Country 2020 & 2033
- Table 33: United Kingdom Diabetic Footwear Market Revenue (Million) Forecast, by Application 2020 & 2033
- Table 34: United Kingdom Diabetic Footwear Market Volume (K Units) Forecast, by Application 2020 & 2033
- Table 35: Germany Diabetic Footwear Market Revenue (Million) Forecast, by Application 2020 & 2033
- Table 36: Germany Diabetic Footwear Market Volume (K Units) Forecast, by Application 2020 & 2033
- Table 37: France Diabetic Footwear Market Revenue (Million) Forecast, by Application 2020 & 2033
- Table 38: France Diabetic Footwear Market Volume (K Units) Forecast, by Application 2020 & 2033
- Table 39: Italy Diabetic Footwear Market Revenue (Million) Forecast, by Application 2020 & 2033
- Table 40: Italy Diabetic Footwear Market Volume (K Units) Forecast, by Application 2020 & 2033
- Table 41: Spain Diabetic Footwear Market Revenue (Million) Forecast, by Application 2020 & 2033
- Table 42: Spain Diabetic Footwear Market Volume (K Units) Forecast, by Application 2020 & 2033
- Table 43: Russia Diabetic Footwear Market Revenue (Million) Forecast, by Application 2020 & 2033
- Table 44: Russia Diabetic Footwear Market Volume (K Units) Forecast, by Application 2020 & 2033
- Table 45: Rest of Europe Diabetic Footwear Market Revenue (Million) Forecast, by Application 2020 & 2033
- Table 46: Rest of Europe Diabetic Footwear Market Volume (K Units) Forecast, by Application 2020 & 2033
- Table 47: Global Diabetic Footwear Market Revenue Million Forecast, by Product Type 2020 & 2033
- Table 48: Global Diabetic Footwear Market Volume K Units Forecast, by Product Type 2020 & 2033
- Table 49: Global Diabetic Footwear Market Revenue Million Forecast, by End-User 2020 & 2033
- Table 50: Global Diabetic Footwear Market Volume K Units Forecast, by End-User 2020 & 2033
- Table 51: Global Diabetic Footwear Market Revenue Million Forecast, by Distribution Channel 2020 & 2033
- Table 52: Global Diabetic Footwear Market Volume K Units Forecast, by Distribution Channel 2020 & 2033
- Table 53: Global Diabetic Footwear Market Revenue Million Forecast, by Country 2020 & 2033
- Table 54: Global Diabetic Footwear Market Volume K Units Forecast, by Country 2020 & 2033
- Table 55: China Diabetic Footwear Market Revenue (Million) Forecast, by Application 2020 & 2033
- Table 56: China Diabetic Footwear Market Volume (K Units) Forecast, by Application 2020 & 2033
- Table 57: Japan Diabetic Footwear Market Revenue (Million) Forecast, by Application 2020 & 2033
- Table 58: Japan Diabetic Footwear Market Volume (K Units) Forecast, by Application 2020 & 2033
- Table 59: India Diabetic Footwear Market Revenue (Million) Forecast, by Application 2020 & 2033
- Table 60: India Diabetic Footwear Market Volume (K Units) Forecast, by Application 2020 & 2033
- Table 61: Australia Diabetic Footwear Market Revenue (Million) Forecast, by Application 2020 & 2033
- Table 62: Australia Diabetic Footwear Market Volume (K Units) Forecast, by Application 2020 & 2033
- Table 63: Rest of Asia Pacific Diabetic Footwear Market Revenue (Million) Forecast, by Application 2020 & 2033
- Table 64: Rest of Asia Pacific Diabetic Footwear Market Volume (K Units) Forecast, by Application 2020 & 2033
- Table 65: Global Diabetic Footwear Market Revenue Million Forecast, by Product Type 2020 & 2033
- Table 66: Global Diabetic Footwear Market Volume K Units Forecast, by Product Type 2020 & 2033
- Table 67: Global Diabetic Footwear Market Revenue Million Forecast, by End-User 2020 & 2033
- Table 68: Global Diabetic Footwear Market Volume K Units Forecast, by End-User 2020 & 2033
- Table 69: Global Diabetic Footwear Market Revenue Million Forecast, by Distribution Channel 2020 & 2033
- Table 70: Global Diabetic Footwear Market Volume K Units Forecast, by Distribution Channel 2020 & 2033
- Table 71: Global Diabetic Footwear Market Revenue Million Forecast, by Country 2020 & 2033
- Table 72: Global Diabetic Footwear Market Volume K Units Forecast, by Country 2020 & 2033
- Table 73: South America Diabetic Footwear Market Revenue (Million) Forecast, by Application 2020 & 2033
- Table 74: South America Diabetic Footwear Market Volume (K Units) Forecast, by Application 2020 & 2033
- Table 75: Middle East and Africa Diabetic Footwear Market Revenue (Million) Forecast, by Application 2020 & 2033
- Table 76: Middle East and Africa Diabetic Footwear Market Volume (K Units) Forecast, by Application 2020 & 2033
Frequently Asked Questions
1. What is the projected Compound Annual Growth Rate (CAGR) of the Diabetic Footwear Market?
The projected CAGR is approximately 6.28%.
2. Which companies are prominent players in the Diabetic Footwear Market?
Key companies in the market include Orthofeet Inc, Propét USA Inc, Aetrex Worldwide Inc, Hanger Inc, Healer Health LLC, Pilgrim Shoes*List Not Exhaustive, Drew Shoe Corporation, DJO Global Inc, Dr Zen Products Inc, Podartis srl Unipersonale.
3. What are the main segments of the Diabetic Footwear Market?
The market segments include Product Type, End-User, Distribution Channel.
4. Can you provide details about the market size?
The market size is estimated to be USD 8.14 Million as of 2022.
5. What are some drivers contributing to market growth?
Rising Diabetic Population Across the Globe; Innovative and Fashionable Footwear.
6. What are the notable trends driving market growth?
Diabetic Shoes Are the Most Popular Footwear Type.
7. Are there any restraints impacting market growth?
Enhanced Presence of Counterfeit and Poor-Quality Products.
8. Can you provide examples of recent developments in the market?
November 2023: Aetrex launched a new personalized footwear recommendation platform – FitStarter, developed with shoe fit testing company Heeluxe, to help retailers improve their shoe fitting service for shoppers, reduce returns, and increase customer satisfaction.
9. What pricing options are available for accessing the report?
Pricing options include single-user, multi-user, and enterprise licenses priced at USD 4750, USD 5250, and USD 8750 respectively.
10. Is the market size provided in terms of value or volume?
The market size is provided in terms of value, measured in Million and volume, measured in K Units.
11. Are there any specific market keywords associated with the report?
Yes, the market keyword associated with the report is "Diabetic Footwear Market," which aids in identifying and referencing the specific market segment covered.
12. How do I determine which pricing option suits my needs best?
The pricing options vary based on user requirements and access needs. Individual users may opt for single-user licenses, while businesses requiring broader access may choose multi-user or enterprise licenses for cost-effective access to the report.
13. Are there any additional resources or data provided in the Diabetic Footwear Market report?
While the report offers comprehensive insights, it's advisable to review the specific contents or supplementary materials provided to ascertain if additional resources or data are available.
14. How can I stay updated on further developments or reports in the Diabetic Footwear Market?
To stay informed about further developments, trends, and reports in the Diabetic Footwear Market, consider subscribing to industry newsletters, following relevant companies and organizations, or regularly checking reputable industry news sources and publications.
Methodology
Step 1 - Identification of Relevant Samples Size from Population Database


Step 2 - Approaches for Defining Global Market Size (Value, Volume* & Price*)

Note*: In applicable scenarios
Step 3 - Data Sources
Primary Research
- Web Analytics
- Survey Reports
- Research Institute
- Latest Research Reports
- Opinion Leaders
Secondary Research
- Annual Reports
- White Paper
- Latest Press Release
- Industry Association
- Paid Database
- Investor Presentations

Step 4 - Data Triangulation
Involves using different sources of information in order to increase the validity of a study
These sources are likely to be stakeholders in a program - participants, other researchers, program staff, other community members, and so on.
Then we put all data in single framework & apply various statistical tools to find out the dynamic on the market.
During the analysis stage, feedback from the stakeholder groups would be compared to determine areas of agreement as well as areas of divergence