

Key Insights
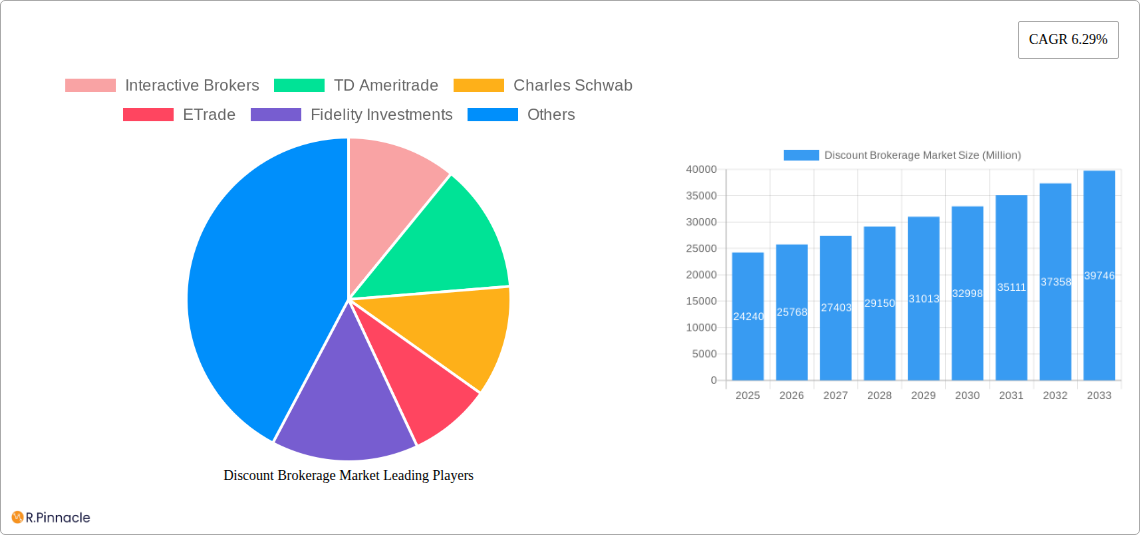
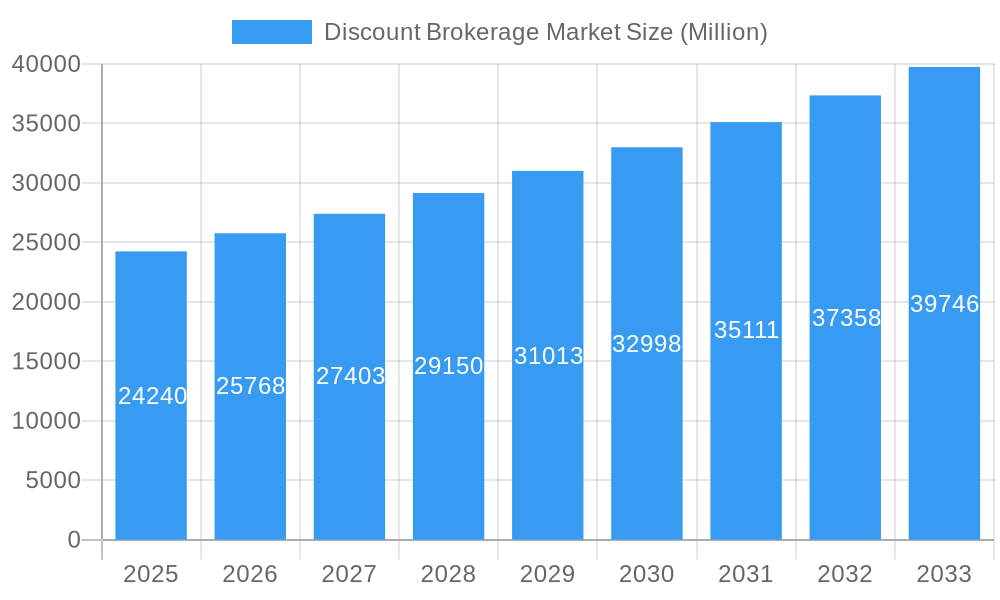
The discount brokerage market, valued at $24.24 billion in 2025, is projected to experience robust growth, driven by several key factors. Increased accessibility of online trading platforms, coupled with a rise in individual investors, particularly among millennials and Gen Z, fuels market expansion. The democratization of investing, facilitated by commission-free trading and user-friendly interfaces offered by firms like Robinhood and Fidelity, lowers the barrier to entry for new investors. Technological advancements, including sophisticated mobile applications and algorithmic trading tools, further enhance the appeal of discount brokerages. This trend is complemented by a growing preference for self-directed investing, bypassing traditional financial advisors, leading to greater market penetration. However, regulatory scrutiny and potential cybersecurity threats pose challenges, requiring robust security measures and compliance strategies from brokerage firms. The competitive landscape remains fiercely contested, with established players like Charles Schwab and Fidelity Investments competing against newer entrants like Robinhood and innovative international players such as DEGIRO. The market is segmented by service offerings (e.g., trading platforms, research tools, advisory services), investor demographics, and geographic regions, each exhibiting unique growth trajectories.
Discount Brokerage Market Market Size (In Billion)
Looking ahead to 2033, a compound annual growth rate (CAGR) of 6.29% suggests substantial market expansion. This growth will be influenced by factors including increased financial literacy, the emergence of innovative investment products like fractional shares and cryptocurrencies, and the ongoing evolution of technological capabilities. Competition is expected to intensify, with firms focusing on differentiation through enhanced customer service, personalized investing experiences, and competitive pricing strategies. Expansion into emerging markets and the adoption of artificial intelligence (AI) and machine learning (ML) for personalized financial advice will shape the market's future. Companies will need to adapt to evolving investor needs and regulatory changes to maintain market share and profitability. A strategic focus on risk management and cybersecurity will become increasingly critical to ensure customer trust and market sustainability.
Discount Brokerage Market Company Market Share
This comprehensive report provides an in-depth analysis of the Discount Brokerage Market, offering invaluable insights for industry professionals, investors, and strategic planners. Covering the period 2019-2033, with a focus on 2025, this report analyzes market dynamics, competitive landscapes, and future growth potential. The report leverages extensive data analysis to provide actionable intelligence and forecasts, allowing stakeholders to make informed decisions in this rapidly evolving market. The global market is expected to reach xx Million by 2033.
Discount Brokerage Market Market Structure & Innovation Trends
This section analyzes the structure of the discount brokerage market, examining market concentration, innovation drivers, and regulatory frameworks. We explore the influence of product substitutes, end-user demographics, and mergers and acquisitions (M&A) activities. The report includes detailed analysis of market share among key players and valuation of significant M&A deals.
Market Concentration: The market demonstrates a [high/medium/low] level of concentration, with [Number] major players holding approximately [Percentage]% of the market share in 2024. This is expected to [increase/decrease/remain stable] during the forecast period.
Innovation Drivers: Key drivers of innovation include advancements in artificial intelligence (AI) for algorithmic trading, the rise of mobile-first platforms, and increasing demand for personalized financial advice integrated with brokerage services. The development of robo-advisors and fractional share trading are also significant factors.
Regulatory Frameworks: Regulatory changes impacting KYC/AML compliance and data privacy have created both challenges and opportunities for firms. Variations in regulations across different geographies play a significant role in market development.
Product Substitutes: The emergence of neobanks and fintech platforms offering integrated financial services creates competitive pressure and acts as a substitute for traditional discount brokerage services.
M&A Activities: Significant M&A activity has reshaped the market landscape in recent years. For instance, [mention specific deal(s) with approximate deal values in Millions if available, otherwise use estimated values]. This trend is likely to [continue/slow/accelerate] in the coming years.
End-User Demographics: The market is largely driven by [describe demographic trends, e.g., millennial investors, high-net-worth individuals, etc.], and this demographic shift significantly impacts product offerings and marketing strategies.
Discount Brokerage Market Market Dynamics & Trends
This section delves into the market's growth drivers, technological disruptions, evolving consumer preferences, and the competitive dynamics influencing market growth. We provide detailed analysis on CAGR and market penetration.
[Insert 600 words of analysis covering market growth drivers, technological disruptions (AI, mobile trading, robo-advisors), changing consumer preferences (demand for personalized services, ease of use), and competitive dynamics (pricing strategies, product differentiation, marketing). Include specific data points on CAGR and market penetration where available; otherwise use estimated values.].
Dominant Regions & Segments in Discount Brokerage Market
This section identifies the leading regions and segments within the discount brokerage market. Using detailed analysis and specific examples, it clarifies the factors contributing to their dominance.
[Insert 600 words detailing the leading region and/or segment. Use bullet points for key drivers (e.g., favorable economic policies, robust technological infrastructure) and paragraphs for a thorough dominance analysis. Quantify dominance where possible using market share data or similar metrics. Consider factors like regulatory environment, technological adoption rates, and economic development. If a specific region or segment is lacking sufficient data, clearly state that].
Discount Brokerage Market Product Innovations
The discount brokerage market is experiencing a surge in product innovations, largely driven by rapid technological advancements and a keen understanding of evolving investor needs. Leading players are consistently introducing cutting-edge features designed to enhance user experience and trading efficiency. These include sophisticated AI-powered trading tools for advanced analytics, personalized investment recommendations, and intuitive mobile trading platforms with seamless navigation. Furthermore, the integration of fractional share trading and access to a wider array of asset classes, such as cryptocurrencies and ETFs, are expanding the appeal of these platforms to a broader investor base. The competitive landscape is pushing firms to differentiate through cost-effectiveness, enhanced security measures, and the development of user-friendly interfaces that cater to both novice and experienced traders, ensuring robust market fit.
Report Scope & Segmentation Analysis
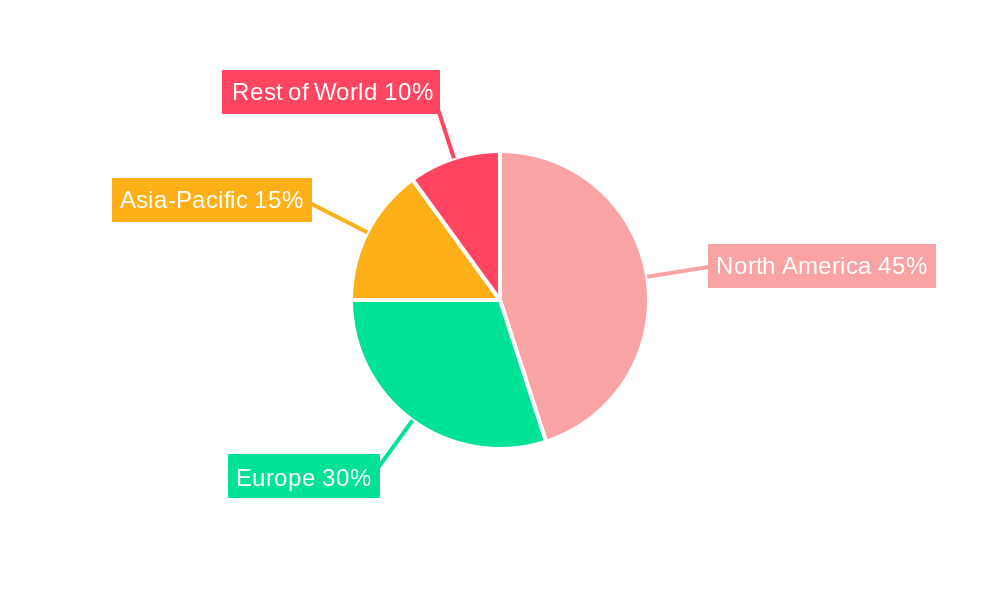
This report meticulously details the discount brokerage market's segmentation, providing comprehensive insights into each category. We analyze the market by user type, differentiating between individual investors, who constitute the largest and fastest-growing segment, and institutional investors, who leverage these platforms for cost-effective execution. Service type segmentation reveals a clear dominance of online brokerage platforms, with full-service brokerages holding a smaller, niche position. Geographically, North America and Asia Pacific are identified as the leading markets, driven by high investor adoption and technological infrastructure. Growth projections indicate a steady upward trajectory across all segments, with the Asia Pacific region expected to exhibit the highest compound annual growth rate (CAGR) due to increasing financial literacy and digital penetration. Competitive dynamics within each segment are characterized by intense price wars among online brokers and a focus on value-added services for institutional clients.
Key Drivers of Discount Brokerage Market Growth
This section outlines the factors driving market expansion.
[Insert 150 words discussing technological advancements (e.g., AI, mobile technology), favorable economic conditions (e.g., rising disposable income), and supportive regulatory frameworks as key drivers. Use specific examples wherever possible to illustrate the impact of each driver].
Challenges in the Discount Brokerage Market Sector
The discount brokerage sector, despite its growth, faces several significant hurdles that could impede its expansion. Stringent regulatory compliance remains a paramount challenge, requiring firms to invest heavily in infrastructure and personnel to adhere to evolving financial regulations across different jurisdictions. Cybersecurity threats pose a persistent and escalating risk, with the potential for data breaches and financial fraud demanding constant vigilance and sophisticated security protocols. The market is also characterized by intense competition, leading to pressure on profit margins as firms vie for market share through aggressive pricing and promotional activities. This hyper-competitive environment raises concerns about potential market saturation, particularly in mature economies, where acquiring new customers becomes increasingly expensive. Furthermore, maintaining profitability while offering increasingly low commission fees requires a strategic focus on operational efficiency and the development of alternative revenue streams.
Emerging Opportunities in Discount Brokerage Market
This section highlights potential future growth areas.
[Insert 150 words highlighting opportunities such as expansion into underserved markets (e.g., emerging economies), the adoption of innovative technologies (e.g., blockchain, decentralized finance), and the increasing demand for personalized financial advice and wealth management services. Give specific examples].
Leading Players in the Discount Brokerage Market Market
This section lists key players in the discount brokerage market.
- Interactive Brokers
- TD Ameritrade
- Charles Schwab
- ETrade
- Fidelity Investments
- Robinhood
- Vanguard
- Ally Invest
- Firstrade
- DEGIRO
- List Not Exhaustive
Key Developments in Discount Brokerage Market Industry
The discount brokerage industry is dynamic, marked by strategic partnerships and product launches aimed at expanding market reach and enhancing service offerings.
- September 2023: HDFC Securities launched its innovative discount brokerage platform, Sky. This initiative aims to provide a comprehensive suite of trading and investment solutions, significantly intensifying competition within the Indian market and potentially broadening the accessibility of financial markets to a wider demographic.
- September 2023: Ujjivan Small Finance Bank (SFB) forged a strategic partnership with SMC Global Securities. This collaboration enables Ujjivan SFB to extend online trading services to its existing customer base, reflecting a broader industry trend of financial institutions integrating brokerage services to offer a more holistic financial ecosystem and enhance customer value.
Future Outlook for Discount Brokerage Market Market
The future outlook for the discount brokerage market is exceptionally bright, fueled by a confluence of ongoing technological innovation, strategic expansion, and potential market consolidation. We anticipate a continued wave of technological advancements, with platforms increasingly leveraging AI for personalized investment advice, advanced algorithmic trading capabilities, and enhanced risk management tools. Expansion into emerging markets, particularly in developing economies with growing middle classes and increasing digital adoption, presents significant growth opportunities. Furthermore, the current competitive landscape is ripe for consolidation, with mergers and acquisitions likely to reshape the industry as larger players seek to achieve economies of scale and broader market penetration. Firms that can effectively capitalize on emerging trends, such as the increasing demand for sustainable investing options and the integration of decentralized finance (DeFi) elements, are well-positioned to maintain a competitive edge and achieve sustained growth in the years ahead.
Discount Brokerage Market Segmentation
-
1. Mode
- 1.1. Online Discount Brokerage Service
- 1.2. Offline Discount Brokerage Service
-
2. Application
- 2.1. Individual
- 2.2. Enterprise
- 2.3. Government Agencies
-
3. Services
- 3.1. Order Execution and Advisory
- 3.2. Discretionary
- 3.3. Online Trading Platforms
- 3.4. Education and Investor Resources
-
4. Commission
- 4.1. Commission-free Brokers
- 4.2. Fixed Commission Brokers
Discount Brokerage Market Segmentation By Geography
-
1. North America
- 1.1. United States
- 1.2. Canada
- 1.3. Mexico
- 1.4. Rest of North America
-
2. Europe
- 2.1. Germany
- 2.2. United Kingdom
- 2.3. France
- 2.4. Russia
- 2.5. Spain
- 2.6. Rest of Europe
-
3. Asia Pacific
- 3.1. India
- 3.2. China
- 3.3. Japan
- 3.4. Rest of Asia Pacific
-
4. South America
- 4.1. Brazil
- 4.2. Argentina
- 4.3. Rest of South America
-
5. Middle East
- 5.1. United Arab Emirates
- 5.2. Saudi Arabia
- 5.3. Rest of Middle East
Discount Brokerage Market Regional Market Share
Geographic Coverage of Discount Brokerage Market
Discount Brokerage Market REPORT HIGHLIGHTS
| Aspects | Details |
|---|---|
| Study Period | 2020-2034 |
| Base Year | 2025 |
| Estimated Year | 2026 |
| Forecast Period | 2026-2034 |
| Historical Period | 2020-2025 |
| Growth Rate | CAGR of 6.29% from 2020-2034 |
| Segmentation |
|
Table of Contents
- 1. Introduction
- 1.1. Research Scope
- 1.2. Market Segmentation
- 1.3. Research Objective
- 1.4. Definitions and Assumptions
- 2. Executive Summary
- 2.1. Market Snapshot
- 3. Market Dynamics
- 3.1. Market Drivers
- 3.2. Market Restrains
- 3.3. Market Trends
- 3.4. Market Opportunities
- 4. Market Factor Analysis
- 4.1. Porters Five Forces
- 4.1.1. Bargaining Power of Suppliers
- 4.1.2. Bargaining Power of Buyers
- 4.1.3. Threat of New Entrants
- 4.1.4. Threat of Substitutes
- 4.1.5. Competitive Rivalry
- 4.2. PESTEL analysis
- 4.3. BCG Analysis
- 4.3.1. Stars (High Growth, High Market Share)
- 4.3.2. Cash Cows (Low Growth, High Market Share)
- 4.3.3. Question Mark (High Growth, Low Market Share)
- 4.3.4. Dogs (Low Growth, Low Market Share)
- 4.4. Ansoff Matrix Analysis
- 4.5. Supply Chain Analysis
- 4.6. Regulatory Landscape
- 4.7. Current Market Potential and Opportunity Assessment (TAM–SAM–SOM Framework)
- 4.8. PRI Analyst Note
- 4.1. Porters Five Forces
- 5. Market Analysis, Insights and Forecast 2021-2033
- 5.1. Market Analysis, Insights and Forecast - by Mode
- 5.1.1. Online Discount Brokerage Service
- 5.1.2. Offline Discount Brokerage Service
- 5.2. Market Analysis, Insights and Forecast - by Application
- 5.2.1. Individual
- 5.2.2. Enterprise
- 5.2.3. Government Agencies
- 5.3. Market Analysis, Insights and Forecast - by Services
- 5.3.1. Order Execution and Advisory
- 5.3.2. Discretionary
- 5.3.3. Online Trading Platforms
- 5.3.4. Education and Investor Resources
- 5.4. Market Analysis, Insights and Forecast - by Commission
- 5.4.1. Commission-free Brokers
- 5.4.2. Fixed Commission Brokers
- 5.5. Market Analysis, Insights and Forecast - by Region
- 5.5.1. North America
- 5.5.2. Europe
- 5.5.3. Asia Pacific
- 5.5.4. South America
- 5.5.5. Middle East
- 5.1. Market Analysis, Insights and Forecast - by Mode
- 6. Global Discount Brokerage Market Analysis, Insights and Forecast, 2021-2033
- 6.1. Market Analysis, Insights and Forecast - by Mode
- 6.1.1. Online Discount Brokerage Service
- 6.1.2. Offline Discount Brokerage Service
- 6.2. Market Analysis, Insights and Forecast - by Application
- 6.2.1. Individual
- 6.2.2. Enterprise
- 6.2.3. Government Agencies
- 6.3. Market Analysis, Insights and Forecast - by Services
- 6.3.1. Order Execution and Advisory
- 6.3.2. Discretionary
- 6.3.3. Online Trading Platforms
- 6.3.4. Education and Investor Resources
- 6.4. Market Analysis, Insights and Forecast - by Commission
- 6.4.1. Commission-free Brokers
- 6.4.2. Fixed Commission Brokers
- 6.1. Market Analysis, Insights and Forecast - by Mode
- 7. North America Discount Brokerage Market Analysis, Insights and Forecast, 2020-2032
- 7.1. Market Analysis, Insights and Forecast - by Mode
- 7.1.1. Online Discount Brokerage Service
- 7.1.2. Offline Discount Brokerage Service
- 7.2. Market Analysis, Insights and Forecast - by Application
- 7.2.1. Individual
- 7.2.2. Enterprise
- 7.2.3. Government Agencies
- 7.3. Market Analysis, Insights and Forecast - by Services
- 7.3.1. Order Execution and Advisory
- 7.3.2. Discretionary
- 7.3.3. Online Trading Platforms
- 7.3.4. Education and Investor Resources
- 7.4. Market Analysis, Insights and Forecast - by Commission
- 7.4.1. Commission-free Brokers
- 7.4.2. Fixed Commission Brokers
- 7.1. Market Analysis, Insights and Forecast - by Mode
- 8. Europe Discount Brokerage Market Analysis, Insights and Forecast, 2020-2032
- 8.1. Market Analysis, Insights and Forecast - by Mode
- 8.1.1. Online Discount Brokerage Service
- 8.1.2. Offline Discount Brokerage Service
- 8.2. Market Analysis, Insights and Forecast - by Application
- 8.2.1. Individual
- 8.2.2. Enterprise
- 8.2.3. Government Agencies
- 8.3. Market Analysis, Insights and Forecast - by Services
- 8.3.1. Order Execution and Advisory
- 8.3.2. Discretionary
- 8.3.3. Online Trading Platforms
- 8.3.4. Education and Investor Resources
- 8.4. Market Analysis, Insights and Forecast - by Commission
- 8.4.1. Commission-free Brokers
- 8.4.2. Fixed Commission Brokers
- 8.1. Market Analysis, Insights and Forecast - by Mode
- 9. Asia Pacific Discount Brokerage Market Analysis, Insights and Forecast, 2020-2032
- 9.1. Market Analysis, Insights and Forecast - by Mode
- 9.1.1. Online Discount Brokerage Service
- 9.1.2. Offline Discount Brokerage Service
- 9.2. Market Analysis, Insights and Forecast - by Application
- 9.2.1. Individual
- 9.2.2. Enterprise
- 9.2.3. Government Agencies
- 9.3. Market Analysis, Insights and Forecast - by Services
- 9.3.1. Order Execution and Advisory
- 9.3.2. Discretionary
- 9.3.3. Online Trading Platforms
- 9.3.4. Education and Investor Resources
- 9.4. Market Analysis, Insights and Forecast - by Commission
- 9.4.1. Commission-free Brokers
- 9.4.2. Fixed Commission Brokers
- 9.1. Market Analysis, Insights and Forecast - by Mode
- 10. South America Discount Brokerage Market Analysis, Insights and Forecast, 2020-2032
- 10.1. Market Analysis, Insights and Forecast - by Mode
- 10.1.1. Online Discount Brokerage Service
- 10.1.2. Offline Discount Brokerage Service
- 10.2. Market Analysis, Insights and Forecast - by Application
- 10.2.1. Individual
- 10.2.2. Enterprise
- 10.2.3. Government Agencies
- 10.3. Market Analysis, Insights and Forecast - by Services
- 10.3.1. Order Execution and Advisory
- 10.3.2. Discretionary
- 10.3.3. Online Trading Platforms
- 10.3.4. Education and Investor Resources
- 10.4. Market Analysis, Insights and Forecast - by Commission
- 10.4.1. Commission-free Brokers
- 10.4.2. Fixed Commission Brokers
- 10.1. Market Analysis, Insights and Forecast - by Mode
- 11. Middle East Discount Brokerage Market Analysis, Insights and Forecast, 2020-2032
- 11.1. Market Analysis, Insights and Forecast - by Mode
- 11.1.1. Online Discount Brokerage Service
- 11.1.2. Offline Discount Brokerage Service
- 11.2. Market Analysis, Insights and Forecast - by Application
- 11.2.1. Individual
- 11.2.2. Enterprise
- 11.2.3. Government Agencies
- 11.3. Market Analysis, Insights and Forecast - by Services
- 11.3.1. Order Execution and Advisory
- 11.3.2. Discretionary
- 11.3.3. Online Trading Platforms
- 11.3.4. Education and Investor Resources
- 11.4. Market Analysis, Insights and Forecast - by Commission
- 11.4.1. Commission-free Brokers
- 11.4.2. Fixed Commission Brokers
- 11.1. Market Analysis, Insights and Forecast - by Mode
- 12. Competitive Analysis
- 12.1. Company Profiles
- 12.1.1 Interactive Brokers
- 12.1.1.1. Company Overview
- 12.1.1.2. Products
- 12.1.1.3. Company Financials
- 12.1.1.4. SWOT Analysis
- 12.1.2 TD Ameritrade
- 12.1.2.1. Company Overview
- 12.1.2.2. Products
- 12.1.2.3. Company Financials
- 12.1.2.4. SWOT Analysis
- 12.1.3 Charles Schwab
- 12.1.3.1. Company Overview
- 12.1.3.2. Products
- 12.1.3.3. Company Financials
- 12.1.3.4. SWOT Analysis
- 12.1.4 ETrade
- 12.1.4.1. Company Overview
- 12.1.4.2. Products
- 12.1.4.3. Company Financials
- 12.1.4.4. SWOT Analysis
- 12.1.5 Fidelity Investments
- 12.1.5.1. Company Overview
- 12.1.5.2. Products
- 12.1.5.3. Company Financials
- 12.1.5.4. SWOT Analysis
- 12.1.6 Robinhood
- 12.1.6.1. Company Overview
- 12.1.6.2. Products
- 12.1.6.3. Company Financials
- 12.1.6.4. SWOT Analysis
- 12.1.7 Vanguard
- 12.1.7.1. Company Overview
- 12.1.7.2. Products
- 12.1.7.3. Company Financials
- 12.1.7.4. SWOT Analysis
- 12.1.8 Ally Invest
- 12.1.8.1. Company Overview
- 12.1.8.2. Products
- 12.1.8.3. Company Financials
- 12.1.8.4. SWOT Analysis
- 12.1.9 Firstrade
- 12.1.9.1. Company Overview
- 12.1.9.2. Products
- 12.1.9.3. Company Financials
- 12.1.9.4. SWOT Analysis
- 12.1.10 DEGIRO**List Not Exhaustive
- 12.1.10.1. Company Overview
- 12.1.10.2. Products
- 12.1.10.3. Company Financials
- 12.1.10.4. SWOT Analysis
- 12.1.1 Interactive Brokers
- 12.2. Market Entropy
- 12.2.1 Company's Key Areas Served
- 12.2.2 Recent Developments
- 12.3. Company Market Share Analysis 2025
- 12.3.1 Top 5 Companies Market Share Analysis
- 12.3.2 Top 3 Companies Market Share Analysis
- 12.4. List of Potential Customers
- 13. Research Methodology
List of Figures
- Figure 1: Global Discount Brokerage Market Revenue Breakdown (Million, %) by Region 2025 & 2033
- Figure 2: Global Discount Brokerage Market Volume Breakdown (Billion, %) by Region 2025 & 2033
- Figure 3: North America Discount Brokerage Market Revenue (Million), by Mode 2025 & 2033
- Figure 4: North America Discount Brokerage Market Volume (Billion), by Mode 2025 & 2033
- Figure 5: North America Discount Brokerage Market Revenue Share (%), by Mode 2025 & 2033
- Figure 6: North America Discount Brokerage Market Volume Share (%), by Mode 2025 & 2033
- Figure 7: North America Discount Brokerage Market Revenue (Million), by Application 2025 & 2033
- Figure 8: North America Discount Brokerage Market Volume (Billion), by Application 2025 & 2033
- Figure 9: North America Discount Brokerage Market Revenue Share (%), by Application 2025 & 2033
- Figure 10: North America Discount Brokerage Market Volume Share (%), by Application 2025 & 2033
- Figure 11: North America Discount Brokerage Market Revenue (Million), by Services 2025 & 2033
- Figure 12: North America Discount Brokerage Market Volume (Billion), by Services 2025 & 2033
- Figure 13: North America Discount Brokerage Market Revenue Share (%), by Services 2025 & 2033
- Figure 14: North America Discount Brokerage Market Volume Share (%), by Services 2025 & 2033
- Figure 15: North America Discount Brokerage Market Revenue (Million), by Commission 2025 & 2033
- Figure 16: North America Discount Brokerage Market Volume (Billion), by Commission 2025 & 2033
- Figure 17: North America Discount Brokerage Market Revenue Share (%), by Commission 2025 & 2033
- Figure 18: North America Discount Brokerage Market Volume Share (%), by Commission 2025 & 2033
- Figure 19: North America Discount Brokerage Market Revenue (Million), by Country 2025 & 2033
- Figure 20: North America Discount Brokerage Market Volume (Billion), by Country 2025 & 2033
- Figure 21: North America Discount Brokerage Market Revenue Share (%), by Country 2025 & 2033
- Figure 22: North America Discount Brokerage Market Volume Share (%), by Country 2025 & 2033
- Figure 23: Europe Discount Brokerage Market Revenue (Million), by Mode 2025 & 2033
- Figure 24: Europe Discount Brokerage Market Volume (Billion), by Mode 2025 & 2033
- Figure 25: Europe Discount Brokerage Market Revenue Share (%), by Mode 2025 & 2033
- Figure 26: Europe Discount Brokerage Market Volume Share (%), by Mode 2025 & 2033
- Figure 27: Europe Discount Brokerage Market Revenue (Million), by Application 2025 & 2033
- Figure 28: Europe Discount Brokerage Market Volume (Billion), by Application 2025 & 2033
- Figure 29: Europe Discount Brokerage Market Revenue Share (%), by Application 2025 & 2033
- Figure 30: Europe Discount Brokerage Market Volume Share (%), by Application 2025 & 2033
- Figure 31: Europe Discount Brokerage Market Revenue (Million), by Services 2025 & 2033
- Figure 32: Europe Discount Brokerage Market Volume (Billion), by Services 2025 & 2033
- Figure 33: Europe Discount Brokerage Market Revenue Share (%), by Services 2025 & 2033
- Figure 34: Europe Discount Brokerage Market Volume Share (%), by Services 2025 & 2033
- Figure 35: Europe Discount Brokerage Market Revenue (Million), by Commission 2025 & 2033
- Figure 36: Europe Discount Brokerage Market Volume (Billion), by Commission 2025 & 2033
- Figure 37: Europe Discount Brokerage Market Revenue Share (%), by Commission 2025 & 2033
- Figure 38: Europe Discount Brokerage Market Volume Share (%), by Commission 2025 & 2033
- Figure 39: Europe Discount Brokerage Market Revenue (Million), by Country 2025 & 2033
- Figure 40: Europe Discount Brokerage Market Volume (Billion), by Country 2025 & 2033
- Figure 41: Europe Discount Brokerage Market Revenue Share (%), by Country 2025 & 2033
- Figure 42: Europe Discount Brokerage Market Volume Share (%), by Country 2025 & 2033
- Figure 43: Asia Pacific Discount Brokerage Market Revenue (Million), by Mode 2025 & 2033
- Figure 44: Asia Pacific Discount Brokerage Market Volume (Billion), by Mode 2025 & 2033
- Figure 45: Asia Pacific Discount Brokerage Market Revenue Share (%), by Mode 2025 & 2033
- Figure 46: Asia Pacific Discount Brokerage Market Volume Share (%), by Mode 2025 & 2033
- Figure 47: Asia Pacific Discount Brokerage Market Revenue (Million), by Application 2025 & 2033
- Figure 48: Asia Pacific Discount Brokerage Market Volume (Billion), by Application 2025 & 2033
- Figure 49: Asia Pacific Discount Brokerage Market Revenue Share (%), by Application 2025 & 2033
- Figure 50: Asia Pacific Discount Brokerage Market Volume Share (%), by Application 2025 & 2033
- Figure 51: Asia Pacific Discount Brokerage Market Revenue (Million), by Services 2025 & 2033
- Figure 52: Asia Pacific Discount Brokerage Market Volume (Billion), by Services 2025 & 2033
- Figure 53: Asia Pacific Discount Brokerage Market Revenue Share (%), by Services 2025 & 2033
- Figure 54: Asia Pacific Discount Brokerage Market Volume Share (%), by Services 2025 & 2033
- Figure 55: Asia Pacific Discount Brokerage Market Revenue (Million), by Commission 2025 & 2033
- Figure 56: Asia Pacific Discount Brokerage Market Volume (Billion), by Commission 2025 & 2033
- Figure 57: Asia Pacific Discount Brokerage Market Revenue Share (%), by Commission 2025 & 2033
- Figure 58: Asia Pacific Discount Brokerage Market Volume Share (%), by Commission 2025 & 2033
- Figure 59: Asia Pacific Discount Brokerage Market Revenue (Million), by Country 2025 & 2033
- Figure 60: Asia Pacific Discount Brokerage Market Volume (Billion), by Country 2025 & 2033
- Figure 61: Asia Pacific Discount Brokerage Market Revenue Share (%), by Country 2025 & 2033
- Figure 62: Asia Pacific Discount Brokerage Market Volume Share (%), by Country 2025 & 2033
- Figure 63: South America Discount Brokerage Market Revenue (Million), by Mode 2025 & 2033
- Figure 64: South America Discount Brokerage Market Volume (Billion), by Mode 2025 & 2033
- Figure 65: South America Discount Brokerage Market Revenue Share (%), by Mode 2025 & 2033
- Figure 66: South America Discount Brokerage Market Volume Share (%), by Mode 2025 & 2033
- Figure 67: South America Discount Brokerage Market Revenue (Million), by Application 2025 & 2033
- Figure 68: South America Discount Brokerage Market Volume (Billion), by Application 2025 & 2033
- Figure 69: South America Discount Brokerage Market Revenue Share (%), by Application 2025 & 2033
- Figure 70: South America Discount Brokerage Market Volume Share (%), by Application 2025 & 2033
- Figure 71: South America Discount Brokerage Market Revenue (Million), by Services 2025 & 2033
- Figure 72: South America Discount Brokerage Market Volume (Billion), by Services 2025 & 2033
- Figure 73: South America Discount Brokerage Market Revenue Share (%), by Services 2025 & 2033
- Figure 74: South America Discount Brokerage Market Volume Share (%), by Services 2025 & 2033
- Figure 75: South America Discount Brokerage Market Revenue (Million), by Commission 2025 & 2033
- Figure 76: South America Discount Brokerage Market Volume (Billion), by Commission 2025 & 2033
- Figure 77: South America Discount Brokerage Market Revenue Share (%), by Commission 2025 & 2033
- Figure 78: South America Discount Brokerage Market Volume Share (%), by Commission 2025 & 2033
- Figure 79: South America Discount Brokerage Market Revenue (Million), by Country 2025 & 2033
- Figure 80: South America Discount Brokerage Market Volume (Billion), by Country 2025 & 2033
- Figure 81: South America Discount Brokerage Market Revenue Share (%), by Country 2025 & 2033
- Figure 82: South America Discount Brokerage Market Volume Share (%), by Country 2025 & 2033
- Figure 83: Middle East Discount Brokerage Market Revenue (Million), by Mode 2025 & 2033
- Figure 84: Middle East Discount Brokerage Market Volume (Billion), by Mode 2025 & 2033
- Figure 85: Middle East Discount Brokerage Market Revenue Share (%), by Mode 2025 & 2033
- Figure 86: Middle East Discount Brokerage Market Volume Share (%), by Mode 2025 & 2033
- Figure 87: Middle East Discount Brokerage Market Revenue (Million), by Application 2025 & 2033
- Figure 88: Middle East Discount Brokerage Market Volume (Billion), by Application 2025 & 2033
- Figure 89: Middle East Discount Brokerage Market Revenue Share (%), by Application 2025 & 2033
- Figure 90: Middle East Discount Brokerage Market Volume Share (%), by Application 2025 & 2033
- Figure 91: Middle East Discount Brokerage Market Revenue (Million), by Services 2025 & 2033
- Figure 92: Middle East Discount Brokerage Market Volume (Billion), by Services 2025 & 2033
- Figure 93: Middle East Discount Brokerage Market Revenue Share (%), by Services 2025 & 2033
- Figure 94: Middle East Discount Brokerage Market Volume Share (%), by Services 2025 & 2033
- Figure 95: Middle East Discount Brokerage Market Revenue (Million), by Commission 2025 & 2033
- Figure 96: Middle East Discount Brokerage Market Volume (Billion), by Commission 2025 & 2033
- Figure 97: Middle East Discount Brokerage Market Revenue Share (%), by Commission 2025 & 2033
- Figure 98: Middle East Discount Brokerage Market Volume Share (%), by Commission 2025 & 2033
- Figure 99: Middle East Discount Brokerage Market Revenue (Million), by Country 2025 & 2033
- Figure 100: Middle East Discount Brokerage Market Volume (Billion), by Country 2025 & 2033
- Figure 101: Middle East Discount Brokerage Market Revenue Share (%), by Country 2025 & 2033
- Figure 102: Middle East Discount Brokerage Market Volume Share (%), by Country 2025 & 2033
List of Tables
- Table 1: Global Discount Brokerage Market Revenue Million Forecast, by Mode 2020 & 2033
- Table 2: Global Discount Brokerage Market Volume Billion Forecast, by Mode 2020 & 2033
- Table 3: Global Discount Brokerage Market Revenue Million Forecast, by Application 2020 & 2033
- Table 4: Global Discount Brokerage Market Volume Billion Forecast, by Application 2020 & 2033
- Table 5: Global Discount Brokerage Market Revenue Million Forecast, by Services 2020 & 2033
- Table 6: Global Discount Brokerage Market Volume Billion Forecast, by Services 2020 & 2033
- Table 7: Global Discount Brokerage Market Revenue Million Forecast, by Commission 2020 & 2033
- Table 8: Global Discount Brokerage Market Volume Billion Forecast, by Commission 2020 & 2033
- Table 9: Global Discount Brokerage Market Revenue Million Forecast, by Region 2020 & 2033
- Table 10: Global Discount Brokerage Market Volume Billion Forecast, by Region 2020 & 2033
- Table 11: Global Discount Brokerage Market Revenue Million Forecast, by Mode 2020 & 2033
- Table 12: Global Discount Brokerage Market Volume Billion Forecast, by Mode 2020 & 2033
- Table 13: Global Discount Brokerage Market Revenue Million Forecast, by Application 2020 & 2033
- Table 14: Global Discount Brokerage Market Volume Billion Forecast, by Application 2020 & 2033
- Table 15: Global Discount Brokerage Market Revenue Million Forecast, by Services 2020 & 2033
- Table 16: Global Discount Brokerage Market Volume Billion Forecast, by Services 2020 & 2033
- Table 17: Global Discount Brokerage Market Revenue Million Forecast, by Commission 2020 & 2033
- Table 18: Global Discount Brokerage Market Volume Billion Forecast, by Commission 2020 & 2033
- Table 19: Global Discount Brokerage Market Revenue Million Forecast, by Country 2020 & 2033
- Table 20: Global Discount Brokerage Market Volume Billion Forecast, by Country 2020 & 2033
- Table 21: United States Discount Brokerage Market Revenue (Million) Forecast, by Application 2020 & 2033
- Table 22: United States Discount Brokerage Market Volume (Billion) Forecast, by Application 2020 & 2033
- Table 23: Canada Discount Brokerage Market Revenue (Million) Forecast, by Application 2020 & 2033
- Table 24: Canada Discount Brokerage Market Volume (Billion) Forecast, by Application 2020 & 2033
- Table 25: Mexico Discount Brokerage Market Revenue (Million) Forecast, by Application 2020 & 2033
- Table 26: Mexico Discount Brokerage Market Volume (Billion) Forecast, by Application 2020 & 2033
- Table 27: Rest of North America Discount Brokerage Market Revenue (Million) Forecast, by Application 2020 & 2033
- Table 28: Rest of North America Discount Brokerage Market Volume (Billion) Forecast, by Application 2020 & 2033
- Table 29: Global Discount Brokerage Market Revenue Million Forecast, by Mode 2020 & 2033
- Table 30: Global Discount Brokerage Market Volume Billion Forecast, by Mode 2020 & 2033
- Table 31: Global Discount Brokerage Market Revenue Million Forecast, by Application 2020 & 2033
- Table 32: Global Discount Brokerage Market Volume Billion Forecast, by Application 2020 & 2033
- Table 33: Global Discount Brokerage Market Revenue Million Forecast, by Services 2020 & 2033
- Table 34: Global Discount Brokerage Market Volume Billion Forecast, by Services 2020 & 2033
- Table 35: Global Discount Brokerage Market Revenue Million Forecast, by Commission 2020 & 2033
- Table 36: Global Discount Brokerage Market Volume Billion Forecast, by Commission 2020 & 2033
- Table 37: Global Discount Brokerage Market Revenue Million Forecast, by Country 2020 & 2033
- Table 38: Global Discount Brokerage Market Volume Billion Forecast, by Country 2020 & 2033
- Table 39: Germany Discount Brokerage Market Revenue (Million) Forecast, by Application 2020 & 2033
- Table 40: Germany Discount Brokerage Market Volume (Billion) Forecast, by Application 2020 & 2033
- Table 41: United Kingdom Discount Brokerage Market Revenue (Million) Forecast, by Application 2020 & 2033
- Table 42: United Kingdom Discount Brokerage Market Volume (Billion) Forecast, by Application 2020 & 2033
- Table 43: France Discount Brokerage Market Revenue (Million) Forecast, by Application 2020 & 2033
- Table 44: France Discount Brokerage Market Volume (Billion) Forecast, by Application 2020 & 2033
- Table 45: Russia Discount Brokerage Market Revenue (Million) Forecast, by Application 2020 & 2033
- Table 46: Russia Discount Brokerage Market Volume (Billion) Forecast, by Application 2020 & 2033
- Table 47: Spain Discount Brokerage Market Revenue (Million) Forecast, by Application 2020 & 2033
- Table 48: Spain Discount Brokerage Market Volume (Billion) Forecast, by Application 2020 & 2033
- Table 49: Rest of Europe Discount Brokerage Market Revenue (Million) Forecast, by Application 2020 & 2033
- Table 50: Rest of Europe Discount Brokerage Market Volume (Billion) Forecast, by Application 2020 & 2033
- Table 51: Global Discount Brokerage Market Revenue Million Forecast, by Mode 2020 & 2033
- Table 52: Global Discount Brokerage Market Volume Billion Forecast, by Mode 2020 & 2033
- Table 53: Global Discount Brokerage Market Revenue Million Forecast, by Application 2020 & 2033
- Table 54: Global Discount Brokerage Market Volume Billion Forecast, by Application 2020 & 2033
- Table 55: Global Discount Brokerage Market Revenue Million Forecast, by Services 2020 & 2033
- Table 56: Global Discount Brokerage Market Volume Billion Forecast, by Services 2020 & 2033
- Table 57: Global Discount Brokerage Market Revenue Million Forecast, by Commission 2020 & 2033
- Table 58: Global Discount Brokerage Market Volume Billion Forecast, by Commission 2020 & 2033
- Table 59: Global Discount Brokerage Market Revenue Million Forecast, by Country 2020 & 2033
- Table 60: Global Discount Brokerage Market Volume Billion Forecast, by Country 2020 & 2033
- Table 61: India Discount Brokerage Market Revenue (Million) Forecast, by Application 2020 & 2033
- Table 62: India Discount Brokerage Market Volume (Billion) Forecast, by Application 2020 & 2033
- Table 63: China Discount Brokerage Market Revenue (Million) Forecast, by Application 2020 & 2033
- Table 64: China Discount Brokerage Market Volume (Billion) Forecast, by Application 2020 & 2033
- Table 65: Japan Discount Brokerage Market Revenue (Million) Forecast, by Application 2020 & 2033
- Table 66: Japan Discount Brokerage Market Volume (Billion) Forecast, by Application 2020 & 2033
- Table 67: Rest of Asia Pacific Discount Brokerage Market Revenue (Million) Forecast, by Application 2020 & 2033
- Table 68: Rest of Asia Pacific Discount Brokerage Market Volume (Billion) Forecast, by Application 2020 & 2033
- Table 69: Global Discount Brokerage Market Revenue Million Forecast, by Mode 2020 & 2033
- Table 70: Global Discount Brokerage Market Volume Billion Forecast, by Mode 2020 & 2033
- Table 71: Global Discount Brokerage Market Revenue Million Forecast, by Application 2020 & 2033
- Table 72: Global Discount Brokerage Market Volume Billion Forecast, by Application 2020 & 2033
- Table 73: Global Discount Brokerage Market Revenue Million Forecast, by Services 2020 & 2033
- Table 74: Global Discount Brokerage Market Volume Billion Forecast, by Services 2020 & 2033
- Table 75: Global Discount Brokerage Market Revenue Million Forecast, by Commission 2020 & 2033
- Table 76: Global Discount Brokerage Market Volume Billion Forecast, by Commission 2020 & 2033
- Table 77: Global Discount Brokerage Market Revenue Million Forecast, by Country 2020 & 2033
- Table 78: Global Discount Brokerage Market Volume Billion Forecast, by Country 2020 & 2033
- Table 79: Brazil Discount Brokerage Market Revenue (Million) Forecast, by Application 2020 & 2033
- Table 80: Brazil Discount Brokerage Market Volume (Billion) Forecast, by Application 2020 & 2033
- Table 81: Argentina Discount Brokerage Market Revenue (Million) Forecast, by Application 2020 & 2033
- Table 82: Argentina Discount Brokerage Market Volume (Billion) Forecast, by Application 2020 & 2033
- Table 83: Rest of South America Discount Brokerage Market Revenue (Million) Forecast, by Application 2020 & 2033
- Table 84: Rest of South America Discount Brokerage Market Volume (Billion) Forecast, by Application 2020 & 2033
- Table 85: Global Discount Brokerage Market Revenue Million Forecast, by Mode 2020 & 2033
- Table 86: Global Discount Brokerage Market Volume Billion Forecast, by Mode 2020 & 2033
- Table 87: Global Discount Brokerage Market Revenue Million Forecast, by Application 2020 & 2033
- Table 88: Global Discount Brokerage Market Volume Billion Forecast, by Application 2020 & 2033
- Table 89: Global Discount Brokerage Market Revenue Million Forecast, by Services 2020 & 2033
- Table 90: Global Discount Brokerage Market Volume Billion Forecast, by Services 2020 & 2033
- Table 91: Global Discount Brokerage Market Revenue Million Forecast, by Commission 2020 & 2033
- Table 92: Global Discount Brokerage Market Volume Billion Forecast, by Commission 2020 & 2033
- Table 93: Global Discount Brokerage Market Revenue Million Forecast, by Country 2020 & 2033
- Table 94: Global Discount Brokerage Market Volume Billion Forecast, by Country 2020 & 2033
- Table 95: United Arab Emirates Discount Brokerage Market Revenue (Million) Forecast, by Application 2020 & 2033
- Table 96: United Arab Emirates Discount Brokerage Market Volume (Billion) Forecast, by Application 2020 & 2033
- Table 97: Saudi Arabia Discount Brokerage Market Revenue (Million) Forecast, by Application 2020 & 2033
- Table 98: Saudi Arabia Discount Brokerage Market Volume (Billion) Forecast, by Application 2020 & 2033
- Table 99: Rest of Middle East Discount Brokerage Market Revenue (Million) Forecast, by Application 2020 & 2033
- Table 100: Rest of Middle East Discount Brokerage Market Volume (Billion) Forecast, by Application 2020 & 2033
Frequently Asked Questions
1. What is the projected Compound Annual Growth Rate (CAGR) of the Discount Brokerage Market?
The projected CAGR is approximately 6.29%.
2. Which companies are prominent players in the Discount Brokerage Market?
Key companies in the market include Interactive Brokers, TD Ameritrade, Charles Schwab, ETrade, Fidelity Investments, Robinhood, Vanguard, Ally Invest, Firstrade, DEGIRO**List Not Exhaustive.
3. What are the main segments of the Discount Brokerage Market?
The market segments include Mode, Application, Services , Commission.
4. Can you provide details about the market size?
The market size is estimated to be USD 24.24 Million as of 2022.
5. What are some drivers contributing to market growth?
Low-cost Trading Fee is Driving the Market; Increasing Popularity of Self-directed Investing.
6. What are the notable trends driving market growth?
Increase in Enterprise Market is Fuelling the Market.
7. Are there any restraints impacting market growth?
Low-cost Trading Fee is Driving the Market; Increasing Popularity of Self-directed Investing.
8. Can you provide examples of recent developments in the market?
September 2023: HDFC Securities launched the discount brokerage platform Sky. Through a single fintech platform, the app provides users with a wide range of trading and investment possibilities, including global equities, IPOs, Indian stocks, ETFs, mutual funds, futures and options, currencies, and commodities.
9. What pricing options are available for accessing the report?
Pricing options include single-user, multi-user, and enterprise licenses priced at USD 4750, USD 5250, and USD 8750 respectively.
10. Is the market size provided in terms of value or volume?
The market size is provided in terms of value, measured in Million and volume, measured in Billion.
11. Are there any specific market keywords associated with the report?
Yes, the market keyword associated with the report is "Discount Brokerage Market," which aids in identifying and referencing the specific market segment covered.
12. How do I determine which pricing option suits my needs best?
The pricing options vary based on user requirements and access needs. Individual users may opt for single-user licenses, while businesses requiring broader access may choose multi-user or enterprise licenses for cost-effective access to the report.
13. Are there any additional resources or data provided in the Discount Brokerage Market report?
While the report offers comprehensive insights, it's advisable to review the specific contents or supplementary materials provided to ascertain if additional resources or data are available.
14. How can I stay updated on further developments or reports in the Discount Brokerage Market?
To stay informed about further developments, trends, and reports in the Discount Brokerage Market, consider subscribing to industry newsletters, following relevant companies and organizations, or regularly checking reputable industry news sources and publications.
Methodology
Step 1 - Identification of Relevant Samples Size from Population Database


Step 2 - Approaches for Defining Global Market Size (Value, Volume* & Price*)

Note*: In applicable scenarios
Step 3 - Data Sources
Primary Research
- Web Analytics
- Survey Reports
- Research Institute
- Latest Research Reports
- Opinion Leaders
Secondary Research
- Annual Reports
- White Paper
- Latest Press Release
- Industry Association
- Paid Database
- Investor Presentations

Step 4 - Data Triangulation
Involves using different sources of information in order to increase the validity of a study
These sources are likely to be stakeholders in a program - participants, other researchers, program staff, other community members, and so on.
Then we put all data in single framework & apply various statistical tools to find out the dynamic on the market.
During the analysis stage, feedback from the stakeholder groups would be compared to determine areas of agreement as well as areas of divergence