

Key Insights
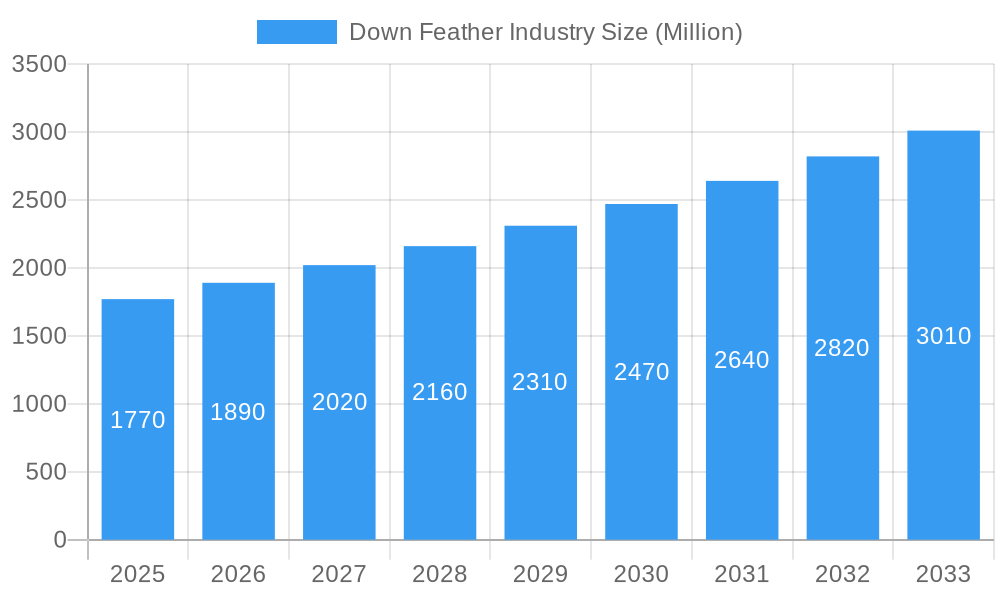
The global down feather market, valued at $1.77 billion in 2025, is projected to experience robust growth, exhibiting a Compound Annual Growth Rate (CAGR) of 6.77% from 2025 to 2033. This expansion is fueled by several key factors. Rising disposable incomes, particularly in developing economies, are driving increased demand for premium bedding and home textiles, including down-filled products known for their superior comfort and warmth. The growing awareness of the importance of sleep quality further boosts demand, as down feathers are recognized for their hypoallergenic and thermally regulating properties. Furthermore, the increasing popularity of eco-conscious and sustainable products is driving demand for ethically sourced and responsibly produced down, leading to innovation in traceability and certification schemes within the industry. However, the market faces challenges such as fluctuating raw material prices dependent on seasonal factors and the ethical concerns surrounding down sourcing, demanding greater transparency and rigorous standards throughout the supply chain. Segment-wise, the pillow application currently dominates, driven by its widespread use, while the comforter segment is poised for substantial growth due to increasing consumer preference for high-quality bedding. Geographically, North America and Europe currently hold significant market shares, owing to established consumer preference for premium bedding. However, the Asia-Pacific region is expected to demonstrate the fastest growth, driven by increasing urbanization and rising middle-class incomes, creating significant opportunities for market expansion in this region.
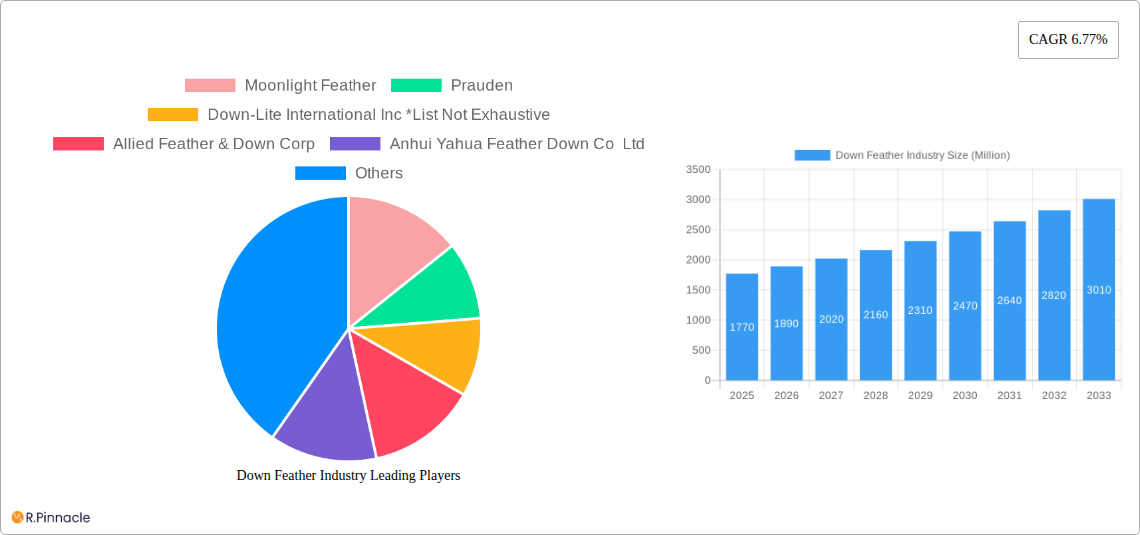
Down Feather Industry Market Size (In Billion)
The competitive landscape is marked by a mix of established global players and regional manufacturers. Key players are focusing on product innovation, incorporating sustainable sourcing practices, and expanding their distribution networks to cater to the growing global demand. Strategies such as brand building, strategic partnerships, and mergers & acquisitions are commonly employed to enhance market share and competitiveness. The market's future growth trajectory will depend on maintaining sustainable sourcing practices, addressing consumer concerns regarding ethical production, and continuing to innovate in product development and marketing to meet evolving consumer preferences. This includes potentially increased investments in technologies that improve down processing efficiency and minimize waste, further enhancing sustainability and economic viability.
Down Feather Industry Company Market Share
Down Feather Industry Market Report: 2019-2033
This comprehensive report provides an in-depth analysis of the global down feather industry, offering valuable insights for industry professionals, investors, and strategic decision-makers. With a study period spanning 2019-2033, a base year of 2025, and a forecast period of 2025-2033, this report leverages historical data (2019-2024) to project future market trends and opportunities. The report covers a market valued at Millions of dollars and examines key players, including Moonlight Feather, Prauden, Down-Lite International Inc, Allied Feather & Down Corp, Anhui Yahua Feather Down Co Ltd, ROHDEX Bettfedern GmbH & Co KG, Sustainable Down Source, Feather Industries, KL Down, and United Feather & Down.
Down Feather Industry Market Structure & Innovation Trends
This section analyzes the competitive landscape of the down feather industry, exploring market concentration, innovation drivers, regulatory frameworks, and significant M&A activities. The report delves into the market share held by key players, quantifying their influence on the overall market structure. It also examines the impact of regulatory frameworks on industry practices and identifies key innovation drivers shaping product development and market expansion. Further analysis includes the exploration of product substitutes and their competitive impact, along with an examination of end-user demographics and their evolving needs and preferences. Finally, the report presents an overview of recent M&A activities within the industry, including deal values where available (xx Million).
- Market Concentration: Analysis of market share distribution among key players.
- Innovation Drivers: Examination of technological advancements and consumer demand driving innovation.
- Regulatory Frameworks: Evaluation of relevant regulations and their impact on the industry.
- Product Substitutes: Assessment of alternative materials and their market penetration.
- End-User Demographics: Analysis of consumer preferences and purchasing behavior.
- M&A Activities: Overview of recent mergers and acquisitions, with deal values where available (xx Million).
Down Feather Industry Market Dynamics & Trends
This section provides a comprehensive overview of the market dynamics and trends influencing the down feather industry. The analysis covers market growth drivers, technological disruptions, consumer preferences, and competitive dynamics. Key performance indicators, such as CAGR (Compound Annual Growth Rate) and market penetration rates, are presented to provide a quantitative understanding of market performance. The report further explores emerging trends and their potential impact on market growth projections. The analysis includes a detailed examination of the factors contributing to market expansion and the challenges faced by industry participants.
Dominant Regions & Segments in Down Feather Industry
This section identifies the leading regions and segments within the down feather industry. The analysis includes detailed assessments of the key drivers contributing to regional dominance. This may include factors such as economic policies, infrastructure development, consumer demand, and the presence of major industry players. The dominant segments are also analyzed, focusing on their share of the total market and the growth outlook for each. The leading segments are examined from both Origin (Duck, Goose) and Application (Pillow, Comforters, Bedding, Other Applications) perspectives.
- Leading Regions: Detailed analysis of top-performing regions.
- Key Drivers (Regional):
- Economic policies that support the industry.
- Infrastructure supporting production and distribution.
- Consumer spending patterns and preferences.
- Leading Segments (Origin & Application): Analysis of market share and growth projections for each segment.
- Key Drivers (Segmental): Factors contributing to segment dominance, such as consumer preferences or technological advancements.
Down Feather Industry Product Innovations
This section summarizes recent product developments, highlighting technological trends and market fit. The analysis includes an overview of new product applications and their competitive advantages.
Report Scope & Segmentation Analysis
This section details the market segmentation by origin (Duck, Goose) and application (Pillow, Comforters, Bedding, Other Applications). Each segment's growth projections, market sizes, and competitive dynamics are included.
- Origin: Duck and Goose segments with respective market sizes and growth forecasts.
- Application: Pillow, Comforters, Bedding, and Other Applications segments with respective market sizes and growth forecasts.
Key Drivers of Down Feather Industry Growth
This section outlines the key factors driving growth in the down feather industry. These drivers include technological advancements, economic factors, and regulatory changes.
Challenges in the Down Feather Industry Sector
This section discusses the key challenges impacting the down feather industry. These challenges include regulatory hurdles, supply chain issues, and competitive pressures.
Emerging Opportunities in Down Feather Industry
This section highlights emerging opportunities within the down feather industry. These opportunities include new markets, technologies, and evolving consumer preferences.
Leading Players in the Down Feather Industry Market
- Moonlight Feather
- Prauden
- Down-Lite International Inc
- Allied Feather & Down Corp
- Anhui Yahua Feather Down Co Ltd
- ROHDEX Bettfedern GmbH & Co KG
- Sustainable Down Source
- Feather Industries
- KL Down
- United Feather & Down
Key Developments in Down Feather Industry Industry
- November 2022: Allied Feather & Down partnered with Project Our Winters (POW) to improve transparency and sustainability.
- March 2022: Allied Feather + Down launched a new jacket capsule collection.
- January 2022: Emma launched the intelligent mattress Motion.
Future Outlook for Down Feather Industry Market
This section summarizes the growth accelerators and strategic opportunities expected to shape the future of the down feather industry. The analysis provides insights into the potential for market expansion and the key factors that will drive growth in the coming years.
Down Feather Industry Segmentation
-
1. Origin
- 1.1. Duck
- 1.2. Goose
-
2. Application
- 2.1. Pillow
- 2.2. Comforters
- 2.3. Bedding
- 2.4. Other Applications
Down Feather Industry Segmentation By Geography
-
1. North America
- 1.1. United States
- 1.2. Canada
- 1.3. Mexico
- 1.4. Rest of North America
-
2. Europe
- 2.1. United Kingdom
- 2.2. Germany
- 2.3. France
- 2.4. Italy
- 2.5. Russia
- 2.6. Rest of Europe
-
3. Asia Pacific
- 3.1. China
- 3.2. Japan
- 3.3. India
- 3.4. Australia
- 3.5. Rest of Asia Pacific
-
4. South America
- 4.1. Brazil
- 4.2. Argentina
- 4.3. Rest of South America
-
5. Middle East and Africa
- 5.1. Saudi Arabia
- 5.2. South Africa
- 5.3. Rest of Middle East and Africa
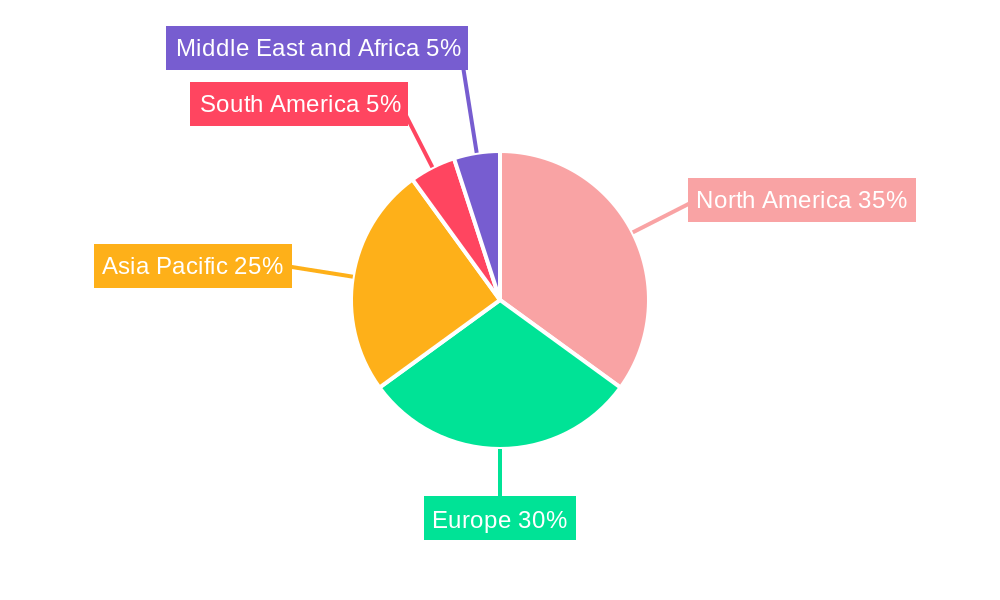
Down Feather Industry Regional Market Share
Geographic Coverage of Down Feather Industry
Down Feather Industry REPORT HIGHLIGHTS
| Aspects | Details |
|---|---|
| Study Period | 2020-2034 |
| Base Year | 2025 |
| Estimated Year | 2026 |
| Forecast Period | 2026-2034 |
| Historical Period | 2020-2025 |
| Growth Rate | CAGR of 6.77% from 2020-2034 |
| Segmentation |
|
Table of Contents
- 1. Introduction
- 1.1. Research Scope
- 1.2. Market Segmentation
- 1.3. Research Objective
- 1.4. Definitions and Assumptions
- 2. Executive Summary
- 2.1. Market Snapshot
- 3. Market Dynamics
- 3.1. Market Drivers
- 3.2. Market Restrains
- 3.3. Market Trends
- 3.4. Market Opportunities
- 4. Market Factor Analysis
- 4.1. Porters Five Forces
- 4.1.1. Bargaining Power of Suppliers
- 4.1.2. Bargaining Power of Buyers
- 4.1.3. Threat of New Entrants
- 4.1.4. Threat of Substitutes
- 4.1.5. Competitive Rivalry
- 4.2. PESTEL analysis
- 4.3. BCG Analysis
- 4.3.1. Stars (High Growth, High Market Share)
- 4.3.2. Cash Cows (Low Growth, High Market Share)
- 4.3.3. Question Mark (High Growth, Low Market Share)
- 4.3.4. Dogs (Low Growth, Low Market Share)
- 4.4. Ansoff Matrix Analysis
- 4.5. Supply Chain Analysis
- 4.6. Regulatory Landscape
- 4.7. Current Market Potential and Opportunity Assessment (TAM–SAM–SOM Framework)
- 4.8. PRI Analyst Note
- 4.1. Porters Five Forces
- 5. Market Analysis, Insights and Forecast 2021-2033
- 5.1. Market Analysis, Insights and Forecast - by Origin
- 5.1.1. Duck
- 5.1.2. Goose
- 5.2. Market Analysis, Insights and Forecast - by Application
- 5.2.1. Pillow
- 5.2.2. Comforters
- 5.2.3. Bedding
- 5.2.4. Other Applications
- 5.3. Market Analysis, Insights and Forecast - by Region
- 5.3.1. North America
- 5.3.2. Europe
- 5.3.3. Asia Pacific
- 5.3.4. South America
- 5.3.5. Middle East and Africa
- 5.1. Market Analysis, Insights and Forecast - by Origin
- 6. Global Down Feather Industry Analysis, Insights and Forecast, 2021-2033
- 6.1. Market Analysis, Insights and Forecast - by Origin
- 6.1.1. Duck
- 6.1.2. Goose
- 6.2. Market Analysis, Insights and Forecast - by Application
- 6.2.1. Pillow
- 6.2.2. Comforters
- 6.2.3. Bedding
- 6.2.4. Other Applications
- 6.1. Market Analysis, Insights and Forecast - by Origin
- 7. North America Down Feather Industry Analysis, Insights and Forecast, 2020-2032
- 7.1. Market Analysis, Insights and Forecast - by Origin
- 7.1.1. Duck
- 7.1.2. Goose
- 7.2. Market Analysis, Insights and Forecast - by Application
- 7.2.1. Pillow
- 7.2.2. Comforters
- 7.2.3. Bedding
- 7.2.4. Other Applications
- 7.1. Market Analysis, Insights and Forecast - by Origin
- 8. Europe Down Feather Industry Analysis, Insights and Forecast, 2020-2032
- 8.1. Market Analysis, Insights and Forecast - by Origin
- 8.1.1. Duck
- 8.1.2. Goose
- 8.2. Market Analysis, Insights and Forecast - by Application
- 8.2.1. Pillow
- 8.2.2. Comforters
- 8.2.3. Bedding
- 8.2.4. Other Applications
- 8.1. Market Analysis, Insights and Forecast - by Origin
- 9. Asia Pacific Down Feather Industry Analysis, Insights and Forecast, 2020-2032
- 9.1. Market Analysis, Insights and Forecast - by Origin
- 9.1.1. Duck
- 9.1.2. Goose
- 9.2. Market Analysis, Insights and Forecast - by Application
- 9.2.1. Pillow
- 9.2.2. Comforters
- 9.2.3. Bedding
- 9.2.4. Other Applications
- 9.1. Market Analysis, Insights and Forecast - by Origin
- 10. South America Down Feather Industry Analysis, Insights and Forecast, 2020-2032
- 10.1. Market Analysis, Insights and Forecast - by Origin
- 10.1.1. Duck
- 10.1.2. Goose
- 10.2. Market Analysis, Insights and Forecast - by Application
- 10.2.1. Pillow
- 10.2.2. Comforters
- 10.2.3. Bedding
- 10.2.4. Other Applications
- 10.1. Market Analysis, Insights and Forecast - by Origin
- 11. Middle East and Africa Down Feather Industry Analysis, Insights and Forecast, 2020-2032
- 11.1. Market Analysis, Insights and Forecast - by Origin
- 11.1.1. Duck
- 11.1.2. Goose
- 11.2. Market Analysis, Insights and Forecast - by Application
- 11.2.1. Pillow
- 11.2.2. Comforters
- 11.2.3. Bedding
- 11.2.4. Other Applications
- 11.1. Market Analysis, Insights and Forecast - by Origin
- 12. Competitive Analysis
- 12.1. Company Profiles
- 12.1.1 Moonlight Feather
- 12.1.1.1. Company Overview
- 12.1.1.2. Products
- 12.1.1.3. Company Financials
- 12.1.1.4. SWOT Analysis
- 12.1.2 Prauden
- 12.1.2.1. Company Overview
- 12.1.2.2. Products
- 12.1.2.3. Company Financials
- 12.1.2.4. SWOT Analysis
- 12.1.3 Down-Lite International Inc *List Not Exhaustive
- 12.1.3.1. Company Overview
- 12.1.3.2. Products
- 12.1.3.3. Company Financials
- 12.1.3.4. SWOT Analysis
- 12.1.4 Allied Feather & Down Corp
- 12.1.4.1. Company Overview
- 12.1.4.2. Products
- 12.1.4.3. Company Financials
- 12.1.4.4. SWOT Analysis
- 12.1.5 Anhui Yahua Feather Down Co Ltd
- 12.1.5.1. Company Overview
- 12.1.5.2. Products
- 12.1.5.3. Company Financials
- 12.1.5.4. SWOT Analysis
- 12.1.6 ROHDEX Bettfedern GmbH & Co KG
- 12.1.6.1. Company Overview
- 12.1.6.2. Products
- 12.1.6.3. Company Financials
- 12.1.6.4. SWOT Analysis
- 12.1.7 Sustainable Down Source
- 12.1.7.1. Company Overview
- 12.1.7.2. Products
- 12.1.7.3. Company Financials
- 12.1.7.4. SWOT Analysis
- 12.1.8 Feather Industries
- 12.1.8.1. Company Overview
- 12.1.8.2. Products
- 12.1.8.3. Company Financials
- 12.1.8.4. SWOT Analysis
- 12.1.9 KL Down
- 12.1.9.1. Company Overview
- 12.1.9.2. Products
- 12.1.9.3. Company Financials
- 12.1.9.4. SWOT Analysis
- 12.1.10 United Feather & Down
- 12.1.10.1. Company Overview
- 12.1.10.2. Products
- 12.1.10.3. Company Financials
- 12.1.10.4. SWOT Analysis
- 12.1.1 Moonlight Feather
- 12.2. Market Entropy
- 12.2.1 Company's Key Areas Served
- 12.2.2 Recent Developments
- 12.3. Company Market Share Analysis 2025
- 12.3.1 Top 5 Companies Market Share Analysis
- 12.3.2 Top 3 Companies Market Share Analysis
- 12.4. List of Potential Customers
- 13. Research Methodology
List of Figures
- Figure 1: Global Down Feather Industry Revenue Breakdown (Million, %) by Region 2025 & 2033
- Figure 2: North America Down Feather Industry Revenue (Million), by Origin 2025 & 2033
- Figure 3: North America Down Feather Industry Revenue Share (%), by Origin 2025 & 2033
- Figure 4: North America Down Feather Industry Revenue (Million), by Application 2025 & 2033
- Figure 5: North America Down Feather Industry Revenue Share (%), by Application 2025 & 2033
- Figure 6: North America Down Feather Industry Revenue (Million), by Country 2025 & 2033
- Figure 7: North America Down Feather Industry Revenue Share (%), by Country 2025 & 2033
- Figure 8: Europe Down Feather Industry Revenue (Million), by Origin 2025 & 2033
- Figure 9: Europe Down Feather Industry Revenue Share (%), by Origin 2025 & 2033
- Figure 10: Europe Down Feather Industry Revenue (Million), by Application 2025 & 2033
- Figure 11: Europe Down Feather Industry Revenue Share (%), by Application 2025 & 2033
- Figure 12: Europe Down Feather Industry Revenue (Million), by Country 2025 & 2033
- Figure 13: Europe Down Feather Industry Revenue Share (%), by Country 2025 & 2033
- Figure 14: Asia Pacific Down Feather Industry Revenue (Million), by Origin 2025 & 2033
- Figure 15: Asia Pacific Down Feather Industry Revenue Share (%), by Origin 2025 & 2033
- Figure 16: Asia Pacific Down Feather Industry Revenue (Million), by Application 2025 & 2033
- Figure 17: Asia Pacific Down Feather Industry Revenue Share (%), by Application 2025 & 2033
- Figure 18: Asia Pacific Down Feather Industry Revenue (Million), by Country 2025 & 2033
- Figure 19: Asia Pacific Down Feather Industry Revenue Share (%), by Country 2025 & 2033
- Figure 20: South America Down Feather Industry Revenue (Million), by Origin 2025 & 2033
- Figure 21: South America Down Feather Industry Revenue Share (%), by Origin 2025 & 2033
- Figure 22: South America Down Feather Industry Revenue (Million), by Application 2025 & 2033
- Figure 23: South America Down Feather Industry Revenue Share (%), by Application 2025 & 2033
- Figure 24: South America Down Feather Industry Revenue (Million), by Country 2025 & 2033
- Figure 25: South America Down Feather Industry Revenue Share (%), by Country 2025 & 2033
- Figure 26: Middle East and Africa Down Feather Industry Revenue (Million), by Origin 2025 & 2033
- Figure 27: Middle East and Africa Down Feather Industry Revenue Share (%), by Origin 2025 & 2033
- Figure 28: Middle East and Africa Down Feather Industry Revenue (Million), by Application 2025 & 2033
- Figure 29: Middle East and Africa Down Feather Industry Revenue Share (%), by Application 2025 & 2033
- Figure 30: Middle East and Africa Down Feather Industry Revenue (Million), by Country 2025 & 2033
- Figure 31: Middle East and Africa Down Feather Industry Revenue Share (%), by Country 2025 & 2033
List of Tables
- Table 1: Global Down Feather Industry Revenue Million Forecast, by Origin 2020 & 2033
- Table 2: Global Down Feather Industry Revenue Million Forecast, by Application 2020 & 2033
- Table 3: Global Down Feather Industry Revenue Million Forecast, by Region 2020 & 2033
- Table 4: Global Down Feather Industry Revenue Million Forecast, by Origin 2020 & 2033
- Table 5: Global Down Feather Industry Revenue Million Forecast, by Application 2020 & 2033
- Table 6: Global Down Feather Industry Revenue Million Forecast, by Country 2020 & 2033
- Table 7: United States Down Feather Industry Revenue (Million) Forecast, by Application 2020 & 2033
- Table 8: Canada Down Feather Industry Revenue (Million) Forecast, by Application 2020 & 2033
- Table 9: Mexico Down Feather Industry Revenue (Million) Forecast, by Application 2020 & 2033
- Table 10: Rest of North America Down Feather Industry Revenue (Million) Forecast, by Application 2020 & 2033
- Table 11: Global Down Feather Industry Revenue Million Forecast, by Origin 2020 & 2033
- Table 12: Global Down Feather Industry Revenue Million Forecast, by Application 2020 & 2033
- Table 13: Global Down Feather Industry Revenue Million Forecast, by Country 2020 & 2033
- Table 14: United Kingdom Down Feather Industry Revenue (Million) Forecast, by Application 2020 & 2033
- Table 15: Germany Down Feather Industry Revenue (Million) Forecast, by Application 2020 & 2033
- Table 16: France Down Feather Industry Revenue (Million) Forecast, by Application 2020 & 2033
- Table 17: Italy Down Feather Industry Revenue (Million) Forecast, by Application 2020 & 2033
- Table 18: Russia Down Feather Industry Revenue (Million) Forecast, by Application 2020 & 2033
- Table 19: Rest of Europe Down Feather Industry Revenue (Million) Forecast, by Application 2020 & 2033
- Table 20: Global Down Feather Industry Revenue Million Forecast, by Origin 2020 & 2033
- Table 21: Global Down Feather Industry Revenue Million Forecast, by Application 2020 & 2033
- Table 22: Global Down Feather Industry Revenue Million Forecast, by Country 2020 & 2033
- Table 23: China Down Feather Industry Revenue (Million) Forecast, by Application 2020 & 2033
- Table 24: Japan Down Feather Industry Revenue (Million) Forecast, by Application 2020 & 2033
- Table 25: India Down Feather Industry Revenue (Million) Forecast, by Application 2020 & 2033
- Table 26: Australia Down Feather Industry Revenue (Million) Forecast, by Application 2020 & 2033
- Table 27: Rest of Asia Pacific Down Feather Industry Revenue (Million) Forecast, by Application 2020 & 2033
- Table 28: Global Down Feather Industry Revenue Million Forecast, by Origin 2020 & 2033
- Table 29: Global Down Feather Industry Revenue Million Forecast, by Application 2020 & 2033
- Table 30: Global Down Feather Industry Revenue Million Forecast, by Country 2020 & 2033
- Table 31: Brazil Down Feather Industry Revenue (Million) Forecast, by Application 2020 & 2033
- Table 32: Argentina Down Feather Industry Revenue (Million) Forecast, by Application 2020 & 2033
- Table 33: Rest of South America Down Feather Industry Revenue (Million) Forecast, by Application 2020 & 2033
- Table 34: Global Down Feather Industry Revenue Million Forecast, by Origin 2020 & 2033
- Table 35: Global Down Feather Industry Revenue Million Forecast, by Application 2020 & 2033
- Table 36: Global Down Feather Industry Revenue Million Forecast, by Country 2020 & 2033
- Table 37: Saudi Arabia Down Feather Industry Revenue (Million) Forecast, by Application 2020 & 2033
- Table 38: South Africa Down Feather Industry Revenue (Million) Forecast, by Application 2020 & 2033
- Table 39: Rest of Middle East and Africa Down Feather Industry Revenue (Million) Forecast, by Application 2020 & 2033
Frequently Asked Questions
1. What is the projected Compound Annual Growth Rate (CAGR) of the Down Feather Industry?
The projected CAGR is approximately 6.77%.
2. Which companies are prominent players in the Down Feather Industry?
Key companies in the market include Moonlight Feather, Prauden, Down-Lite International Inc *List Not Exhaustive, Allied Feather & Down Corp, Anhui Yahua Feather Down Co Ltd, ROHDEX Bettfedern GmbH & Co KG, Sustainable Down Source, Feather Industries, KL Down, United Feather & Down.
3. What are the main segments of the Down Feather Industry?
The market segments include Origin, Application.
4. Can you provide details about the market size?
The market size is estimated to be USD 1.77 Million as of 2022.
5. What are some drivers contributing to market growth?
Rise in Tourism Expected to Drive the Market; Robust Luxury Market Infrastructure.
6. What are the notable trends driving market growth?
Increasing Demand for Sustainable Down and Feather.
7. Are there any restraints impacting market growth?
Counterfeit Goods Restricting the Market Growth.
8. Can you provide examples of recent developments in the market?
In November 2022, Allied Feather & Down partnered with climate action organization Project Our Winters(POW) to build sustainable products and track the product origin until the purchase with the TrackMyDown system to improve transparency towards using sustainable down products.
9. What pricing options are available for accessing the report?
Pricing options include single-user, multi-user, and enterprise licenses priced at USD 4750, USD 5250, and USD 8750 respectively.
10. Is the market size provided in terms of value or volume?
The market size is provided in terms of value, measured in Million.
11. Are there any specific market keywords associated with the report?
Yes, the market keyword associated with the report is "Down Feather Industry," which aids in identifying and referencing the specific market segment covered.
12. How do I determine which pricing option suits my needs best?
The pricing options vary based on user requirements and access needs. Individual users may opt for single-user licenses, while businesses requiring broader access may choose multi-user or enterprise licenses for cost-effective access to the report.
13. Are there any additional resources or data provided in the Down Feather Industry report?
While the report offers comprehensive insights, it's advisable to review the specific contents or supplementary materials provided to ascertain if additional resources or data are available.
14. How can I stay updated on further developments or reports in the Down Feather Industry?
To stay informed about further developments, trends, and reports in the Down Feather Industry, consider subscribing to industry newsletters, following relevant companies and organizations, or regularly checking reputable industry news sources and publications.
Methodology
Step 1 - Identification of Relevant Samples Size from Population Database


Step 2 - Approaches for Defining Global Market Size (Value, Volume* & Price*)

Note*: In applicable scenarios
Step 3 - Data Sources
Primary Research
- Web Analytics
- Survey Reports
- Research Institute
- Latest Research Reports
- Opinion Leaders
Secondary Research
- Annual Reports
- White Paper
- Latest Press Release
- Industry Association
- Paid Database
- Investor Presentations

Step 4 - Data Triangulation
Involves using different sources of information in order to increase the validity of a study
These sources are likely to be stakeholders in a program - participants, other researchers, program staff, other community members, and so on.
Then we put all data in single framework & apply various statistical tools to find out the dynamic on the market.
During the analysis stage, feedback from the stakeholder groups would be compared to determine areas of agreement as well as areas of divergence