

Key Insights
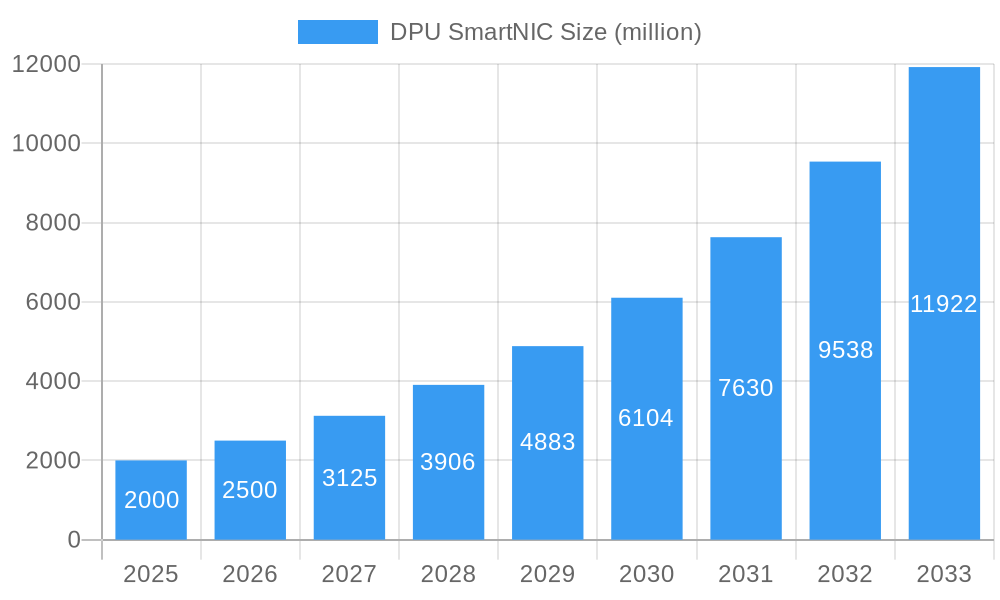
The Data Processing Unit (DPU) SmartNIC market is experiencing robust growth, driven by the increasing demand for high-performance computing, network acceleration, and data security in data centers and cloud environments. The market, estimated at $2 billion in 2025, is projected to exhibit a Compound Annual Growth Rate (CAGR) of approximately 25% from 2025 to 2033, reaching an estimated $10 billion by 2033. Key drivers include the proliferation of cloud computing, the rise of 5G networks, and the growing need for improved data center efficiency and security. The adoption of advanced technologies like artificial intelligence (AI) and machine learning (ML) is further fueling demand, as DPUs offer specialized hardware acceleration for these computationally intensive tasks. Major players like Intel, NVIDIA, and AMD are heavily invested in this space, constantly innovating and releasing new generations of DPUs with enhanced capabilities. Market segmentation is apparent based on deployment (cloud vs. on-premise), application (networking, security, storage), and end-user industry (finance, healthcare, telecom). Competitive landscape is fiercely dynamic, with established players and innovative startups vying for market share through product differentiation and strategic partnerships.
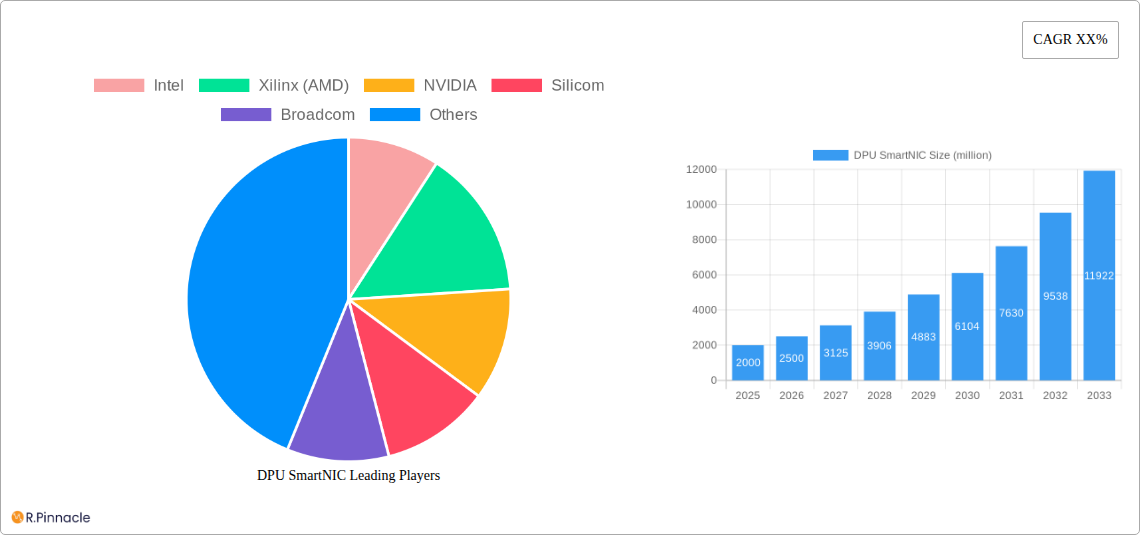
DPU SmartNIC Market Size (In Billion)
The restraints on market growth include the relatively high initial investment cost associated with DPU adoption and the need for skilled professionals to effectively integrate and manage these advanced technologies. However, the long-term benefits in terms of reduced latency, enhanced security, and improved operational efficiency are likely to outweigh these initial hurdles. Furthermore, ongoing technological advancements, particularly in areas such as network virtualization and software-defined networking (SDN), are expected to further stimulate the market’s expansion. The focus is shifting towards more integrated and software-defined DPUs, enhancing flexibility and scalability. The continued integration of DPUs into broader cloud and data center architectures will be a key factor driving future market growth.
DPU SmartNIC Company Market Share
DPU SmartNIC Market Report: 2019-2033 Forecast
This comprehensive report provides an in-depth analysis of the global DPU SmartNIC market, offering actionable insights for industry professionals, investors, and strategists. Covering the period from 2019 to 2033, with a focus on 2025, this report unveils the market's structure, dynamics, and future trajectory. The market is projected to reach xx million by 2033, showcasing substantial growth potential.
DPU SmartNIC Market Structure & Innovation Trends
The DPU SmartNIC market is characterized by a moderately concentrated landscape, with key players like Intel, NVIDIA, and Broadcom holding significant market share. However, several smaller, innovative companies are actively disrupting the market with specialized solutions. The market is driven by increasing demand for high-performance computing, network virtualization, and data center optimization. Regulatory frameworks, particularly around data security and privacy, significantly influence market growth. Product substitutes, such as traditional network interface cards (NICs), face increasing competition due to the DPUs' superior capabilities. End-user demographics are primarily concentrated in large enterprises and hyperscale data centers. M&A activity has been substantial, with several multi-million dollar deals shaping the market landscape in recent years. For example, the acquisition of xx by xx in 2022 for xx million dollars significantly altered the competitive dynamics.
- Market Share (2024 Estimate): Intel (xx%), NVIDIA (xx%), Broadcom (xx%), Others (xx%)
- M&A Deal Value (2019-2024): Over xx million dollars
DPU SmartNIC Market Dynamics & Trends
The DPU SmartNIC market exhibits robust growth, driven by several factors. The increasing adoption of cloud computing and virtualization is a primary growth catalyst, pushing demand for efficient data processing and network management solutions. Technological disruptions, particularly advancements in artificial intelligence (AI) and machine learning (ML), are fueling demand for high-bandwidth, low-latency networking solutions that DPUs provide. Consumer preference shifts towards enhanced security and performance are driving the adoption of DPUs across various industries. Competitive dynamics are intense, with companies focusing on product differentiation, strategic partnerships, and technological innovation to maintain a competitive edge. The Compound Annual Growth Rate (CAGR) from 2025-2033 is estimated to be xx%, and market penetration is expected to reach xx% by 2033.
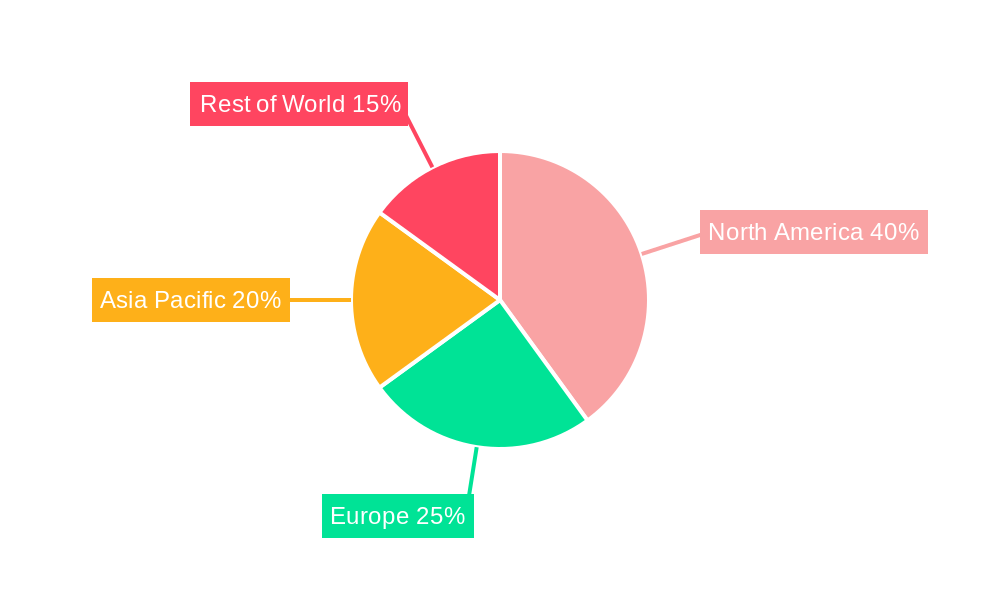
Dominant Regions & Segments in DPU SmartNIC
North America currently dominates the DPU SmartNIC market, driven by high technology adoption rates, a strong presence of major players, and robust investment in data center infrastructure.
- Key Drivers in North America:
- High concentration of hyperscale data centers
- Extensive investment in R&D and innovation
- Favorable regulatory environment for technology adoption
- Dominance Analysis: The region benefits from a mature ecosystem, high spending on IT infrastructure, and a strong emphasis on data security and efficiency. Europe and Asia-Pacific are expected to witness significant growth in the coming years.
DPU SmartNIC Product Innovations
Recent innovations in DPU SmartNICs focus on enhanced processing capabilities, improved security features, and increased integration with cloud platforms. This includes advancements in programmable hardware, sophisticated offload capabilities, and improved power efficiency. These innovations cater to the growing demand for high-performance, secure, and efficient data processing in diverse applications, ranging from cloud computing and high-frequency trading to AI/ML deployments. The competitive advantage lies in offering superior performance, enhanced security, and seamless integration with existing infrastructure.
Report Scope & Segmentation Analysis
This report segments the DPU SmartNIC market by several key factors, including:
- By Type: [Specific types - e.g., FPGA-based, ASIC-based] Each segment demonstrates unique growth trajectories based on performance capabilities and cost structures.
- By Application: [Specific applications - e.g., Cloud Computing, High-Performance Computing, Networking, etc.] The market size and growth vary depending on industry-specific requirements.
- By Geography: [Regions - e.g., North America, Europe, Asia-Pacific, etc.] Each region's market is influenced by technological advancements, government policies, and market maturity.
Key Drivers of DPU SmartNIC Growth
Several factors contribute to the growth of the DPU SmartNIC market. Technological advancements, such as the development of high-bandwidth, low-latency networking technologies, are a primary driver. The increasing adoption of cloud computing and virtualization creates significant demand for efficient data processing solutions. Government regulations and initiatives aimed at improving data security and privacy are driving the adoption of secure networking solutions like DPUs.
Challenges in the DPU SmartNIC Sector
Despite significant growth potential, the DPU SmartNIC market faces certain challenges. High initial investment costs can be a barrier to entry for smaller companies. Supply chain disruptions and component shortages can impact production and availability. Intense competition among established players and emerging startups creates a dynamic and challenging market environment. Regulatory hurdles in certain regions might also restrict market expansion. These factors can collectively affect market growth by xx% by 2030.
Emerging Opportunities in DPU SmartNIC
Emerging opportunities include the integration of DPUs with 5G networks, the expansion into new verticals like automotive and industrial IoT, and the development of specialized DPUs for AI/ML workloads. The increasing demand for edge computing is creating new market opportunities for DPUs designed for deployment at the network edge. Furthermore, advancements in software-defined networking (SDN) and network function virtualization (NFV) are creating new opportunities for DPU integration.
Leading Players in the DPU SmartNIC Market
- Intel
- Xilinx (AMD)
- NVIDIA
- Silicom
- Broadcom
- Napatech
- Marvell
- BittWare (Molex)
- Ethernity
- Magmio (Netcope)
- Netronome
- Kalray
- AWS (Amazon)
- Cisco
- Microsoft
- Achronix
- Ethernity Networks
- Asterfusion Data Technologies
- Fungible
- Nebulamatrix
- Corigine
- Yusur
- Jaguar Microsystems
Key Developments in DPU SmartNIC Industry
- 2022 Q4: Intel launches its next-generation DPU SmartNIC with enhanced security features.
- 2023 Q1: NVIDIA partners with a major cloud provider to integrate its DPUs into their cloud infrastructure.
- 2023 Q2: Broadcom acquires a smaller DPU vendor, expanding its market share. (Further examples would be included here)
Future Outlook for DPU SmartNIC Market
The future of the DPU SmartNIC market is bright, with continued growth driven by technological advancements, increasing data volumes, and the growing adoption of cloud computing and AI/ML. Strategic partnerships and collaborations among key players will shape market dynamics. The focus on developing energy-efficient and cost-effective DPUs will be crucial for market expansion. New applications in edge computing and specialized industries will unlock further growth opportunities.
DPU SmartNIC Segmentation
-
1. Application
- 1.1. Data Communication
- 1.2. Telecom
- 1.3. Internet of Things
- 1.4. Others
-
2. Types
- 2.1. FPGA-based
- 2.2. ASIC–based
- 2.3. MP-based
DPU SmartNIC Segmentation By Geography
-
1. North America
- 1.1. United States
- 1.2. Canada
- 1.3. Mexico
-
2. South America
- 2.1. Brazil
- 2.2. Argentina
- 2.3. Rest of South America
-
3. Europe
- 3.1. United Kingdom
- 3.2. Germany
- 3.3. France
- 3.4. Italy
- 3.5. Spain
- 3.6. Russia
- 3.7. Benelux
- 3.8. Nordics
- 3.9. Rest of Europe
-
4. Middle East & Africa
- 4.1. Turkey
- 4.2. Israel
- 4.3. GCC
- 4.4. North Africa
- 4.5. South Africa
- 4.6. Rest of Middle East & Africa
-
5. Asia Pacific
- 5.1. China
- 5.2. India
- 5.3. Japan
- 5.4. South Korea
- 5.5. ASEAN
- 5.6. Oceania
- 5.7. Rest of Asia Pacific
DPU SmartNIC Regional Market Share
Geographic Coverage of DPU SmartNIC
DPU SmartNIC REPORT HIGHLIGHTS
| Aspects | Details |
|---|---|
| Study Period | 2020-2034 |
| Base Year | 2025 |
| Estimated Year | 2026 |
| Forecast Period | 2026-2034 |
| Historical Period | 2020-2025 |
| Growth Rate | CAGR of XX% from 2020-2034 |
| Segmentation |
|
Table of Contents
- 1. Introduction
- 1.1. Research Scope
- 1.2. Market Segmentation
- 1.3. Research Objective
- 1.4. Definitions and Assumptions
- 2. Executive Summary
- 2.1. Market Snapshot
- 3. Market Dynamics
- 3.1. Market Drivers
- 3.2. Market Restrains
- 3.3. Market Trends
- 3.4. Market Opportunities
- 4. Market Factor Analysis
- 4.1. Porters Five Forces
- 4.1.1. Bargaining Power of Suppliers
- 4.1.2. Bargaining Power of Buyers
- 4.1.3. Threat of New Entrants
- 4.1.4. Threat of Substitutes
- 4.1.5. Competitive Rivalry
- 4.2. PESTEL analysis
- 4.3. BCG Analysis
- 4.3.1. Stars (High Growth, High Market Share)
- 4.3.2. Cash Cows (Low Growth, High Market Share)
- 4.3.3. Question Mark (High Growth, Low Market Share)
- 4.3.4. Dogs (Low Growth, Low Market Share)
- 4.4. Ansoff Matrix Analysis
- 4.5. Supply Chain Analysis
- 4.6. Regulatory Landscape
- 4.7. Current Market Potential and Opportunity Assessment (TAM–SAM–SOM Framework)
- 4.8. PRI Analyst Note
- 4.1. Porters Five Forces
- 5. Market Analysis, Insights and Forecast 2021-2033
- 5.1. Market Analysis, Insights and Forecast - by Application
- 5.1.1. Data Communication
- 5.1.2. Telecom
- 5.1.3. Internet of Things
- 5.1.4. Others
- 5.2. Market Analysis, Insights and Forecast - by Types
- 5.2.1. FPGA-based
- 5.2.2. ASIC–based
- 5.2.3. MP-based
- 5.3. Market Analysis, Insights and Forecast - by Region
- 5.3.1. North America
- 5.3.2. South America
- 5.3.3. Europe
- 5.3.4. Middle East & Africa
- 5.3.5. Asia Pacific
- 5.1. Market Analysis, Insights and Forecast - by Application
- 6. Global DPU SmartNIC Analysis, Insights and Forecast, 2021-2033
- 6.1. Market Analysis, Insights and Forecast - by Application
- 6.1.1. Data Communication
- 6.1.2. Telecom
- 6.1.3. Internet of Things
- 6.1.4. Others
- 6.2. Market Analysis, Insights and Forecast - by Types
- 6.2.1. FPGA-based
- 6.2.2. ASIC–based
- 6.2.3. MP-based
- 6.1. Market Analysis, Insights and Forecast - by Application
- 7. North America DPU SmartNIC Analysis, Insights and Forecast, 2020-2032
- 7.1. Market Analysis, Insights and Forecast - by Application
- 7.1.1. Data Communication
- 7.1.2. Telecom
- 7.1.3. Internet of Things
- 7.1.4. Others
- 7.2. Market Analysis, Insights and Forecast - by Types
- 7.2.1. FPGA-based
- 7.2.2. ASIC–based
- 7.2.3. MP-based
- 7.1. Market Analysis, Insights and Forecast - by Application
- 8. South America DPU SmartNIC Analysis, Insights and Forecast, 2020-2032
- 8.1. Market Analysis, Insights and Forecast - by Application
- 8.1.1. Data Communication
- 8.1.2. Telecom
- 8.1.3. Internet of Things
- 8.1.4. Others
- 8.2. Market Analysis, Insights and Forecast - by Types
- 8.2.1. FPGA-based
- 8.2.2. ASIC–based
- 8.2.3. MP-based
- 8.1. Market Analysis, Insights and Forecast - by Application
- 9. Europe DPU SmartNIC Analysis, Insights and Forecast, 2020-2032
- 9.1. Market Analysis, Insights and Forecast - by Application
- 9.1.1. Data Communication
- 9.1.2. Telecom
- 9.1.3. Internet of Things
- 9.1.4. Others
- 9.2. Market Analysis, Insights and Forecast - by Types
- 9.2.1. FPGA-based
- 9.2.2. ASIC–based
- 9.2.3. MP-based
- 9.1. Market Analysis, Insights and Forecast - by Application
- 10. Middle East & Africa DPU SmartNIC Analysis, Insights and Forecast, 2020-2032
- 10.1. Market Analysis, Insights and Forecast - by Application
- 10.1.1. Data Communication
- 10.1.2. Telecom
- 10.1.3. Internet of Things
- 10.1.4. Others
- 10.2. Market Analysis, Insights and Forecast - by Types
- 10.2.1. FPGA-based
- 10.2.2. ASIC–based
- 10.2.3. MP-based
- 10.1. Market Analysis, Insights and Forecast - by Application
- 11. Asia Pacific DPU SmartNIC Analysis, Insights and Forecast, 2020-2032
- 11.1. Market Analysis, Insights and Forecast - by Application
- 11.1.1. Data Communication
- 11.1.2. Telecom
- 11.1.3. Internet of Things
- 11.1.4. Others
- 11.2. Market Analysis, Insights and Forecast - by Types
- 11.2.1. FPGA-based
- 11.2.2. ASIC–based
- 11.2.3. MP-based
- 11.1. Market Analysis, Insights and Forecast - by Application
- 12. Competitive Analysis
- 12.1. Company Profiles
- 12.1.1 Intel
- 12.1.1.1. Company Overview
- 12.1.1.2. Products
- 12.1.1.3. Company Financials
- 12.1.1.4. SWOT Analysis
- 12.1.2 Xilinx (AMD)
- 12.1.2.1. Company Overview
- 12.1.2.2. Products
- 12.1.2.3. Company Financials
- 12.1.2.4. SWOT Analysis
- 12.1.3 NVIDIA
- 12.1.3.1. Company Overview
- 12.1.3.2. Products
- 12.1.3.3. Company Financials
- 12.1.3.4. SWOT Analysis
- 12.1.4 Silicom
- 12.1.4.1. Company Overview
- 12.1.4.2. Products
- 12.1.4.3. Company Financials
- 12.1.4.4. SWOT Analysis
- 12.1.5 Broadcom
- 12.1.5.1. Company Overview
- 12.1.5.2. Products
- 12.1.5.3. Company Financials
- 12.1.5.4. SWOT Analysis
- 12.1.6 Napatech
- 12.1.6.1. Company Overview
- 12.1.6.2. Products
- 12.1.6.3. Company Financials
- 12.1.6.4. SWOT Analysis
- 12.1.7 Marvell
- 12.1.7.1. Company Overview
- 12.1.7.2. Products
- 12.1.7.3. Company Financials
- 12.1.7.4. SWOT Analysis
- 12.1.8 BittWare(Molex)
- 12.1.8.1. Company Overview
- 12.1.8.2. Products
- 12.1.8.3. Company Financials
- 12.1.8.4. SWOT Analysis
- 12.1.9 Ethernity
- 12.1.9.1. Company Overview
- 12.1.9.2. Products
- 12.1.9.3. Company Financials
- 12.1.9.4. SWOT Analysis
- 12.1.10 Magmio (Netcope)
- 12.1.10.1. Company Overview
- 12.1.10.2. Products
- 12.1.10.3. Company Financials
- 12.1.10.4. SWOT Analysis
- 12.1.11 Netronome
- 12.1.11.1. Company Overview
- 12.1.11.2. Products
- 12.1.11.3. Company Financials
- 12.1.11.4. SWOT Analysis
- 12.1.12 Kalray
- 12.1.12.1. Company Overview
- 12.1.12.2. Products
- 12.1.12.3. Company Financials
- 12.1.12.4. SWOT Analysis
- 12.1.13 AWS (Amazon)
- 12.1.13.1. Company Overview
- 12.1.13.2. Products
- 12.1.13.3. Company Financials
- 12.1.13.4. SWOT Analysis
- 12.1.14 Cisco
- 12.1.14.1. Company Overview
- 12.1.14.2. Products
- 12.1.14.3. Company Financials
- 12.1.14.4. SWOT Analysis
- 12.1.15 Microsoft
- 12.1.15.1. Company Overview
- 12.1.15.2. Products
- 12.1.15.3. Company Financials
- 12.1.15.4. SWOT Analysis
- 12.1.16 Achronix
- 12.1.16.1. Company Overview
- 12.1.16.2. Products
- 12.1.16.3. Company Financials
- 12.1.16.4. SWOT Analysis
- 12.1.17 Ethernity Networks
- 12.1.17.1. Company Overview
- 12.1.17.2. Products
- 12.1.17.3. Company Financials
- 12.1.17.4. SWOT Analysis
- 12.1.18 Asterfusion Data Technologies
- 12.1.18.1. Company Overview
- 12.1.18.2. Products
- 12.1.18.3. Company Financials
- 12.1.18.4. SWOT Analysis
- 12.1.19 Fungible
- 12.1.19.1. Company Overview
- 12.1.19.2. Products
- 12.1.19.3. Company Financials
- 12.1.19.4. SWOT Analysis
- 12.1.20 Nebulamatrix
- 12.1.20.1. Company Overview
- 12.1.20.2. Products
- 12.1.20.3. Company Financials
- 12.1.20.4. SWOT Analysis
- 12.1.21 Corigine
- 12.1.21.1. Company Overview
- 12.1.21.2. Products
- 12.1.21.3. Company Financials
- 12.1.21.4. SWOT Analysis
- 12.1.22 Yusur
- 12.1.22.1. Company Overview
- 12.1.22.2. Products
- 12.1.22.3. Company Financials
- 12.1.22.4. SWOT Analysis
- 12.1.23 Jaguar Microsystems
- 12.1.23.1. Company Overview
- 12.1.23.2. Products
- 12.1.23.3. Company Financials
- 12.1.23.4. SWOT Analysis
- 12.1.1 Intel
- 12.2. Market Entropy
- 12.2.1 Company's Key Areas Served
- 12.2.2 Recent Developments
- 12.3. Company Market Share Analysis 2025
- 12.3.1 Top 5 Companies Market Share Analysis
- 12.3.2 Top 3 Companies Market Share Analysis
- 12.4. List of Potential Customers
- 13. Research Methodology
List of Figures
- Figure 1: Global DPU SmartNIC Revenue Breakdown (million, %) by Region 2025 & 2033
- Figure 2: Global DPU SmartNIC Volume Breakdown (K, %) by Region 2025 & 2033
- Figure 3: North America DPU SmartNIC Revenue (million), by Application 2025 & 2033
- Figure 4: North America DPU SmartNIC Volume (K), by Application 2025 & 2033
- Figure 5: North America DPU SmartNIC Revenue Share (%), by Application 2025 & 2033
- Figure 6: North America DPU SmartNIC Volume Share (%), by Application 2025 & 2033
- Figure 7: North America DPU SmartNIC Revenue (million), by Types 2025 & 2033
- Figure 8: North America DPU SmartNIC Volume (K), by Types 2025 & 2033
- Figure 9: North America DPU SmartNIC Revenue Share (%), by Types 2025 & 2033
- Figure 10: North America DPU SmartNIC Volume Share (%), by Types 2025 & 2033
- Figure 11: North America DPU SmartNIC Revenue (million), by Country 2025 & 2033
- Figure 12: North America DPU SmartNIC Volume (K), by Country 2025 & 2033
- Figure 13: North America DPU SmartNIC Revenue Share (%), by Country 2025 & 2033
- Figure 14: North America DPU SmartNIC Volume Share (%), by Country 2025 & 2033
- Figure 15: South America DPU SmartNIC Revenue (million), by Application 2025 & 2033
- Figure 16: South America DPU SmartNIC Volume (K), by Application 2025 & 2033
- Figure 17: South America DPU SmartNIC Revenue Share (%), by Application 2025 & 2033
- Figure 18: South America DPU SmartNIC Volume Share (%), by Application 2025 & 2033
- Figure 19: South America DPU SmartNIC Revenue (million), by Types 2025 & 2033
- Figure 20: South America DPU SmartNIC Volume (K), by Types 2025 & 2033
- Figure 21: South America DPU SmartNIC Revenue Share (%), by Types 2025 & 2033
- Figure 22: South America DPU SmartNIC Volume Share (%), by Types 2025 & 2033
- Figure 23: South America DPU SmartNIC Revenue (million), by Country 2025 & 2033
- Figure 24: South America DPU SmartNIC Volume (K), by Country 2025 & 2033
- Figure 25: South America DPU SmartNIC Revenue Share (%), by Country 2025 & 2033
- Figure 26: South America DPU SmartNIC Volume Share (%), by Country 2025 & 2033
- Figure 27: Europe DPU SmartNIC Revenue (million), by Application 2025 & 2033
- Figure 28: Europe DPU SmartNIC Volume (K), by Application 2025 & 2033
- Figure 29: Europe DPU SmartNIC Revenue Share (%), by Application 2025 & 2033
- Figure 30: Europe DPU SmartNIC Volume Share (%), by Application 2025 & 2033
- Figure 31: Europe DPU SmartNIC Revenue (million), by Types 2025 & 2033
- Figure 32: Europe DPU SmartNIC Volume (K), by Types 2025 & 2033
- Figure 33: Europe DPU SmartNIC Revenue Share (%), by Types 2025 & 2033
- Figure 34: Europe DPU SmartNIC Volume Share (%), by Types 2025 & 2033
- Figure 35: Europe DPU SmartNIC Revenue (million), by Country 2025 & 2033
- Figure 36: Europe DPU SmartNIC Volume (K), by Country 2025 & 2033
- Figure 37: Europe DPU SmartNIC Revenue Share (%), by Country 2025 & 2033
- Figure 38: Europe DPU SmartNIC Volume Share (%), by Country 2025 & 2033
- Figure 39: Middle East & Africa DPU SmartNIC Revenue (million), by Application 2025 & 2033
- Figure 40: Middle East & Africa DPU SmartNIC Volume (K), by Application 2025 & 2033
- Figure 41: Middle East & Africa DPU SmartNIC Revenue Share (%), by Application 2025 & 2033
- Figure 42: Middle East & Africa DPU SmartNIC Volume Share (%), by Application 2025 & 2033
- Figure 43: Middle East & Africa DPU SmartNIC Revenue (million), by Types 2025 & 2033
- Figure 44: Middle East & Africa DPU SmartNIC Volume (K), by Types 2025 & 2033
- Figure 45: Middle East & Africa DPU SmartNIC Revenue Share (%), by Types 2025 & 2033
- Figure 46: Middle East & Africa DPU SmartNIC Volume Share (%), by Types 2025 & 2033
- Figure 47: Middle East & Africa DPU SmartNIC Revenue (million), by Country 2025 & 2033
- Figure 48: Middle East & Africa DPU SmartNIC Volume (K), by Country 2025 & 2033
- Figure 49: Middle East & Africa DPU SmartNIC Revenue Share (%), by Country 2025 & 2033
- Figure 50: Middle East & Africa DPU SmartNIC Volume Share (%), by Country 2025 & 2033
- Figure 51: Asia Pacific DPU SmartNIC Revenue (million), by Application 2025 & 2033
- Figure 52: Asia Pacific DPU SmartNIC Volume (K), by Application 2025 & 2033
- Figure 53: Asia Pacific DPU SmartNIC Revenue Share (%), by Application 2025 & 2033
- Figure 54: Asia Pacific DPU SmartNIC Volume Share (%), by Application 2025 & 2033
- Figure 55: Asia Pacific DPU SmartNIC Revenue (million), by Types 2025 & 2033
- Figure 56: Asia Pacific DPU SmartNIC Volume (K), by Types 2025 & 2033
- Figure 57: Asia Pacific DPU SmartNIC Revenue Share (%), by Types 2025 & 2033
- Figure 58: Asia Pacific DPU SmartNIC Volume Share (%), by Types 2025 & 2033
- Figure 59: Asia Pacific DPU SmartNIC Revenue (million), by Country 2025 & 2033
- Figure 60: Asia Pacific DPU SmartNIC Volume (K), by Country 2025 & 2033
- Figure 61: Asia Pacific DPU SmartNIC Revenue Share (%), by Country 2025 & 2033
- Figure 62: Asia Pacific DPU SmartNIC Volume Share (%), by Country 2025 & 2033
List of Tables
- Table 1: Global DPU SmartNIC Revenue million Forecast, by Application 2020 & 2033
- Table 2: Global DPU SmartNIC Volume K Forecast, by Application 2020 & 2033
- Table 3: Global DPU SmartNIC Revenue million Forecast, by Types 2020 & 2033
- Table 4: Global DPU SmartNIC Volume K Forecast, by Types 2020 & 2033
- Table 5: Global DPU SmartNIC Revenue million Forecast, by Region 2020 & 2033
- Table 6: Global DPU SmartNIC Volume K Forecast, by Region 2020 & 2033
- Table 7: Global DPU SmartNIC Revenue million Forecast, by Application 2020 & 2033
- Table 8: Global DPU SmartNIC Volume K Forecast, by Application 2020 & 2033
- Table 9: Global DPU SmartNIC Revenue million Forecast, by Types 2020 & 2033
- Table 10: Global DPU SmartNIC Volume K Forecast, by Types 2020 & 2033
- Table 11: Global DPU SmartNIC Revenue million Forecast, by Country 2020 & 2033
- Table 12: Global DPU SmartNIC Volume K Forecast, by Country 2020 & 2033
- Table 13: United States DPU SmartNIC Revenue (million) Forecast, by Application 2020 & 2033
- Table 14: United States DPU SmartNIC Volume (K) Forecast, by Application 2020 & 2033
- Table 15: Canada DPU SmartNIC Revenue (million) Forecast, by Application 2020 & 2033
- Table 16: Canada DPU SmartNIC Volume (K) Forecast, by Application 2020 & 2033
- Table 17: Mexico DPU SmartNIC Revenue (million) Forecast, by Application 2020 & 2033
- Table 18: Mexico DPU SmartNIC Volume (K) Forecast, by Application 2020 & 2033
- Table 19: Global DPU SmartNIC Revenue million Forecast, by Application 2020 & 2033
- Table 20: Global DPU SmartNIC Volume K Forecast, by Application 2020 & 2033
- Table 21: Global DPU SmartNIC Revenue million Forecast, by Types 2020 & 2033
- Table 22: Global DPU SmartNIC Volume K Forecast, by Types 2020 & 2033
- Table 23: Global DPU SmartNIC Revenue million Forecast, by Country 2020 & 2033
- Table 24: Global DPU SmartNIC Volume K Forecast, by Country 2020 & 2033
- Table 25: Brazil DPU SmartNIC Revenue (million) Forecast, by Application 2020 & 2033
- Table 26: Brazil DPU SmartNIC Volume (K) Forecast, by Application 2020 & 2033
- Table 27: Argentina DPU SmartNIC Revenue (million) Forecast, by Application 2020 & 2033
- Table 28: Argentina DPU SmartNIC Volume (K) Forecast, by Application 2020 & 2033
- Table 29: Rest of South America DPU SmartNIC Revenue (million) Forecast, by Application 2020 & 2033
- Table 30: Rest of South America DPU SmartNIC Volume (K) Forecast, by Application 2020 & 2033
- Table 31: Global DPU SmartNIC Revenue million Forecast, by Application 2020 & 2033
- Table 32: Global DPU SmartNIC Volume K Forecast, by Application 2020 & 2033
- Table 33: Global DPU SmartNIC Revenue million Forecast, by Types 2020 & 2033
- Table 34: Global DPU SmartNIC Volume K Forecast, by Types 2020 & 2033
- Table 35: Global DPU SmartNIC Revenue million Forecast, by Country 2020 & 2033
- Table 36: Global DPU SmartNIC Volume K Forecast, by Country 2020 & 2033
- Table 37: United Kingdom DPU SmartNIC Revenue (million) Forecast, by Application 2020 & 2033
- Table 38: United Kingdom DPU SmartNIC Volume (K) Forecast, by Application 2020 & 2033
- Table 39: Germany DPU SmartNIC Revenue (million) Forecast, by Application 2020 & 2033
- Table 40: Germany DPU SmartNIC Volume (K) Forecast, by Application 2020 & 2033
- Table 41: France DPU SmartNIC Revenue (million) Forecast, by Application 2020 & 2033
- Table 42: France DPU SmartNIC Volume (K) Forecast, by Application 2020 & 2033
- Table 43: Italy DPU SmartNIC Revenue (million) Forecast, by Application 2020 & 2033
- Table 44: Italy DPU SmartNIC Volume (K) Forecast, by Application 2020 & 2033
- Table 45: Spain DPU SmartNIC Revenue (million) Forecast, by Application 2020 & 2033
- Table 46: Spain DPU SmartNIC Volume (K) Forecast, by Application 2020 & 2033
- Table 47: Russia DPU SmartNIC Revenue (million) Forecast, by Application 2020 & 2033
- Table 48: Russia DPU SmartNIC Volume (K) Forecast, by Application 2020 & 2033
- Table 49: Benelux DPU SmartNIC Revenue (million) Forecast, by Application 2020 & 2033
- Table 50: Benelux DPU SmartNIC Volume (K) Forecast, by Application 2020 & 2033
- Table 51: Nordics DPU SmartNIC Revenue (million) Forecast, by Application 2020 & 2033
- Table 52: Nordics DPU SmartNIC Volume (K) Forecast, by Application 2020 & 2033
- Table 53: Rest of Europe DPU SmartNIC Revenue (million) Forecast, by Application 2020 & 2033
- Table 54: Rest of Europe DPU SmartNIC Volume (K) Forecast, by Application 2020 & 2033
- Table 55: Global DPU SmartNIC Revenue million Forecast, by Application 2020 & 2033
- Table 56: Global DPU SmartNIC Volume K Forecast, by Application 2020 & 2033
- Table 57: Global DPU SmartNIC Revenue million Forecast, by Types 2020 & 2033
- Table 58: Global DPU SmartNIC Volume K Forecast, by Types 2020 & 2033
- Table 59: Global DPU SmartNIC Revenue million Forecast, by Country 2020 & 2033
- Table 60: Global DPU SmartNIC Volume K Forecast, by Country 2020 & 2033
- Table 61: Turkey DPU SmartNIC Revenue (million) Forecast, by Application 2020 & 2033
- Table 62: Turkey DPU SmartNIC Volume (K) Forecast, by Application 2020 & 2033
- Table 63: Israel DPU SmartNIC Revenue (million) Forecast, by Application 2020 & 2033
- Table 64: Israel DPU SmartNIC Volume (K) Forecast, by Application 2020 & 2033
- Table 65: GCC DPU SmartNIC Revenue (million) Forecast, by Application 2020 & 2033
- Table 66: GCC DPU SmartNIC Volume (K) Forecast, by Application 2020 & 2033
- Table 67: North Africa DPU SmartNIC Revenue (million) Forecast, by Application 2020 & 2033
- Table 68: North Africa DPU SmartNIC Volume (K) Forecast, by Application 2020 & 2033
- Table 69: South Africa DPU SmartNIC Revenue (million) Forecast, by Application 2020 & 2033
- Table 70: South Africa DPU SmartNIC Volume (K) Forecast, by Application 2020 & 2033
- Table 71: Rest of Middle East & Africa DPU SmartNIC Revenue (million) Forecast, by Application 2020 & 2033
- Table 72: Rest of Middle East & Africa DPU SmartNIC Volume (K) Forecast, by Application 2020 & 2033
- Table 73: Global DPU SmartNIC Revenue million Forecast, by Application 2020 & 2033
- Table 74: Global DPU SmartNIC Volume K Forecast, by Application 2020 & 2033
- Table 75: Global DPU SmartNIC Revenue million Forecast, by Types 2020 & 2033
- Table 76: Global DPU SmartNIC Volume K Forecast, by Types 2020 & 2033
- Table 77: Global DPU SmartNIC Revenue million Forecast, by Country 2020 & 2033
- Table 78: Global DPU SmartNIC Volume K Forecast, by Country 2020 & 2033
- Table 79: China DPU SmartNIC Revenue (million) Forecast, by Application 2020 & 2033
- Table 80: China DPU SmartNIC Volume (K) Forecast, by Application 2020 & 2033
- Table 81: India DPU SmartNIC Revenue (million) Forecast, by Application 2020 & 2033
- Table 82: India DPU SmartNIC Volume (K) Forecast, by Application 2020 & 2033
- Table 83: Japan DPU SmartNIC Revenue (million) Forecast, by Application 2020 & 2033
- Table 84: Japan DPU SmartNIC Volume (K) Forecast, by Application 2020 & 2033
- Table 85: South Korea DPU SmartNIC Revenue (million) Forecast, by Application 2020 & 2033
- Table 86: South Korea DPU SmartNIC Volume (K) Forecast, by Application 2020 & 2033
- Table 87: ASEAN DPU SmartNIC Revenue (million) Forecast, by Application 2020 & 2033
- Table 88: ASEAN DPU SmartNIC Volume (K) Forecast, by Application 2020 & 2033
- Table 89: Oceania DPU SmartNIC Revenue (million) Forecast, by Application 2020 & 2033
- Table 90: Oceania DPU SmartNIC Volume (K) Forecast, by Application 2020 & 2033
- Table 91: Rest of Asia Pacific DPU SmartNIC Revenue (million) Forecast, by Application 2020 & 2033
- Table 92: Rest of Asia Pacific DPU SmartNIC Volume (K) Forecast, by Application 2020 & 2033
Frequently Asked Questions
1. What is the projected Compound Annual Growth Rate (CAGR) of the DPU SmartNIC?
The projected CAGR is approximately XX%.
2. Which companies are prominent players in the DPU SmartNIC?
Key companies in the market include Intel, Xilinx (AMD), NVIDIA, Silicom, Broadcom, Napatech, Marvell, BittWare(Molex), Ethernity, Magmio (Netcope), Netronome, Kalray, AWS (Amazon), Cisco, Microsoft, Achronix, Ethernity Networks, Asterfusion Data Technologies, Fungible, Nebulamatrix, Corigine, Yusur, Jaguar Microsystems.
3. What are the main segments of the DPU SmartNIC?
The market segments include Application, Types.
4. Can you provide details about the market size?
The market size is estimated to be USD XXX million as of 2022.
5. What are some drivers contributing to market growth?
N/A
6. What are the notable trends driving market growth?
N/A
7. Are there any restraints impacting market growth?
N/A
8. Can you provide examples of recent developments in the market?
N/A
9. What pricing options are available for accessing the report?
Pricing options include single-user, multi-user, and enterprise licenses priced at USD 4350.00, USD 6525.00, and USD 8700.00 respectively.
10. Is the market size provided in terms of value or volume?
The market size is provided in terms of value, measured in million and volume, measured in K.
11. Are there any specific market keywords associated with the report?
Yes, the market keyword associated with the report is "DPU SmartNIC," which aids in identifying and referencing the specific market segment covered.
12. How do I determine which pricing option suits my needs best?
The pricing options vary based on user requirements and access needs. Individual users may opt for single-user licenses, while businesses requiring broader access may choose multi-user or enterprise licenses for cost-effective access to the report.
13. Are there any additional resources or data provided in the DPU SmartNIC report?
While the report offers comprehensive insights, it's advisable to review the specific contents or supplementary materials provided to ascertain if additional resources or data are available.
14. How can I stay updated on further developments or reports in the DPU SmartNIC?
To stay informed about further developments, trends, and reports in the DPU SmartNIC, consider subscribing to industry newsletters, following relevant companies and organizations, or regularly checking reputable industry news sources and publications.
Methodology
Step 1 - Identification of Relevant Samples Size from Population Database


Step 2 - Approaches for Defining Global Market Size (Value, Volume* & Price*)

Note*: In applicable scenarios
Step 3 - Data Sources
Primary Research
- Web Analytics
- Survey Reports
- Research Institute
- Latest Research Reports
- Opinion Leaders
Secondary Research
- Annual Reports
- White Paper
- Latest Press Release
- Industry Association
- Paid Database
- Investor Presentations

Step 4 - Data Triangulation
Involves using different sources of information in order to increase the validity of a study
These sources are likely to be stakeholders in a program - participants, other researchers, program staff, other community members, and so on.
Then we put all data in single framework & apply various statistical tools to find out the dynamic on the market.
During the analysis stage, feedback from the stakeholder groups would be compared to determine areas of agreement as well as areas of divergence