

Key Insights
The automotive DRAM market is experiencing substantial expansion, propelled by the growing integration of Advanced Driver-Assistance Systems (ADAS) and the increasing adoption of electric vehicles (EVs). Enhanced in-vehicle computing power demands higher memory capacity and faster processing, driving robust demand for DRAM. Autonomous driving functionalities, critically reliant on real-time sensor data processing, mapping, and complex algorithm execution, represent a significant growth catalyst. The rise of connected vehicles further amplifies this need, requiring substantial memory for communication and data exchange. Leading manufacturers are strategically investing in high-performance, automotive-grade DRAM solutions designed for demanding environmental conditions, including elevated temperature tolerance and superior reliability. These investments are poised to accelerate market growth.
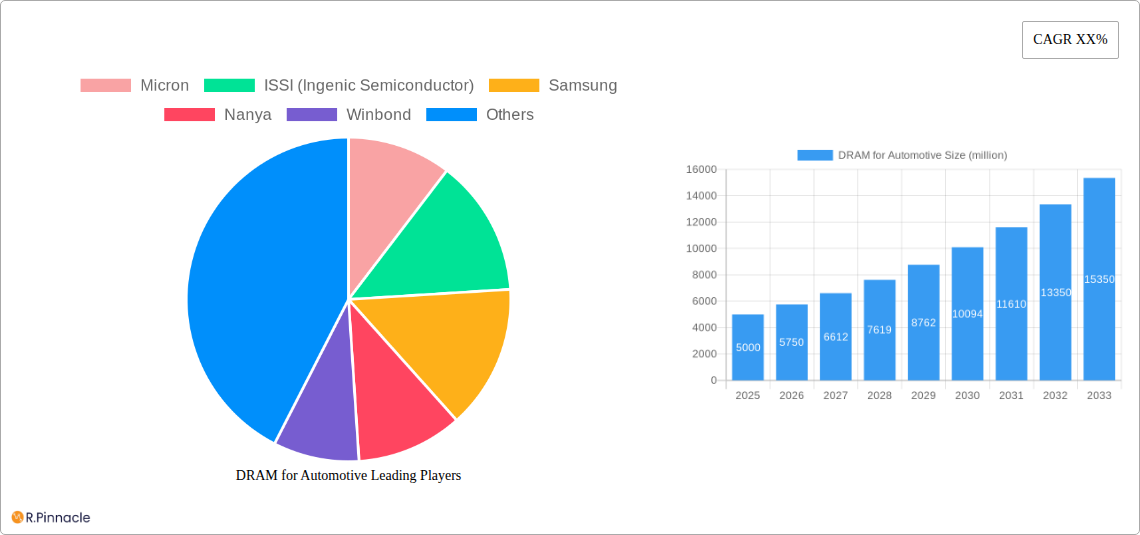
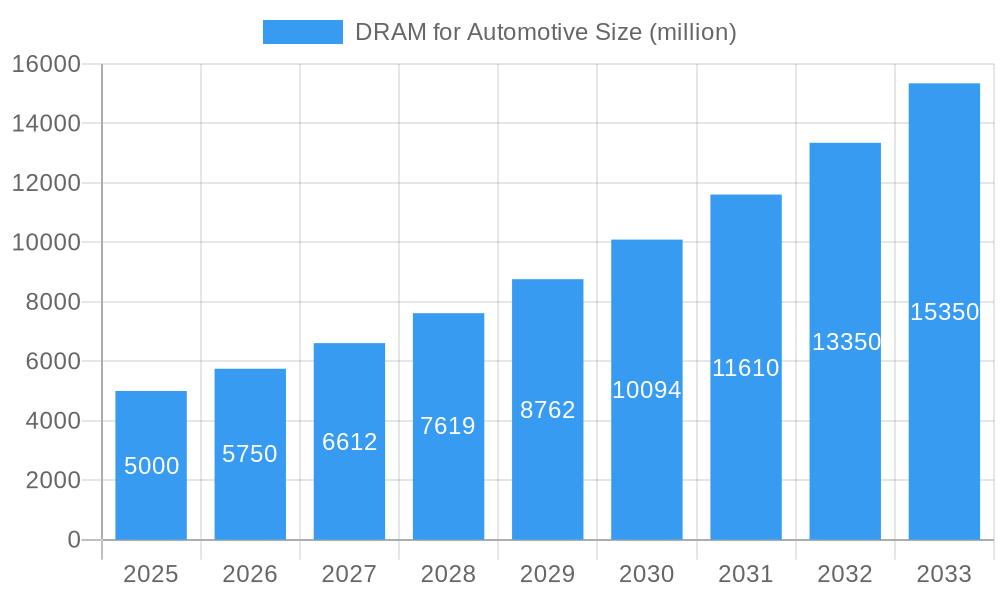
DRAM for Automotive Market Size (In Billion)
The forecast period (2024-2033) indicates sustained growth for the automotive DRAM market. Key drivers include the global shift towards electric mobility, stringent safety regulations promoting ADAS adoption, and the overall proliferation of electronic components in vehicles. Potential challenges include semiconductor industry volatility, supply chain intricacies, and disruptive advancements in alternative memory technologies. Nevertheless, the long-term outlook for automotive DRAM remains highly positive, with consistent expansion anticipated. The estimated market size is projected to reach $103.17 billion by 2033, exhibiting a Compound Annual Growth Rate (CAGR) of 10.57%.
DRAM for Automotive Company Market Share
This comprehensive report offers critical insights into the automotive DRAM market, serving as a valuable resource for industry stakeholders, investors, and strategic planners. The analysis spans from 2019 to 2033, with a specific focus on the forecast period of 2025-2033 and a base year of 2024. The study includes detailed market sizing, segmentation, competitive landscape analysis, and future growth projections.
DRAM for Automotive Market Structure & Innovation Trends
This section analyzes the competitive landscape of the DRAM for Automotive market, examining market concentration, innovation drivers, regulatory frameworks, and mergers and acquisitions (M&A) activity. The market is moderately concentrated, with key players including Micron, ISSI (Ingenic Semiconductor), Samsung, Nanya, Winbond, and SK Hynix holding significant market share.
- Market Concentration: The top 5 players hold approximately xx% of the market share in 2025. This is expected to slightly decrease to xx% by 2033 due to increased competition from smaller players.
- Innovation Drivers: Key drivers include advancements in autonomous driving technologies, increasing demand for in-vehicle infotainment systems, and the proliferation of connected cars.
- Regulatory Frameworks: Government regulations concerning data security and vehicle safety are influencing the adoption of advanced DRAM solutions.
- M&A Activity: The past five years have witnessed several significant M&A deals, valued at approximately xx million USD, largely focused on consolidating technology and expanding market reach. Examples include [Insert Specific Examples of M&A activity if available, otherwise replace with "Strategic partnerships and acquisitions to enhance technological capabilities and market access have been observed"].
- Product Substitutes: While DRAM is the dominant memory technology in automotive applications, other technologies such as flash memory are emerging as potential substitutes. However, the performance and cost-effectiveness of DRAM maintain its lead in certain segments.
DRAM for Automotive Market Dynamics & Trends
This section delves into the market's dynamic growth factors, technological disruptions, and competitive dynamics. The market is projected to experience significant growth, driven by factors such as the increasing adoption of advanced driver-assistance systems (ADAS), the rising demand for high-performance computing in vehicles, and the expansion of the global automotive industry.
The Compound Annual Growth Rate (CAGR) is estimated at xx% during the forecast period (2025-2033). Market penetration in the automotive sector continues to increase, driven by technological advancements. The shift towards electric vehicles (EVs) and autonomous vehicles (AVs) significantly impacts DRAM demand, requiring higher memory capacities and faster data processing speeds. Competitive dynamics are shaped by pricing strategies, technological innovation, and strategic partnerships. Specific metrics including market penetration will vary by specific segments (such as vehicle class, region, and feature) and will be detailed within the full report.
Dominant Regions & Segments in DRAM for Automotive
This section identifies the leading regions and segments within the DRAM for Automotive market. [Insert leading region, country, or segment details].
- Key Drivers:
- Economic Policies: Government incentives and subsidies for electric and autonomous vehicles are driving adoption.
- Infrastructure Development: Investments in smart city infrastructure and improved road networks are increasing demand for connected car technologies.
- Technological Advancements: [Insert details specific to the leading region/segment].
- Dominance Analysis: [Provide a detailed paragraph explaining why the identified region/segment is dominant, citing specific factors such as market size, technological maturity, and regulatory environment]
DRAM for Automotive Product Innovations
Recent years have witnessed significant advancements in DRAM technology for automotive applications. This includes the development of high-bandwidth, low-power, and high-reliability DRAM chips optimized for the demanding environments of automobiles. These innovations cater to the increasing need for faster data processing speeds, enhanced safety features, and improved in-vehicle infotainment systems. Key technological trends include the adoption of advanced packaging technologies and the development of specialized DRAM solutions to address the specific requirements of ADAS, infotainment, and connectivity applications. The market fit is excellent due to the increasing demand for advanced functionalities in automobiles.
Report Scope & Segmentation Analysis
This report segments the DRAM for Automotive market based on several key parameters, providing a comprehensive analysis of each segment's growth potential and competitive landscape. These parameters include vehicle type (passenger cars, commercial vehicles), memory type (DDR3, DDR4, LPDDR4X, GDDR6), application (ADAS, infotainment, telematics), and region (North America, Europe, Asia Pacific, etc.). Each segment’s growth projections and market sizes are discussed in detail within the complete report.
Key Drivers of DRAM for Automotive Growth
The growth of the DRAM for Automotive market is propelled by several key factors. The increasing adoption of advanced driver-assistance systems (ADAS) is a significant driver, along with the rising demand for high-performance computing in vehicles. The transition toward electric vehicles (EVs) and autonomous vehicles (AVs) also significantly fuels market expansion by driving demand for high-capacity, low-latency memory solutions. Furthermore, supportive government policies and regulations related to vehicle safety and connectivity contribute to market growth.
Challenges in the DRAM for Automotive Sector
Several challenges hinder the growth of the DRAM for Automotive sector. Supply chain disruptions, particularly those related to semiconductor components, present significant risks and could cause shortages. This is exacerbated by geopolitical factors. Furthermore, intense competition among DRAM manufacturers can lead to price wars and pressure on profit margins. Meeting stringent quality and reliability standards in the automotive industry requires significant investments in testing and certification, further increasing production costs. Regulatory hurdles for specific components and technological standards pose significant obstacles.
Emerging Opportunities in DRAM for Automotive
Emerging opportunities are abundant in the DRAM for Automotive market. The rising popularity of connected cars and the integration of advanced infotainment systems present significant growth opportunities. The development and adoption of new memory technologies with even greater performance and efficiency levels, such as DDR5 and future generations of LPDDR, promises significant growth potential. Expansion into emerging markets with growing automobile production is another key opportunity.
Key Developments in DRAM for Automotive Industry
- [Month, Year]: [Company Name] launched a new high-bandwidth DRAM solution for automotive applications. This development improved in-vehicle infotainment systems and increased processing power.
- [Month, Year]: A strategic partnership was formed between [Company A] and [Company B] to co-develop advanced DRAM technology for autonomous vehicles.
- [Month, Year]: [Regulatory body] introduced new safety standards for automotive electronics, impacting the adoption of advanced DRAM technologies. [Add more bullet points as necessary with specific data and impact].
Future Outlook for DRAM for Automotive Market
The DRAM for Automotive market is poised for continued growth in the coming years. The increasing adoption of autonomous driving technologies, enhanced safety features, and advanced connectivity solutions will drive demand for higher-capacity and higher-performance DRAM. Strategic partnerships and investments in research and development will further shape market dynamics. The market is expected to grow steadily due to these factors and technological innovations.
DRAM for Automotive Segmentation
-
1. Application
- 1.1. Cockpit System
- 1.2. Smart Driving
- 1.3. Others
-
2. Types
- 2.1. LPDDR4/LPDDR4X
- 2.2. LPDDR5
- 2.3. Others
DRAM for Automotive Segmentation By Geography
-
1. North America
- 1.1. United States
- 1.2. Canada
- 1.3. Mexico
-
2. South America
- 2.1. Brazil
- 2.2. Argentina
- 2.3. Rest of South America
-
3. Europe
- 3.1. United Kingdom
- 3.2. Germany
- 3.3. France
- 3.4. Italy
- 3.5. Spain
- 3.6. Russia
- 3.7. Benelux
- 3.8. Nordics
- 3.9. Rest of Europe
-
4. Middle East & Africa
- 4.1. Turkey
- 4.2. Israel
- 4.3. GCC
- 4.4. North Africa
- 4.5. South Africa
- 4.6. Rest of Middle East & Africa
-
5. Asia Pacific
- 5.1. China
- 5.2. India
- 5.3. Japan
- 5.4. South Korea
- 5.5. ASEAN
- 5.6. Oceania
- 5.7. Rest of Asia Pacific
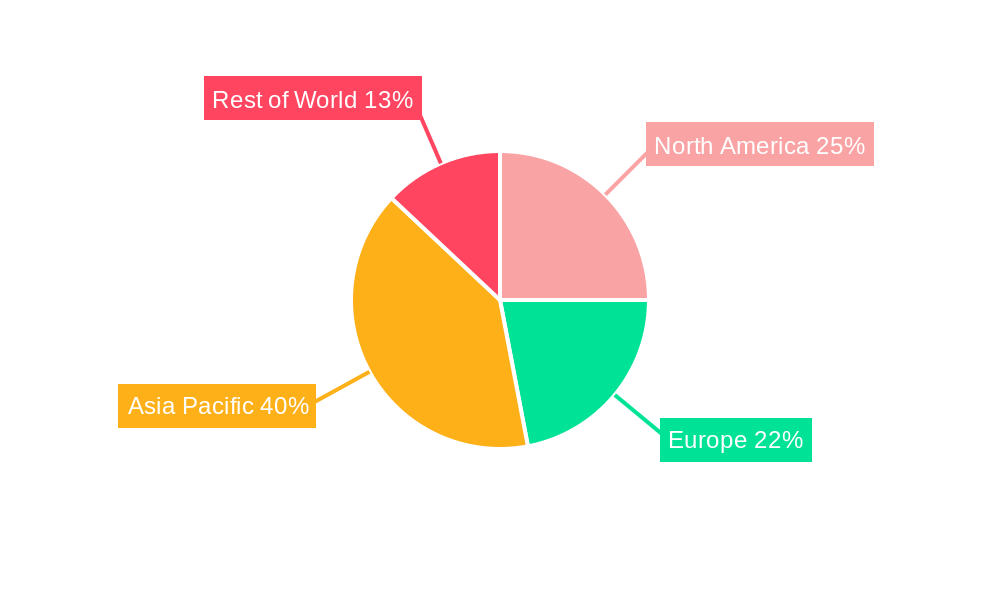
DRAM for Automotive Regional Market Share
Geographic Coverage of DRAM for Automotive
DRAM for Automotive REPORT HIGHLIGHTS
| Aspects | Details |
|---|---|
| Study Period | 2020-2034 |
| Base Year | 2025 |
| Estimated Year | 2026 |
| Forecast Period | 2026-2034 |
| Historical Period | 2020-2025 |
| Growth Rate | CAGR of 10.57% from 2020-2034 |
| Segmentation |
|
Table of Contents
- 1. Introduction
- 1.1. Research Scope
- 1.2. Market Segmentation
- 1.3. Research Methodology
- 1.4. Definitions and Assumptions
- 2. Executive Summary
- 2.1. Introduction
- 3. Market Dynamics
- 3.1. Introduction
- 3.2. Market Drivers
- 3.3. Market Restrains
- 3.4. Market Trends
- 4. Market Factor Analysis
- 4.1. Porters Five Forces
- 4.2. Supply/Value Chain
- 4.3. PESTEL analysis
- 4.4. Market Entropy
- 4.5. Patent/Trademark Analysis
- 5. Global DRAM for Automotive Analysis, Insights and Forecast, 2020-2032
- 5.1. Market Analysis, Insights and Forecast - by Application
- 5.1.1. Cockpit System
- 5.1.2. Smart Driving
- 5.1.3. Others
- 5.2. Market Analysis, Insights and Forecast - by Types
- 5.2.1. LPDDR4/LPDDR4X
- 5.2.2. LPDDR5
- 5.2.3. Others
- 5.3. Market Analysis, Insights and Forecast - by Region
- 5.3.1. North America
- 5.3.2. South America
- 5.3.3. Europe
- 5.3.4. Middle East & Africa
- 5.3.5. Asia Pacific
- 5.1. Market Analysis, Insights and Forecast - by Application
- 6. North America DRAM for Automotive Analysis, Insights and Forecast, 2020-2032
- 6.1. Market Analysis, Insights and Forecast - by Application
- 6.1.1. Cockpit System
- 6.1.2. Smart Driving
- 6.1.3. Others
- 6.2. Market Analysis, Insights and Forecast - by Types
- 6.2.1. LPDDR4/LPDDR4X
- 6.2.2. LPDDR5
- 6.2.3. Others
- 6.1. Market Analysis, Insights and Forecast - by Application
- 7. South America DRAM for Automotive Analysis, Insights and Forecast, 2020-2032
- 7.1. Market Analysis, Insights and Forecast - by Application
- 7.1.1. Cockpit System
- 7.1.2. Smart Driving
- 7.1.3. Others
- 7.2. Market Analysis, Insights and Forecast - by Types
- 7.2.1. LPDDR4/LPDDR4X
- 7.2.2. LPDDR5
- 7.2.3. Others
- 7.1. Market Analysis, Insights and Forecast - by Application
- 8. Europe DRAM for Automotive Analysis, Insights and Forecast, 2020-2032
- 8.1. Market Analysis, Insights and Forecast - by Application
- 8.1.1. Cockpit System
- 8.1.2. Smart Driving
- 8.1.3. Others
- 8.2. Market Analysis, Insights and Forecast - by Types
- 8.2.1. LPDDR4/LPDDR4X
- 8.2.2. LPDDR5
- 8.2.3. Others
- 8.1. Market Analysis, Insights and Forecast - by Application
- 9. Middle East & Africa DRAM for Automotive Analysis, Insights and Forecast, 2020-2032
- 9.1. Market Analysis, Insights and Forecast - by Application
- 9.1.1. Cockpit System
- 9.1.2. Smart Driving
- 9.1.3. Others
- 9.2. Market Analysis, Insights and Forecast - by Types
- 9.2.1. LPDDR4/LPDDR4X
- 9.2.2. LPDDR5
- 9.2.3. Others
- 9.1. Market Analysis, Insights and Forecast - by Application
- 10. Asia Pacific DRAM for Automotive Analysis, Insights and Forecast, 2020-2032
- 10.1. Market Analysis, Insights and Forecast - by Application
- 10.1.1. Cockpit System
- 10.1.2. Smart Driving
- 10.1.3. Others
- 10.2. Market Analysis, Insights and Forecast - by Types
- 10.2.1. LPDDR4/LPDDR4X
- 10.2.2. LPDDR5
- 10.2.3. Others
- 10.1. Market Analysis, Insights and Forecast - by Application
- 11. Competitive Analysis
- 11.1. Global Market Share Analysis 2025
- 11.2. Company Profiles
- 11.2.1 Micron
- 11.2.1.1. Overview
- 11.2.1.2. Products
- 11.2.1.3. SWOT Analysis
- 11.2.1.4. Recent Developments
- 11.2.1.5. Financials (Based on Availability)
- 11.2.2 ISSI (Ingenic Semiconductor)
- 11.2.2.1. Overview
- 11.2.2.2. Products
- 11.2.2.3. SWOT Analysis
- 11.2.2.4. Recent Developments
- 11.2.2.5. Financials (Based on Availability)
- 11.2.3 Samsung
- 11.2.3.1. Overview
- 11.2.3.2. Products
- 11.2.3.3. SWOT Analysis
- 11.2.3.4. Recent Developments
- 11.2.3.5. Financials (Based on Availability)
- 11.2.4 Nanya
- 11.2.4.1. Overview
- 11.2.4.2. Products
- 11.2.4.3. SWOT Analysis
- 11.2.4.4. Recent Developments
- 11.2.4.5. Financials (Based on Availability)
- 11.2.5 Winbond
- 11.2.5.1. Overview
- 11.2.5.2. Products
- 11.2.5.3. SWOT Analysis
- 11.2.5.4. Recent Developments
- 11.2.5.5. Financials (Based on Availability)
- 11.2.6 SK Hynix
- 11.2.6.1. Overview
- 11.2.6.2. Products
- 11.2.6.3. SWOT Analysis
- 11.2.6.4. Recent Developments
- 11.2.6.5. Financials (Based on Availability)
- 11.2.1 Micron
List of Figures
- Figure 1: Global DRAM for Automotive Revenue Breakdown (billion, %) by Region 2025 & 2033
- Figure 2: North America DRAM for Automotive Revenue (billion), by Application 2025 & 2033
- Figure 3: North America DRAM for Automotive Revenue Share (%), by Application 2025 & 2033
- Figure 4: North America DRAM for Automotive Revenue (billion), by Types 2025 & 2033
- Figure 5: North America DRAM for Automotive Revenue Share (%), by Types 2025 & 2033
- Figure 6: North America DRAM for Automotive Revenue (billion), by Country 2025 & 2033
- Figure 7: North America DRAM for Automotive Revenue Share (%), by Country 2025 & 2033
- Figure 8: South America DRAM for Automotive Revenue (billion), by Application 2025 & 2033
- Figure 9: South America DRAM for Automotive Revenue Share (%), by Application 2025 & 2033
- Figure 10: South America DRAM for Automotive Revenue (billion), by Types 2025 & 2033
- Figure 11: South America DRAM for Automotive Revenue Share (%), by Types 2025 & 2033
- Figure 12: South America DRAM for Automotive Revenue (billion), by Country 2025 & 2033
- Figure 13: South America DRAM for Automotive Revenue Share (%), by Country 2025 & 2033
- Figure 14: Europe DRAM for Automotive Revenue (billion), by Application 2025 & 2033
- Figure 15: Europe DRAM for Automotive Revenue Share (%), by Application 2025 & 2033
- Figure 16: Europe DRAM for Automotive Revenue (billion), by Types 2025 & 2033
- Figure 17: Europe DRAM for Automotive Revenue Share (%), by Types 2025 & 2033
- Figure 18: Europe DRAM for Automotive Revenue (billion), by Country 2025 & 2033
- Figure 19: Europe DRAM for Automotive Revenue Share (%), by Country 2025 & 2033
- Figure 20: Middle East & Africa DRAM for Automotive Revenue (billion), by Application 2025 & 2033
- Figure 21: Middle East & Africa DRAM for Automotive Revenue Share (%), by Application 2025 & 2033
- Figure 22: Middle East & Africa DRAM for Automotive Revenue (billion), by Types 2025 & 2033
- Figure 23: Middle East & Africa DRAM for Automotive Revenue Share (%), by Types 2025 & 2033
- Figure 24: Middle East & Africa DRAM for Automotive Revenue (billion), by Country 2025 & 2033
- Figure 25: Middle East & Africa DRAM for Automotive Revenue Share (%), by Country 2025 & 2033
- Figure 26: Asia Pacific DRAM for Automotive Revenue (billion), by Application 2025 & 2033
- Figure 27: Asia Pacific DRAM for Automotive Revenue Share (%), by Application 2025 & 2033
- Figure 28: Asia Pacific DRAM for Automotive Revenue (billion), by Types 2025 & 2033
- Figure 29: Asia Pacific DRAM for Automotive Revenue Share (%), by Types 2025 & 2033
- Figure 30: Asia Pacific DRAM for Automotive Revenue (billion), by Country 2025 & 2033
- Figure 31: Asia Pacific DRAM for Automotive Revenue Share (%), by Country 2025 & 2033
List of Tables
- Table 1: Global DRAM for Automotive Revenue billion Forecast, by Application 2020 & 2033
- Table 2: Global DRAM for Automotive Revenue billion Forecast, by Types 2020 & 2033
- Table 3: Global DRAM for Automotive Revenue billion Forecast, by Region 2020 & 2033
- Table 4: Global DRAM for Automotive Revenue billion Forecast, by Application 2020 & 2033
- Table 5: Global DRAM for Automotive Revenue billion Forecast, by Types 2020 & 2033
- Table 6: Global DRAM for Automotive Revenue billion Forecast, by Country 2020 & 2033
- Table 7: United States DRAM for Automotive Revenue (billion) Forecast, by Application 2020 & 2033
- Table 8: Canada DRAM for Automotive Revenue (billion) Forecast, by Application 2020 & 2033
- Table 9: Mexico DRAM for Automotive Revenue (billion) Forecast, by Application 2020 & 2033
- Table 10: Global DRAM for Automotive Revenue billion Forecast, by Application 2020 & 2033
- Table 11: Global DRAM for Automotive Revenue billion Forecast, by Types 2020 & 2033
- Table 12: Global DRAM for Automotive Revenue billion Forecast, by Country 2020 & 2033
- Table 13: Brazil DRAM for Automotive Revenue (billion) Forecast, by Application 2020 & 2033
- Table 14: Argentina DRAM for Automotive Revenue (billion) Forecast, by Application 2020 & 2033
- Table 15: Rest of South America DRAM for Automotive Revenue (billion) Forecast, by Application 2020 & 2033
- Table 16: Global DRAM for Automotive Revenue billion Forecast, by Application 2020 & 2033
- Table 17: Global DRAM for Automotive Revenue billion Forecast, by Types 2020 & 2033
- Table 18: Global DRAM for Automotive Revenue billion Forecast, by Country 2020 & 2033
- Table 19: United Kingdom DRAM for Automotive Revenue (billion) Forecast, by Application 2020 & 2033
- Table 20: Germany DRAM for Automotive Revenue (billion) Forecast, by Application 2020 & 2033
- Table 21: France DRAM for Automotive Revenue (billion) Forecast, by Application 2020 & 2033
- Table 22: Italy DRAM for Automotive Revenue (billion) Forecast, by Application 2020 & 2033
- Table 23: Spain DRAM for Automotive Revenue (billion) Forecast, by Application 2020 & 2033
- Table 24: Russia DRAM for Automotive Revenue (billion) Forecast, by Application 2020 & 2033
- Table 25: Benelux DRAM for Automotive Revenue (billion) Forecast, by Application 2020 & 2033
- Table 26: Nordics DRAM for Automotive Revenue (billion) Forecast, by Application 2020 & 2033
- Table 27: Rest of Europe DRAM for Automotive Revenue (billion) Forecast, by Application 2020 & 2033
- Table 28: Global DRAM for Automotive Revenue billion Forecast, by Application 2020 & 2033
- Table 29: Global DRAM for Automotive Revenue billion Forecast, by Types 2020 & 2033
- Table 30: Global DRAM for Automotive Revenue billion Forecast, by Country 2020 & 2033
- Table 31: Turkey DRAM for Automotive Revenue (billion) Forecast, by Application 2020 & 2033
- Table 32: Israel DRAM for Automotive Revenue (billion) Forecast, by Application 2020 & 2033
- Table 33: GCC DRAM for Automotive Revenue (billion) Forecast, by Application 2020 & 2033
- Table 34: North Africa DRAM for Automotive Revenue (billion) Forecast, by Application 2020 & 2033
- Table 35: South Africa DRAM for Automotive Revenue (billion) Forecast, by Application 2020 & 2033
- Table 36: Rest of Middle East & Africa DRAM for Automotive Revenue (billion) Forecast, by Application 2020 & 2033
- Table 37: Global DRAM for Automotive Revenue billion Forecast, by Application 2020 & 2033
- Table 38: Global DRAM for Automotive Revenue billion Forecast, by Types 2020 & 2033
- Table 39: Global DRAM for Automotive Revenue billion Forecast, by Country 2020 & 2033
- Table 40: China DRAM for Automotive Revenue (billion) Forecast, by Application 2020 & 2033
- Table 41: India DRAM for Automotive Revenue (billion) Forecast, by Application 2020 & 2033
- Table 42: Japan DRAM for Automotive Revenue (billion) Forecast, by Application 2020 & 2033
- Table 43: South Korea DRAM for Automotive Revenue (billion) Forecast, by Application 2020 & 2033
- Table 44: ASEAN DRAM for Automotive Revenue (billion) Forecast, by Application 2020 & 2033
- Table 45: Oceania DRAM for Automotive Revenue (billion) Forecast, by Application 2020 & 2033
- Table 46: Rest of Asia Pacific DRAM for Automotive Revenue (billion) Forecast, by Application 2020 & 2033
Frequently Asked Questions
1. What is the projected Compound Annual Growth Rate (CAGR) of the DRAM for Automotive?
The projected CAGR is approximately 10.57%.
2. Which companies are prominent players in the DRAM for Automotive?
Key companies in the market include Micron, ISSI (Ingenic Semiconductor), Samsung, Nanya, Winbond, SK Hynix.
3. What are the main segments of the DRAM for Automotive?
The market segments include Application, Types.
4. Can you provide details about the market size?
The market size is estimated to be USD 103.17 billion as of 2022.
5. What are some drivers contributing to market growth?
N/A
6. What are the notable trends driving market growth?
N/A
7. Are there any restraints impacting market growth?
N/A
8. Can you provide examples of recent developments in the market?
N/A
9. What pricing options are available for accessing the report?
Pricing options include single-user, multi-user, and enterprise licenses priced at USD 2900.00, USD 4350.00, and USD 5800.00 respectively.
10. Is the market size provided in terms of value or volume?
The market size is provided in terms of value, measured in billion.
11. Are there any specific market keywords associated with the report?
Yes, the market keyword associated with the report is "DRAM for Automotive," which aids in identifying and referencing the specific market segment covered.
12. How do I determine which pricing option suits my needs best?
The pricing options vary based on user requirements and access needs. Individual users may opt for single-user licenses, while businesses requiring broader access may choose multi-user or enterprise licenses for cost-effective access to the report.
13. Are there any additional resources or data provided in the DRAM for Automotive report?
While the report offers comprehensive insights, it's advisable to review the specific contents or supplementary materials provided to ascertain if additional resources or data are available.
14. How can I stay updated on further developments or reports in the DRAM for Automotive?
To stay informed about further developments, trends, and reports in the DRAM for Automotive, consider subscribing to industry newsletters, following relevant companies and organizations, or regularly checking reputable industry news sources and publications.
Methodology
Step 1 - Identification of Relevant Samples Size from Population Database


Step 2 - Approaches for Defining Global Market Size (Value, Volume* & Price*)

Note*: In applicable scenarios
Step 3 - Data Sources
Primary Research
- Web Analytics
- Survey Reports
- Research Institute
- Latest Research Reports
- Opinion Leaders
Secondary Research
- Annual Reports
- White Paper
- Latest Press Release
- Industry Association
- Paid Database
- Investor Presentations

Step 4 - Data Triangulation
Involves using different sources of information in order to increase the validity of a study
These sources are likely to be stakeholders in a program - participants, other researchers, program staff, other community members, and so on.
Then we put all data in single framework & apply various statistical tools to find out the dynamic on the market.
During the analysis stage, feedback from the stakeholder groups would be compared to determine areas of agreement as well as areas of divergence