

Key Insights
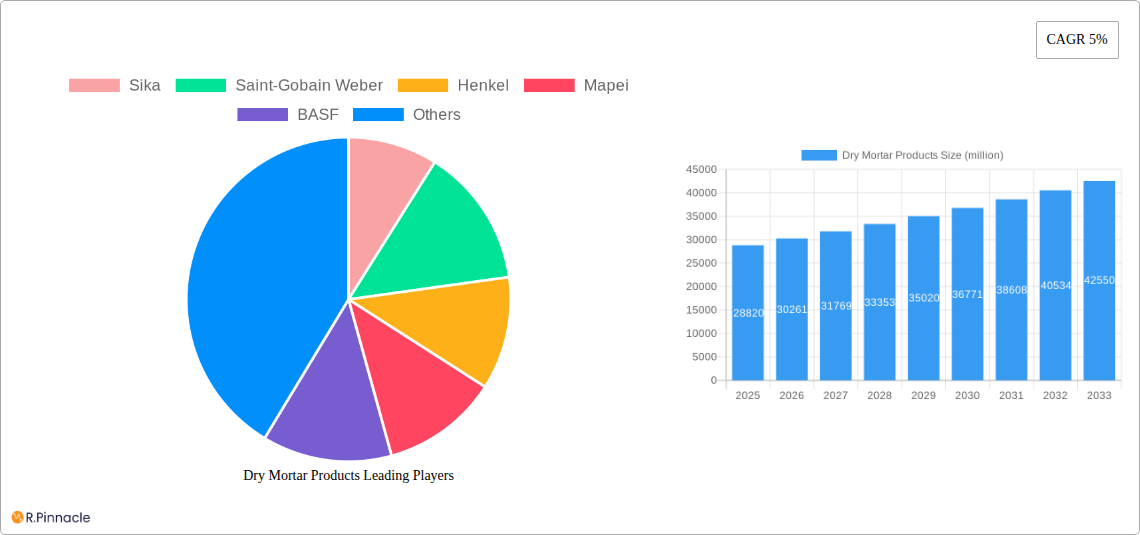
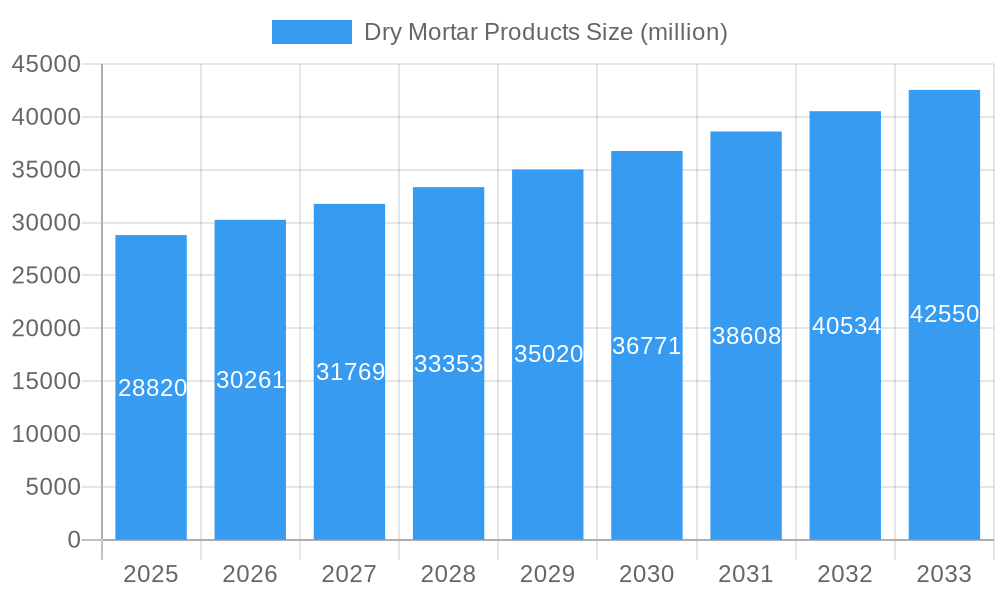
The global dry mortar market, valued at $28.82 billion in 2025, is projected to experience steady growth, driven by the robust construction and home renovation sectors worldwide. A compound annual growth rate (CAGR) of 5% is anticipated from 2025 to 2033, indicating a substantial market expansion. Key drivers include the increasing urbanization and infrastructure development globally, coupled with a rising preference for eco-friendly and high-performance building materials. The growing demand for energy-efficient buildings and the rising adoption of prefabricated construction methods further fuel market growth. The market is segmented by application (construction, home decoration, others) and type (decoration mortar, adhesive mortar, others). The construction segment currently dominates, fueled by large-scale infrastructure projects and residential building booms in developing economies. However, the home decoration segment is expected to witness significant growth due to increasing disposable incomes and rising home improvement activities in developed nations. Competitive rivalry among leading players such as Sika, Saint-Gobain Weber, Henkel, and Mapei, among others, is driving innovation and product differentiation. This includes the development of specialized mortars catering to specific applications and environmental concerns. Despite strong growth prospects, the market faces certain restraints, such as fluctuating raw material prices and stringent environmental regulations. However, technological advancements and sustainable manufacturing practices are mitigating these challenges.
Dry Mortar Products Market Size (In Billion)
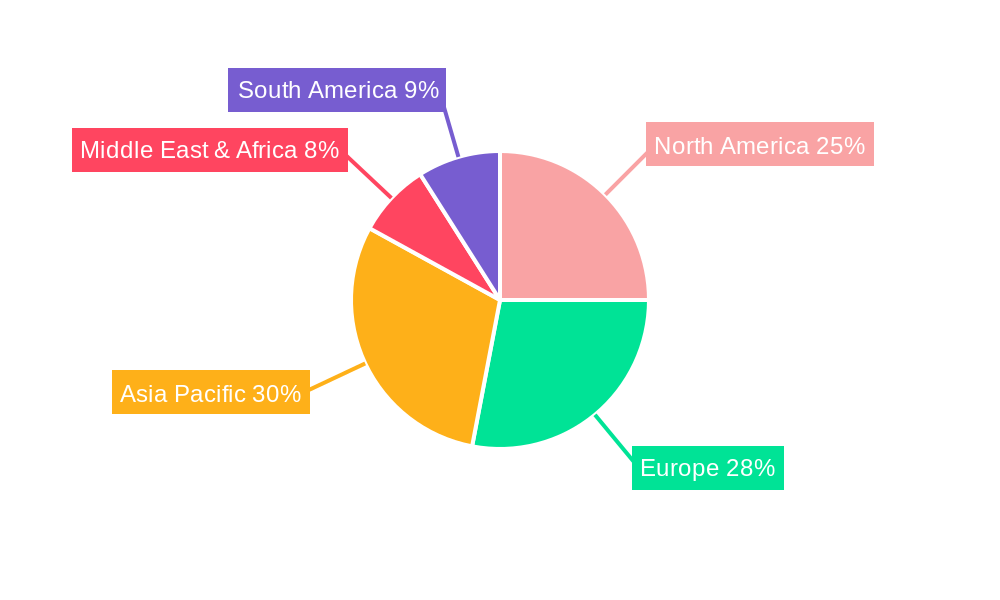
The regional distribution of the dry mortar market reflects global construction activity patterns. North America and Europe currently hold significant market shares, reflecting mature construction industries. However, rapid economic growth and urbanization in Asia-Pacific (specifically China and India) are anticipated to drive substantial market expansion in this region over the forecast period. The Middle East and Africa also present promising growth opportunities due to ongoing infrastructure development initiatives. Furthermore, the increasing adoption of advanced construction techniques and a shift toward sustainable building practices will shape the market dynamics in the coming years. The continuous innovation in dry mortar technology, focusing on improved performance, durability, and ease of application, will contribute to the overall market growth.
Dry Mortar Products Company Market Share
Dry Mortar Products Market Report: 2019-2033
This comprehensive report provides a detailed analysis of the global dry mortar products market, offering invaluable insights for industry professionals, investors, and strategic decision-makers. Covering the period from 2019 to 2033, with a focus on the estimated year 2025, this report unveils the market's structure, dynamics, and future trajectory. We project a xx million market value by 2033, driven by key trends and innovations analyzed within.
Dry Mortar Products Market Structure & Innovation Trends
The global dry mortar products market is characterized by a moderately concentrated landscape with key players holding significant market share. Sika, Saint-Gobain Weber, and Mapei are amongst the leading companies, collectively commanding an estimated xx% market share in 2025. The market exhibits considerable innovation, driven by the need for sustainable, high-performance materials and advancements in formulation technology. Stringent environmental regulations are pushing for reduced carbon footprint products, while increasing construction activity globally fuels demand. Significant M&A activity has been observed in the recent past, with deal values exceeding xx million in the period 2019-2024. This consolidation is shaping the competitive landscape and driving innovation. Product substitutes, such as specialized concrete mixes, pose a mild challenge. End-user demographics heavily favor large-scale construction projects, with growing demand from infrastructure development.
- Market Concentration: Highly concentrated with top players holding xx% market share (2025).
- Innovation Drivers: Sustainability regulations, technological advancements in formulations.
- Regulatory Framework: Stringent environmental and building codes drive innovation.
- M&A Activity: Deal values exceeding xx million (2019-2024), driving market consolidation.
Dry Mortar Products Market Dynamics & Trends
The global dry mortar products market is experiencing robust growth, with a projected Compound Annual Growth Rate (CAGR) of xx% during the forecast period (2025-2033). Several factors contribute to this growth, including rising construction activity globally, particularly in developing economies with expanding infrastructure projects. The increasing adoption of prefabricated construction methods also boosts demand. Technological disruptions, such as the introduction of self-leveling mortars and high-performance adhesives, are reshaping the market, enhancing efficiency and product quality. Consumer preferences are shifting towards eco-friendly, easy-to-use, and high-performance products. Competitive dynamics are intense, with major players focusing on product differentiation, strategic partnerships, and geographical expansion. Market penetration in developing regions presents substantial opportunities for growth.
Dominant Regions & Segments in Dry Mortar Products
The Asia-Pacific region is projected to dominate the dry mortar products market during the forecast period, driven by rapid urbanization, robust infrastructure development, and increasing construction activity. Within applications, the Construction segment leads the market, representing xx% of total value in 2025. Similarly, Adhesive Mortars represent a significant share (xx%) of the type segment.
- Key Drivers for Asia-Pacific Dominance:
- Rapid urbanization and infrastructure development.
- Strong economic growth and increased construction investment.
- Favorable government policies supporting infrastructure projects.
- Construction Segment Dominance: Driven by large-scale infrastructure projects and building constructions.
- Adhesive Mortar Segment Dominance: Driven by increased use in various construction and home decoration applications.
Dry Mortar Products Product Innovations
Recent product innovations focus on improving performance characteristics, such as enhanced bonding strength, increased water resistance, and improved workability. The use of sustainable materials and eco-friendly manufacturing processes is gaining traction. These innovations cater to the rising demand for sustainable and high-performance building materials, enhancing market competitiveness. Technological advancements in formulation technology are leading to specialized mortars for specific applications, further expanding the market.
Report Scope & Segmentation Analysis
This report segments the dry mortar products market by application (Construction, Home Decoration, Others) and type (Decoration Mortar, Adhesive Mortar, Others). Each segment is analyzed for market size, growth projections, and competitive dynamics. The construction segment is projected to hold the largest share throughout the forecast period due to ongoing infrastructure projects. The home decoration segment shows steady growth, driven by rising disposable incomes and home improvement activities. The Adhesive Mortar type is projected to dominate owing to its versatile applications in diverse construction needs.
Key Drivers of Dry Mortar Products Growth
The dry mortar products market is experiencing significant growth due to several factors, including rapid urbanization and increasing infrastructure development globally. Government initiatives promoting construction and housing projects are fueling demand. Technological advancements in mortar formulations, leading to improved performance and sustainability, are also major drivers. Favorable economic conditions in several regions further stimulate market expansion.
Challenges in the Dry Mortar Products Sector
The industry faces challenges such as fluctuations in raw material prices, impacting production costs and profitability. Stringent environmental regulations and sustainability concerns pose further challenges, requiring companies to invest in eco-friendly technologies. Intense competition and the need for continuous innovation are also significant obstacles. The overall impact of these challenges results in an estimated xx million annual loss in revenue for the industry in 2025.
Emerging Opportunities in Dry Mortar Products
Growing demand for sustainable and high-performance building materials presents substantial opportunities. The increasing adoption of prefabricated construction methods opens avenues for specialized mortars. Expansion into emerging markets with high growth potential, such as Africa and Southeast Asia, offers significant opportunities. Technological advancements, such as the use of nanomaterials and smart mortars, provide new avenues for innovation.
Key Developments in Dry Mortar Products Industry
- 2022-Q4: Sika launched a new sustainable dry mortar line.
- 2023-Q1: Saint-Gobain Weber acquired a smaller competitor in the European market.
- 2023-Q2: Mapei introduced a new high-performance adhesive mortar.
- 2024-Q3: BASF invested in research and development of eco-friendly mortar formulations. (Further details regarding specific developments would be added in the full report).
Future Outlook for Dry Mortar Products Market
The future of the dry mortar products market looks promising, with continued growth driven by factors like urbanization, infrastructure development, and technological advancements. The focus on sustainability and eco-friendly solutions will shape product development. Strategic partnerships and mergers & acquisitions will further consolidate the market. Companies focusing on innovation, sustainable practices, and market expansion in emerging economies are poised for strong growth.
Dry Mortar Products Segmentation
-
1. Application
- 1.1. Construction
- 1.2. Home Decoration
- 1.3. Others
-
2. Types
- 2.1. Decoration Mortar
- 2.2. Adhesive Mortar
- 2.3. Others
Dry Mortar Products Segmentation By Geography
-
1. North America
- 1.1. United States
- 1.2. Canada
- 1.3. Mexico
-
2. South America
- 2.1. Brazil
- 2.2. Argentina
- 2.3. Rest of South America
-
3. Europe
- 3.1. United Kingdom
- 3.2. Germany
- 3.3. France
- 3.4. Italy
- 3.5. Spain
- 3.6. Russia
- 3.7. Benelux
- 3.8. Nordics
- 3.9. Rest of Europe
-
4. Middle East & Africa
- 4.1. Turkey
- 4.2. Israel
- 4.3. GCC
- 4.4. North Africa
- 4.5. South Africa
- 4.6. Rest of Middle East & Africa
-
5. Asia Pacific
- 5.1. China
- 5.2. India
- 5.3. Japan
- 5.4. South Korea
- 5.5. ASEAN
- 5.6. Oceania
- 5.7. Rest of Asia Pacific
Dry Mortar Products Regional Market Share
Geographic Coverage of Dry Mortar Products
Dry Mortar Products REPORT HIGHLIGHTS
| Aspects | Details |
|---|---|
| Study Period | 2020-2034 |
| Base Year | 2025 |
| Estimated Year | 2026 |
| Forecast Period | 2026-2034 |
| Historical Period | 2020-2025 |
| Growth Rate | CAGR of 5% from 2020-2034 |
| Segmentation |
|
Table of Contents
- 1. Introduction
- 1.1. Research Scope
- 1.2. Market Segmentation
- 1.3. Research Objective
- 1.4. Definitions and Assumptions
- 2. Executive Summary
- 2.1. Market Snapshot
- 3. Market Dynamics
- 3.1. Market Drivers
- 3.2. Market Restrains
- 3.3. Market Trends
- 3.4. Market Opportunities
- 4. Market Factor Analysis
- 4.1. Porters Five Forces
- 4.1.1. Bargaining Power of Suppliers
- 4.1.2. Bargaining Power of Buyers
- 4.1.3. Threat of New Entrants
- 4.1.4. Threat of Substitutes
- 4.1.5. Competitive Rivalry
- 4.2. PESTEL analysis
- 4.3. BCG Analysis
- 4.3.1. Stars (High Growth, High Market Share)
- 4.3.2. Cash Cows (Low Growth, High Market Share)
- 4.3.3. Question Mark (High Growth, Low Market Share)
- 4.3.4. Dogs (Low Growth, Low Market Share)
- 4.4. Ansoff Matrix Analysis
- 4.5. Supply Chain Analysis
- 4.6. Regulatory Landscape
- 4.7. Current Market Potential and Opportunity Assessment (TAM–SAM–SOM Framework)
- 4.8. PRI Analyst Note
- 4.1. Porters Five Forces
- 5. Market Analysis, Insights and Forecast 2021-2033
- 5.1. Market Analysis, Insights and Forecast - by Application
- 5.1.1. Construction
- 5.1.2. Home Decoration
- 5.1.3. Others
- 5.2. Market Analysis, Insights and Forecast - by Types
- 5.2.1. Decoration Mortar
- 5.2.2. Adhesive Mortar
- 5.2.3. Others
- 5.3. Market Analysis, Insights and Forecast - by Region
- 5.3.1. North America
- 5.3.2. South America
- 5.3.3. Europe
- 5.3.4. Middle East & Africa
- 5.3.5. Asia Pacific
- 5.1. Market Analysis, Insights and Forecast - by Application
- 6. Global Dry Mortar Products Analysis, Insights and Forecast, 2021-2033
- 6.1. Market Analysis, Insights and Forecast - by Application
- 6.1.1. Construction
- 6.1.2. Home Decoration
- 6.1.3. Others
- 6.2. Market Analysis, Insights and Forecast - by Types
- 6.2.1. Decoration Mortar
- 6.2.2. Adhesive Mortar
- 6.2.3. Others
- 6.1. Market Analysis, Insights and Forecast - by Application
- 7. North America Dry Mortar Products Analysis, Insights and Forecast, 2020-2032
- 7.1. Market Analysis, Insights and Forecast - by Application
- 7.1.1. Construction
- 7.1.2. Home Decoration
- 7.1.3. Others
- 7.2. Market Analysis, Insights and Forecast - by Types
- 7.2.1. Decoration Mortar
- 7.2.2. Adhesive Mortar
- 7.2.3. Others
- 7.1. Market Analysis, Insights and Forecast - by Application
- 8. South America Dry Mortar Products Analysis, Insights and Forecast, 2020-2032
- 8.1. Market Analysis, Insights and Forecast - by Application
- 8.1.1. Construction
- 8.1.2. Home Decoration
- 8.1.3. Others
- 8.2. Market Analysis, Insights and Forecast - by Types
- 8.2.1. Decoration Mortar
- 8.2.2. Adhesive Mortar
- 8.2.3. Others
- 8.1. Market Analysis, Insights and Forecast - by Application
- 9. Europe Dry Mortar Products Analysis, Insights and Forecast, 2020-2032
- 9.1. Market Analysis, Insights and Forecast - by Application
- 9.1.1. Construction
- 9.1.2. Home Decoration
- 9.1.3. Others
- 9.2. Market Analysis, Insights and Forecast - by Types
- 9.2.1. Decoration Mortar
- 9.2.2. Adhesive Mortar
- 9.2.3. Others
- 9.1. Market Analysis, Insights and Forecast - by Application
- 10. Middle East & Africa Dry Mortar Products Analysis, Insights and Forecast, 2020-2032
- 10.1. Market Analysis, Insights and Forecast - by Application
- 10.1.1. Construction
- 10.1.2. Home Decoration
- 10.1.3. Others
- 10.2. Market Analysis, Insights and Forecast - by Types
- 10.2.1. Decoration Mortar
- 10.2.2. Adhesive Mortar
- 10.2.3. Others
- 10.1. Market Analysis, Insights and Forecast - by Application
- 11. Asia Pacific Dry Mortar Products Analysis, Insights and Forecast, 2020-2032
- 11.1. Market Analysis, Insights and Forecast - by Application
- 11.1.1. Construction
- 11.1.2. Home Decoration
- 11.1.3. Others
- 11.2. Market Analysis, Insights and Forecast - by Types
- 11.2.1. Decoration Mortar
- 11.2.2. Adhesive Mortar
- 11.2.3. Others
- 11.1. Market Analysis, Insights and Forecast - by Application
- 12. Competitive Analysis
- 12.1. Company Profiles
- 12.1.1 Sika
- 12.1.1.1. Company Overview
- 12.1.1.2. Products
- 12.1.1.3. Company Financials
- 12.1.1.4. SWOT Analysis
- 12.1.2 Saint-Gobain Weber
- 12.1.2.1. Company Overview
- 12.1.2.2. Products
- 12.1.2.3. Company Financials
- 12.1.2.4. SWOT Analysis
- 12.1.3 Henkel
- 12.1.3.1. Company Overview
- 12.1.3.2. Products
- 12.1.3.3. Company Financials
- 12.1.3.4. SWOT Analysis
- 12.1.4 Mapei
- 12.1.4.1. Company Overview
- 12.1.4.2. Products
- 12.1.4.3. Company Financials
- 12.1.4.4. SWOT Analysis
- 12.1.5 BASF
- 12.1.5.1. Company Overview
- 12.1.5.2. Products
- 12.1.5.3. Company Financials
- 12.1.5.4. SWOT Analysis
- 12.1.6 Cemex
- 12.1.6.1. Company Overview
- 12.1.6.2. Products
- 12.1.6.3. Company Financials
- 12.1.6.4. SWOT Analysis
- 12.1.7 Knauf
- 12.1.7.1. Company Overview
- 12.1.7.2. Products
- 12.1.7.3. Company Financials
- 12.1.7.4. SWOT Analysis
- 12.1.8 Ardex
- 12.1.8.1. Company Overview
- 12.1.8.2. Products
- 12.1.8.3. Company Financials
- 12.1.8.4. SWOT Analysis
- 12.1.9 Bostik
- 12.1.9.1. Company Overview
- 12.1.9.2. Products
- 12.1.9.3. Company Financials
- 12.1.9.4. SWOT Analysis
- 12.1.10 CBP
- 12.1.10.1. Company Overview
- 12.1.10.2. Products
- 12.1.10.3. Company Financials
- 12.1.10.4. SWOT Analysis
- 12.1.11 Caparol
- 12.1.11.1. Company Overview
- 12.1.11.2. Products
- 12.1.11.3. Company Financials
- 12.1.11.4. SWOT Analysis
- 12.1.12 Hanil Cement
- 12.1.12.1. Company Overview
- 12.1.12.2. Products
- 12.1.12.3. Company Financials
- 12.1.12.4. SWOT Analysis
- 12.1.13 Sto
- 12.1.13.1. Company Overview
- 12.1.13.2. Products
- 12.1.13.3. Company Financials
- 12.1.13.4. SWOT Analysis
- 12.1.14 Baumit
- 12.1.14.1. Company Overview
- 12.1.14.2. Products
- 12.1.14.3. Company Financials
- 12.1.14.4. SWOT Analysis
- 12.1.15 Quick-mix
- 12.1.15.1. Company Overview
- 12.1.15.2. Products
- 12.1.15.3. Company Financials
- 12.1.15.4. SWOT Analysis
- 12.1.16 HB Fuller
- 12.1.16.1. Company Overview
- 12.1.16.2. Products
- 12.1.16.3. Company Financials
- 12.1.16.4. SWOT Analysis
- 12.1.17 Forbo
- 12.1.17.1. Company Overview
- 12.1.17.2. Products
- 12.1.17.3. Company Financials
- 12.1.17.4. SWOT Analysis
- 12.1.18 CPI Mortars
- 12.1.18.1. Company Overview
- 12.1.18.2. Products
- 12.1.18.3. Company Financials
- 12.1.18.4. SWOT Analysis
- 12.1.19 Grupo Puma
- 12.1.19.1. Company Overview
- 12.1.19.2. Products
- 12.1.19.3. Company Financials
- 12.1.19.4. SWOT Analysis
- 12.1.20 Tarmac
- 12.1.20.1. Company Overview
- 12.1.20.2. Products
- 12.1.20.3. Company Financials
- 12.1.20.4. SWOT Analysis
- 12.1.1 Sika
- 12.2. Market Entropy
- 12.2.1 Company's Key Areas Served
- 12.2.2 Recent Developments
- 12.3. Company Market Share Analysis 2025
- 12.3.1 Top 5 Companies Market Share Analysis
- 12.3.2 Top 3 Companies Market Share Analysis
- 12.4. List of Potential Customers
- 13. Research Methodology
List of Figures
- Figure 1: Global Dry Mortar Products Revenue Breakdown (million, %) by Region 2025 & 2033
- Figure 2: North America Dry Mortar Products Revenue (million), by Application 2025 & 2033
- Figure 3: North America Dry Mortar Products Revenue Share (%), by Application 2025 & 2033
- Figure 4: North America Dry Mortar Products Revenue (million), by Types 2025 & 2033
- Figure 5: North America Dry Mortar Products Revenue Share (%), by Types 2025 & 2033
- Figure 6: North America Dry Mortar Products Revenue (million), by Country 2025 & 2033
- Figure 7: North America Dry Mortar Products Revenue Share (%), by Country 2025 & 2033
- Figure 8: South America Dry Mortar Products Revenue (million), by Application 2025 & 2033
- Figure 9: South America Dry Mortar Products Revenue Share (%), by Application 2025 & 2033
- Figure 10: South America Dry Mortar Products Revenue (million), by Types 2025 & 2033
- Figure 11: South America Dry Mortar Products Revenue Share (%), by Types 2025 & 2033
- Figure 12: South America Dry Mortar Products Revenue (million), by Country 2025 & 2033
- Figure 13: South America Dry Mortar Products Revenue Share (%), by Country 2025 & 2033
- Figure 14: Europe Dry Mortar Products Revenue (million), by Application 2025 & 2033
- Figure 15: Europe Dry Mortar Products Revenue Share (%), by Application 2025 & 2033
- Figure 16: Europe Dry Mortar Products Revenue (million), by Types 2025 & 2033
- Figure 17: Europe Dry Mortar Products Revenue Share (%), by Types 2025 & 2033
- Figure 18: Europe Dry Mortar Products Revenue (million), by Country 2025 & 2033
- Figure 19: Europe Dry Mortar Products Revenue Share (%), by Country 2025 & 2033
- Figure 20: Middle East & Africa Dry Mortar Products Revenue (million), by Application 2025 & 2033
- Figure 21: Middle East & Africa Dry Mortar Products Revenue Share (%), by Application 2025 & 2033
- Figure 22: Middle East & Africa Dry Mortar Products Revenue (million), by Types 2025 & 2033
- Figure 23: Middle East & Africa Dry Mortar Products Revenue Share (%), by Types 2025 & 2033
- Figure 24: Middle East & Africa Dry Mortar Products Revenue (million), by Country 2025 & 2033
- Figure 25: Middle East & Africa Dry Mortar Products Revenue Share (%), by Country 2025 & 2033
- Figure 26: Asia Pacific Dry Mortar Products Revenue (million), by Application 2025 & 2033
- Figure 27: Asia Pacific Dry Mortar Products Revenue Share (%), by Application 2025 & 2033
- Figure 28: Asia Pacific Dry Mortar Products Revenue (million), by Types 2025 & 2033
- Figure 29: Asia Pacific Dry Mortar Products Revenue Share (%), by Types 2025 & 2033
- Figure 30: Asia Pacific Dry Mortar Products Revenue (million), by Country 2025 & 2033
- Figure 31: Asia Pacific Dry Mortar Products Revenue Share (%), by Country 2025 & 2033
List of Tables
- Table 1: Global Dry Mortar Products Revenue million Forecast, by Application 2020 & 2033
- Table 2: Global Dry Mortar Products Revenue million Forecast, by Types 2020 & 2033
- Table 3: Global Dry Mortar Products Revenue million Forecast, by Region 2020 & 2033
- Table 4: Global Dry Mortar Products Revenue million Forecast, by Application 2020 & 2033
- Table 5: Global Dry Mortar Products Revenue million Forecast, by Types 2020 & 2033
- Table 6: Global Dry Mortar Products Revenue million Forecast, by Country 2020 & 2033
- Table 7: United States Dry Mortar Products Revenue (million) Forecast, by Application 2020 & 2033
- Table 8: Canada Dry Mortar Products Revenue (million) Forecast, by Application 2020 & 2033
- Table 9: Mexico Dry Mortar Products Revenue (million) Forecast, by Application 2020 & 2033
- Table 10: Global Dry Mortar Products Revenue million Forecast, by Application 2020 & 2033
- Table 11: Global Dry Mortar Products Revenue million Forecast, by Types 2020 & 2033
- Table 12: Global Dry Mortar Products Revenue million Forecast, by Country 2020 & 2033
- Table 13: Brazil Dry Mortar Products Revenue (million) Forecast, by Application 2020 & 2033
- Table 14: Argentina Dry Mortar Products Revenue (million) Forecast, by Application 2020 & 2033
- Table 15: Rest of South America Dry Mortar Products Revenue (million) Forecast, by Application 2020 & 2033
- Table 16: Global Dry Mortar Products Revenue million Forecast, by Application 2020 & 2033
- Table 17: Global Dry Mortar Products Revenue million Forecast, by Types 2020 & 2033
- Table 18: Global Dry Mortar Products Revenue million Forecast, by Country 2020 & 2033
- Table 19: United Kingdom Dry Mortar Products Revenue (million) Forecast, by Application 2020 & 2033
- Table 20: Germany Dry Mortar Products Revenue (million) Forecast, by Application 2020 & 2033
- Table 21: France Dry Mortar Products Revenue (million) Forecast, by Application 2020 & 2033
- Table 22: Italy Dry Mortar Products Revenue (million) Forecast, by Application 2020 & 2033
- Table 23: Spain Dry Mortar Products Revenue (million) Forecast, by Application 2020 & 2033
- Table 24: Russia Dry Mortar Products Revenue (million) Forecast, by Application 2020 & 2033
- Table 25: Benelux Dry Mortar Products Revenue (million) Forecast, by Application 2020 & 2033
- Table 26: Nordics Dry Mortar Products Revenue (million) Forecast, by Application 2020 & 2033
- Table 27: Rest of Europe Dry Mortar Products Revenue (million) Forecast, by Application 2020 & 2033
- Table 28: Global Dry Mortar Products Revenue million Forecast, by Application 2020 & 2033
- Table 29: Global Dry Mortar Products Revenue million Forecast, by Types 2020 & 2033
- Table 30: Global Dry Mortar Products Revenue million Forecast, by Country 2020 & 2033
- Table 31: Turkey Dry Mortar Products Revenue (million) Forecast, by Application 2020 & 2033
- Table 32: Israel Dry Mortar Products Revenue (million) Forecast, by Application 2020 & 2033
- Table 33: GCC Dry Mortar Products Revenue (million) Forecast, by Application 2020 & 2033
- Table 34: North Africa Dry Mortar Products Revenue (million) Forecast, by Application 2020 & 2033
- Table 35: South Africa Dry Mortar Products Revenue (million) Forecast, by Application 2020 & 2033
- Table 36: Rest of Middle East & Africa Dry Mortar Products Revenue (million) Forecast, by Application 2020 & 2033
- Table 37: Global Dry Mortar Products Revenue million Forecast, by Application 2020 & 2033
- Table 38: Global Dry Mortar Products Revenue million Forecast, by Types 2020 & 2033
- Table 39: Global Dry Mortar Products Revenue million Forecast, by Country 2020 & 2033
- Table 40: China Dry Mortar Products Revenue (million) Forecast, by Application 2020 & 2033
- Table 41: India Dry Mortar Products Revenue (million) Forecast, by Application 2020 & 2033
- Table 42: Japan Dry Mortar Products Revenue (million) Forecast, by Application 2020 & 2033
- Table 43: South Korea Dry Mortar Products Revenue (million) Forecast, by Application 2020 & 2033
- Table 44: ASEAN Dry Mortar Products Revenue (million) Forecast, by Application 2020 & 2033
- Table 45: Oceania Dry Mortar Products Revenue (million) Forecast, by Application 2020 & 2033
- Table 46: Rest of Asia Pacific Dry Mortar Products Revenue (million) Forecast, by Application 2020 & 2033
Frequently Asked Questions
1. What is the projected Compound Annual Growth Rate (CAGR) of the Dry Mortar Products?
The projected CAGR is approximately 5%.
2. Which companies are prominent players in the Dry Mortar Products?
Key companies in the market include Sika, Saint-Gobain Weber, Henkel, Mapei, BASF, Cemex, Knauf, Ardex, Bostik, CBP, Caparol, Hanil Cement, Sto, Baumit, Quick-mix, HB Fuller, Forbo, CPI Mortars, Grupo Puma, Tarmac.
3. What are the main segments of the Dry Mortar Products?
The market segments include Application, Types.
4. Can you provide details about the market size?
The market size is estimated to be USD 28820 million as of 2022.
5. What are some drivers contributing to market growth?
N/A
6. What are the notable trends driving market growth?
N/A
7. Are there any restraints impacting market growth?
N/A
8. Can you provide examples of recent developments in the market?
N/A
9. What pricing options are available for accessing the report?
Pricing options include single-user, multi-user, and enterprise licenses priced at USD 4900.00, USD 7350.00, and USD 9800.00 respectively.
10. Is the market size provided in terms of value or volume?
The market size is provided in terms of value, measured in million.
11. Are there any specific market keywords associated with the report?
Yes, the market keyword associated with the report is "Dry Mortar Products," which aids in identifying and referencing the specific market segment covered.
12. How do I determine which pricing option suits my needs best?
The pricing options vary based on user requirements and access needs. Individual users may opt for single-user licenses, while businesses requiring broader access may choose multi-user or enterprise licenses for cost-effective access to the report.
13. Are there any additional resources or data provided in the Dry Mortar Products report?
While the report offers comprehensive insights, it's advisable to review the specific contents or supplementary materials provided to ascertain if additional resources or data are available.
14. How can I stay updated on further developments or reports in the Dry Mortar Products?
To stay informed about further developments, trends, and reports in the Dry Mortar Products, consider subscribing to industry newsletters, following relevant companies and organizations, or regularly checking reputable industry news sources and publications.
Methodology
Step 1 - Identification of Relevant Samples Size from Population Database


Step 2 - Approaches for Defining Global Market Size (Value, Volume* & Price*)

Note*: In applicable scenarios
Step 3 - Data Sources
Primary Research
- Web Analytics
- Survey Reports
- Research Institute
- Latest Research Reports
- Opinion Leaders
Secondary Research
- Annual Reports
- White Paper
- Latest Press Release
- Industry Association
- Paid Database
- Investor Presentations

Step 4 - Data Triangulation
Involves using different sources of information in order to increase the validity of a study
These sources are likely to be stakeholders in a program - participants, other researchers, program staff, other community members, and so on.
Then we put all data in single framework & apply various statistical tools to find out the dynamic on the market.
During the analysis stage, feedback from the stakeholder groups would be compared to determine areas of agreement as well as areas of divergence