

Key Insights
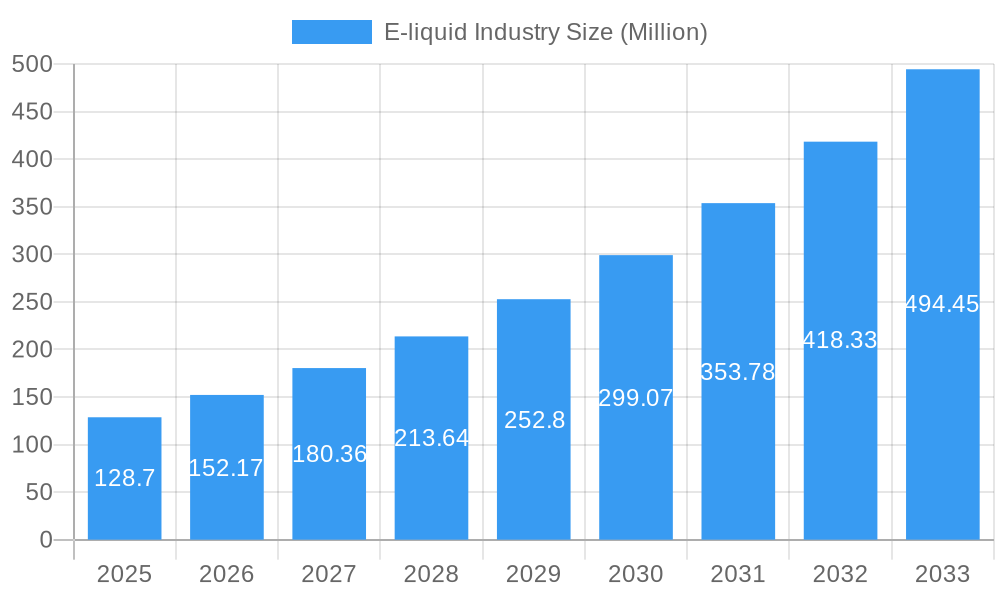
The global e-liquid market, valued at $128.70 million in 2025, is projected to experience robust growth, driven by increasing e-cigarette adoption and the rising popularity of vaping among young adults and former smokers seeking alternatives to traditional tobacco. The market's Compound Annual Growth Rate (CAGR) of 18.20% from 2025 to 2033 signifies substantial expansion opportunities. Key drivers include the increasing availability of diverse e-liquid flavors, the growing preference for personalized vaping experiences, and continuous technological advancements in device design and e-liquid formulations. However, stringent government regulations concerning vaping product sales and marketing, particularly concerning youth access, pose a significant restraint on market expansion. The market is segmented by product type (e-cigarette devices and e-liquids) and distribution channel (offline and online). Online sales are expected to witness particularly strong growth due to the convenience and expanding reach of e-commerce platforms. Major players like RITCHY GROUP, Innokin Technology, Philip Morris International Inc., and others, are actively engaged in product innovation, strategic partnerships, and mergers and acquisitions to enhance their market position and capitalize on the industry's rapid growth. Geographical expansion, especially in emerging economies with growing disposable incomes and a young population, presents significant opportunities for further market penetration. Competition within the market is intensifying, necessitating continuous innovation and marketing strategies to attract and retain customers.
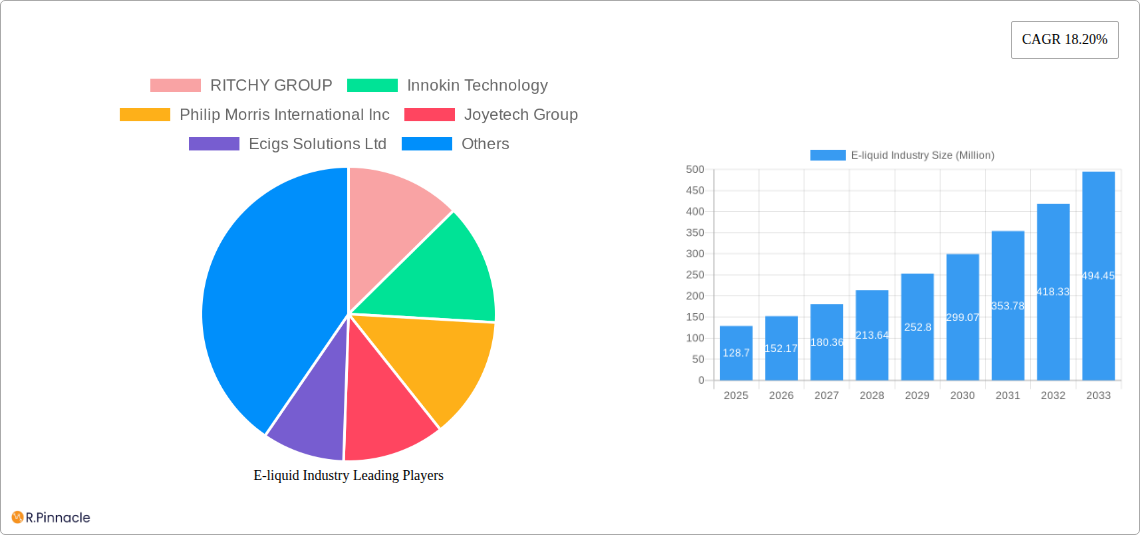
E-liquid Industry Market Size (In Million)
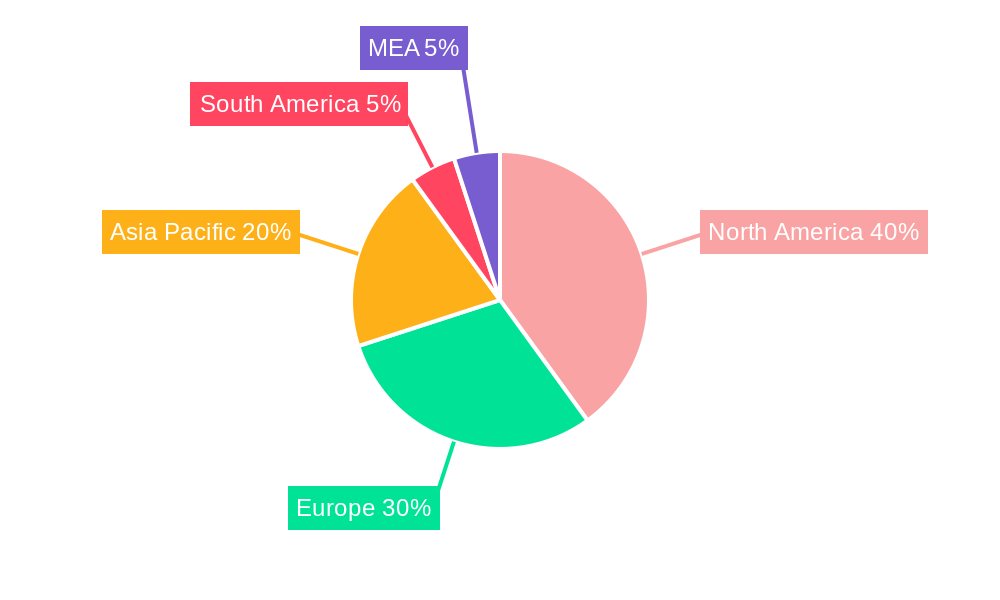
The North American market, particularly the United States, is anticipated to remain a significant revenue contributor, owing to high e-cigarette usage and a developed e-commerce infrastructure. However, Europe and the Asia-Pacific region are showing promising growth trajectories, driven by increasing consumer awareness, expanding product availability, and favorable regulatory environments in certain countries. South America and the Middle East and Africa regions also present long-term growth prospects, though regulatory landscapes and market penetration levels vary widely across these regions. The e-liquid market is constantly evolving, with new flavors, nicotine strengths, and delivery systems emerging consistently. The long-term success of e-liquid manufacturers depends on their ability to adapt to changing consumer preferences, comply with evolving regulatory standards, and invest in research and development to create innovative and safer products.
E-liquid Industry Company Market Share
E-liquid Industry Market Report: 2019-2033
This comprehensive report provides an in-depth analysis of the global e-liquid industry, projecting market trends and opportunities from 2019 to 2033. Featuring a detailed examination of market structure, dynamics, key players, and future outlook, this report is an essential resource for industry professionals, investors, and strategic decision-makers. The report covers a market valued at $XX Million in 2025 and projects significant growth throughout the forecast period (2025-2033).
E-liquid Industry Market Structure & Innovation Trends
The e-liquid market is characterized by a moderately concentrated structure, with key players like RITCHY GROUP, Innokin Technology, Philip Morris International Inc, and Joyetech Group holding significant market share. The exact market share for each company in 2025 is estimated at xx% (RITCHY GROUP), xx% (Innokin Technology), xx% (Philip Morris International Inc), and xx% (Joyetech Group), respectively. Innovation in the industry is driven by advancements in flavor technology, device design, and nicotine delivery systems. Regulatory frameworks vary significantly across different regions, impacting market access and product offerings. The emergence of heated tobacco products and other nicotine-delivery systems presents significant substitution risks. The end-user demographic skews towards young adults and former smokers, with a growing segment of adult consumers seeking alternatives to traditional cigarettes. M&A activity in the industry has been significant in recent years, with deal values reaching $XX Million in 2024. Examples include (specific deals and values would be included in the full report).
- Market Concentration: Moderately concentrated, with several major players dominating.
- Innovation Drivers: Flavor technology, device design, nicotine delivery.
- Regulatory Landscape: Highly variable across regions, impacting market access.
- Product Substitutes: Heated tobacco products, other nicotine delivery systems.
- End-User Demographics: Young adults, former smokers, adult consumers.
- M&A Activity: Significant, with deal values totaling $XX Million in 2024.
E-liquid Industry Market Dynamics & Trends
The e-liquid market is experiencing robust growth, driven by increasing consumer adoption of vaping products as alternatives to traditional cigarettes. Technological disruptions such as the development of advanced vaping devices with improved functionality and safety features are significantly impacting market dynamics. Shifting consumer preferences toward specific flavors, nicotine strengths, and device types are influencing product development and marketing strategies. Competitive dynamics are characterized by intense rivalry among established players and the emergence of new entrants, particularly in the online distribution channel. The global e-liquid market is projected to register a CAGR of xx% during the forecast period (2025-2033), driven by factors including rising disposable incomes, changing consumer habits, and technological advancements. Market penetration is expected to reach xx% by 2033. The increasing prevalence of vaping-related health concerns, however, poses a challenge to market expansion and requires stringent regulatory compliance.
Dominant Regions & Segments in E-liquid Industry
The e-liquid market shows significant regional variations. North America and Europe currently dominate in terms of market size and consumption, but growth in Asia-Pacific is projected to be rapid in the coming years.
- By Product Type:
- E-cigarette Devices: This segment holds a larger market share compared to e-liquid devices due to higher demand and technological advancements.
- E-liquid Devices: This segment is expected to experience moderate growth due to the increasing preference for customized vaping experiences.
- By Distribution Channel:
- Offline Channel: This segment still maintains a sizable portion of the market, particularly in regions with limited e-commerce penetration.
- Online Channel: This segment is experiencing exponential growth due to ease of access, wider product selection, and competitive pricing.
Key Drivers (Regional variations will be detailed in the full report):
- Economic factors (disposable incomes, consumer spending)
- Regulatory environment (permitting, taxation, restrictions)
- Infrastructure development (e-commerce accessibility, logistics networks)
E-liquid Industry Product Innovations
The e-liquid industry witnesses continuous product innovation focused on enhancing user experience and safety. Technological trends include the development of innovative coil technologies, improved flavor delivery systems, and disposable pod systems. These advancements cater to varied consumer preferences, increasing market acceptance and penetration. The competitive advantages stem from proprietary flavor profiles, superior device designs, and strong brand recognition.
Report Scope & Segmentation Analysis
This report segments the e-liquid market by product type (e-cigarette devices and e-liquid devices) and distribution channel (offline and online). Each segment's growth projection and competitive dynamics are analyzed. Growth projections vary significantly between segments and regions, reflecting differing consumer preferences and regulatory environments.
- E-cigarette Devices: This segment is expected to show a CAGR of xx% during the forecast period (2025-2033), with a market size of $XX Million in 2025. Competition is fierce, with ongoing innovation driving market share dynamics.
- E-liquid Devices: This segment is expected to grow at a CAGR of xx% during the forecast period (2025-2033), with a market size of $XX Million in 2025. The segment benefits from customization options.
- Offline Channel: This segment’s market size is $XX Million in 2025 and it will grow at a CAGR of xx% during the forecast period (2025-2033). Competition is intense, with traditional retailers and specialized vape shops vying for market share.
- Online Channel: This segment’s market size is $XX Million in 2025 and it will grow at a CAGR of xx% during the forecast period (2025-2033). E-commerce platforms and direct-to-consumer brands are driving strong growth.
Key Drivers of E-liquid Industry Growth
The e-liquid industry's growth is fueled by technological advancements leading to safer and more user-friendly devices, increasing disposable incomes globally enabling higher spending on recreational products, and the evolving regulatory landscape in several key markets that is gradually permitting and regulating the sale of e-cigarettes.
Challenges in the E-liquid Industry Sector
The e-liquid industry faces significant challenges, including stringent regulations concerning product safety and marketing, which increases compliance costs and restricts market access. Supply chain disruptions can impact availability and pricing. Intense competition from established players and emerging brands pressures profit margins. These factors limit growth potential and require strategic adaptation.
Emerging Opportunities in E-liquid Industry
Emerging opportunities lie in expanding into new and developing markets, offering customized vaping solutions to cater to specific needs, leveraging technological advancements such as personalized nicotine delivery systems, and developing novel flavor profiles and product formats. These developments expand market reach and drive growth.
Leading Players in the E-liquid Industry Market
- RITCHY GROUP
- Innokin Technology
- Philip Morris International Inc
- Joyetech Group
- Ecigs Solutions Ltd
- Intellicig Inc
- Aspire
- KangerTech
- British American Tobacco
- VIP Electronic Cigarettes
Key Developments in E-liquid Industry
- April 2022: RELX International celebrates the legalization of e-cigarettes in Egypt, opening a new market.
- November 2019: Dubai legalizes e-cigarette trading, boosting regional market access.
- September 2019: The UAE establishes new regulations for electronic cigarettes, setting standards and requiring health warnings.
Future Outlook for E-liquid Industry Market
The future of the e-liquid market is promising, with continued growth anticipated due to increasing consumer adoption, technological innovation, and market expansion into new regions. Strategic opportunities exist in developing innovative products, strengthening supply chains, and navigating evolving regulatory landscapes. The market's trajectory will depend heavily on consumer perception, public health concerns, and the actions of regulatory bodies worldwide.
E-liquid Industry Segmentation
-
1. Product Type
- 1.1. E-cigarette Devices
- 1.2. E-liquid Devices
-
2. Distribution Channel
- 2.1. Offline Channel
- 2.2. Online Channel
-
3. Geography
- 3.1. South Africa
- 3.2. Nigeria
- 3.3. Kenya
- 3.4. Ghana
- 3.5. United Arab Emirates
- 3.6. Egypt
- 3.7. Rest of Middle East & Africa
E-liquid Industry Segmentation By Geography
- 1. South Africa
- 2. Nigeria
- 3. Kenya
- 4. Ghana
- 5. United Arab Emirates
- 6. Egypt
- 7. Rest of Middle East
E-liquid Industry Regional Market Share
Geographic Coverage of E-liquid Industry
E-liquid Industry REPORT HIGHLIGHTS
| Aspects | Details |
|---|---|
| Study Period | 2020-2034 |
| Base Year | 2025 |
| Estimated Year | 2026 |
| Forecast Period | 2026-2034 |
| Historical Period | 2020-2025 |
| Growth Rate | CAGR of 18.20% from 2020-2034 |
| Segmentation |
|
Table of Contents
- 1. Introduction
- 1.1. Research Scope
- 1.2. Market Segmentation
- 1.3. Research Objective
- 1.4. Definitions and Assumptions
- 2. Executive Summary
- 2.1. Market Snapshot
- 3. Market Dynamics
- 3.1. Market Drivers
- 3.2. Market Restrains
- 3.3. Market Trends
- 3.4. Market Opportunities
- 4. Market Factor Analysis
- 4.1. Porters Five Forces
- 4.1.1. Bargaining Power of Suppliers
- 4.1.2. Bargaining Power of Buyers
- 4.1.3. Threat of New Entrants
- 4.1.4. Threat of Substitutes
- 4.1.5. Competitive Rivalry
- 4.2. PESTEL analysis
- 4.3. BCG Analysis
- 4.3.1. Stars (High Growth, High Market Share)
- 4.3.2. Cash Cows (Low Growth, High Market Share)
- 4.3.3. Question Mark (High Growth, Low Market Share)
- 4.3.4. Dogs (Low Growth, Low Market Share)
- 4.4. Ansoff Matrix Analysis
- 4.5. Supply Chain Analysis
- 4.6. Regulatory Landscape
- 4.7. Current Market Potential and Opportunity Assessment (TAM–SAM–SOM Framework)
- 4.8. PRI Analyst Note
- 4.1. Porters Five Forces
- 5. Market Analysis, Insights and Forecast 2021-2033
- 5.1. Market Analysis, Insights and Forecast - by Product Type
- 5.1.1. E-cigarette Devices
- 5.1.2. E-liquid Devices
- 5.2. Market Analysis, Insights and Forecast - by Distribution Channel
- 5.2.1. Offline Channel
- 5.2.2. Online Channel
- 5.3. Market Analysis, Insights and Forecast - by Geography
- 5.3.1. South Africa
- 5.3.2. Nigeria
- 5.3.3. Kenya
- 5.3.4. Ghana
- 5.3.5. United Arab Emirates
- 5.3.6. Egypt
- 5.3.7. Rest of Middle East & Africa
- 5.4. Market Analysis, Insights and Forecast - by Region
- 5.4.1. South Africa
- 5.4.2. Nigeria
- 5.4.3. Kenya
- 5.4.4. Ghana
- 5.4.5. United Arab Emirates
- 5.4.6. Egypt
- 5.4.7. Rest of Middle East
- 5.1. Market Analysis, Insights and Forecast - by Product Type
- 6. Global E-liquid Industry Analysis, Insights and Forecast, 2021-2033
- 6.1. Market Analysis, Insights and Forecast - by Product Type
- 6.1.1. E-cigarette Devices
- 6.1.2. E-liquid Devices
- 6.2. Market Analysis, Insights and Forecast - by Distribution Channel
- 6.2.1. Offline Channel
- 6.2.2. Online Channel
- 6.3. Market Analysis, Insights and Forecast - by Geography
- 6.3.1. South Africa
- 6.3.2. Nigeria
- 6.3.3. Kenya
- 6.3.4. Ghana
- 6.3.5. United Arab Emirates
- 6.3.6. Egypt
- 6.3.7. Rest of Middle East & Africa
- 6.1. Market Analysis, Insights and Forecast - by Product Type
- 7. South Africa E-liquid Industry Analysis, Insights and Forecast, 2020-2032
- 7.1. Market Analysis, Insights and Forecast - by Product Type
- 7.1.1. E-cigarette Devices
- 7.1.2. E-liquid Devices
- 7.2. Market Analysis, Insights and Forecast - by Distribution Channel
- 7.2.1. Offline Channel
- 7.2.2. Online Channel
- 7.3. Market Analysis, Insights and Forecast - by Geography
- 7.3.1. South Africa
- 7.3.2. Nigeria
- 7.3.3. Kenya
- 7.3.4. Ghana
- 7.3.5. United Arab Emirates
- 7.3.6. Egypt
- 7.3.7. Rest of Middle East & Africa
- 7.1. Market Analysis, Insights and Forecast - by Product Type
- 8. Nigeria E-liquid Industry Analysis, Insights and Forecast, 2020-2032
- 8.1. Market Analysis, Insights and Forecast - by Product Type
- 8.1.1. E-cigarette Devices
- 8.1.2. E-liquid Devices
- 8.2. Market Analysis, Insights and Forecast - by Distribution Channel
- 8.2.1. Offline Channel
- 8.2.2. Online Channel
- 8.3. Market Analysis, Insights and Forecast - by Geography
- 8.3.1. South Africa
- 8.3.2. Nigeria
- 8.3.3. Kenya
- 8.3.4. Ghana
- 8.3.5. United Arab Emirates
- 8.3.6. Egypt
- 8.3.7. Rest of Middle East & Africa
- 8.1. Market Analysis, Insights and Forecast - by Product Type
- 9. Kenya E-liquid Industry Analysis, Insights and Forecast, 2020-2032
- 9.1. Market Analysis, Insights and Forecast - by Product Type
- 9.1.1. E-cigarette Devices
- 9.1.2. E-liquid Devices
- 9.2. Market Analysis, Insights and Forecast - by Distribution Channel
- 9.2.1. Offline Channel
- 9.2.2. Online Channel
- 9.3. Market Analysis, Insights and Forecast - by Geography
- 9.3.1. South Africa
- 9.3.2. Nigeria
- 9.3.3. Kenya
- 9.3.4. Ghana
- 9.3.5. United Arab Emirates
- 9.3.6. Egypt
- 9.3.7. Rest of Middle East & Africa
- 9.1. Market Analysis, Insights and Forecast - by Product Type
- 10. Ghana E-liquid Industry Analysis, Insights and Forecast, 2020-2032
- 10.1. Market Analysis, Insights and Forecast - by Product Type
- 10.1.1. E-cigarette Devices
- 10.1.2. E-liquid Devices
- 10.2. Market Analysis, Insights and Forecast - by Distribution Channel
- 10.2.1. Offline Channel
- 10.2.2. Online Channel
- 10.3. Market Analysis, Insights and Forecast - by Geography
- 10.3.1. South Africa
- 10.3.2. Nigeria
- 10.3.3. Kenya
- 10.3.4. Ghana
- 10.3.5. United Arab Emirates
- 10.3.6. Egypt
- 10.3.7. Rest of Middle East & Africa
- 10.1. Market Analysis, Insights and Forecast - by Product Type
- 11. United Arab Emirates E-liquid Industry Analysis, Insights and Forecast, 2020-2032
- 11.1. Market Analysis, Insights and Forecast - by Product Type
- 11.1.1. E-cigarette Devices
- 11.1.2. E-liquid Devices
- 11.2. Market Analysis, Insights and Forecast - by Distribution Channel
- 11.2.1. Offline Channel
- 11.2.2. Online Channel
- 11.3. Market Analysis, Insights and Forecast - by Geography
- 11.3.1. South Africa
- 11.3.2. Nigeria
- 11.3.3. Kenya
- 11.3.4. Ghana
- 11.3.5. United Arab Emirates
- 11.3.6. Egypt
- 11.3.7. Rest of Middle East & Africa
- 11.1. Market Analysis, Insights and Forecast - by Product Type
- 12. Egypt E-liquid Industry Analysis, Insights and Forecast, 2020-2032
- 12.1. Market Analysis, Insights and Forecast - by Product Type
- 12.1.1. E-cigarette Devices
- 12.1.2. E-liquid Devices
- 12.2. Market Analysis, Insights and Forecast - by Distribution Channel
- 12.2.1. Offline Channel
- 12.2.2. Online Channel
- 12.3. Market Analysis, Insights and Forecast - by Geography
- 12.3.1. South Africa
- 12.3.2. Nigeria
- 12.3.3. Kenya
- 12.3.4. Ghana
- 12.3.5. United Arab Emirates
- 12.3.6. Egypt
- 12.3.7. Rest of Middle East & Africa
- 12.1. Market Analysis, Insights and Forecast - by Product Type
- 13. Rest of Middle East E-liquid Industry Analysis, Insights and Forecast, 2020-2032
- 13.1. Market Analysis, Insights and Forecast - by Product Type
- 13.1.1. E-cigarette Devices
- 13.1.2. E-liquid Devices
- 13.2. Market Analysis, Insights and Forecast - by Distribution Channel
- 13.2.1. Offline Channel
- 13.2.2. Online Channel
- 13.3. Market Analysis, Insights and Forecast - by Geography
- 13.3.1. South Africa
- 13.3.2. Nigeria
- 13.3.3. Kenya
- 13.3.4. Ghana
- 13.3.5. United Arab Emirates
- 13.3.6. Egypt
- 13.3.7. Rest of Middle East & Africa
- 13.1. Market Analysis, Insights and Forecast - by Product Type
- 14. Competitive Analysis
- 14.1. Company Profiles
- 14.1.1 RITCHY GROUP
- 14.1.1.1. Company Overview
- 14.1.1.2. Products
- 14.1.1.3. Company Financials
- 14.1.1.4. SWOT Analysis
- 14.1.2 Innokin Technology
- 14.1.2.1. Company Overview
- 14.1.2.2. Products
- 14.1.2.3. Company Financials
- 14.1.2.4. SWOT Analysis
- 14.1.3 Philip Morris International Inc
- 14.1.3.1. Company Overview
- 14.1.3.2. Products
- 14.1.3.3. Company Financials
- 14.1.3.4. SWOT Analysis
- 14.1.4 Joyetech Group
- 14.1.4.1. Company Overview
- 14.1.4.2. Products
- 14.1.4.3. Company Financials
- 14.1.4.4. SWOT Analysis
- 14.1.5 Ecigs Solutions Ltd
- 14.1.5.1. Company Overview
- 14.1.5.2. Products
- 14.1.5.3. Company Financials
- 14.1.5.4. SWOT Analysis
- 14.1.6 Intellicig Inc
- 14.1.6.1. Company Overview
- 14.1.6.2. Products
- 14.1.6.3. Company Financials
- 14.1.6.4. SWOT Analysis
- 14.1.7 Aspire
- 14.1.7.1. Company Overview
- 14.1.7.2. Products
- 14.1.7.3. Company Financials
- 14.1.7.4. SWOT Analysis
- 14.1.8 KangerTech
- 14.1.8.1. Company Overview
- 14.1.8.2. Products
- 14.1.8.3. Company Financials
- 14.1.8.4. SWOT Analysis
- 14.1.9 British American Tobacco
- 14.1.9.1. Company Overview
- 14.1.9.2. Products
- 14.1.9.3. Company Financials
- 14.1.9.4. SWOT Analysis
- 14.1.10 VIP Electronic Cigarettes
- 14.1.10.1. Company Overview
- 14.1.10.2. Products
- 14.1.10.3. Company Financials
- 14.1.10.4. SWOT Analysis
- 14.1.1 RITCHY GROUP
- 14.2. Market Entropy
- 14.2.1 Company's Key Areas Served
- 14.2.2 Recent Developments
- 14.3. Company Market Share Analysis 2025
- 14.3.1 Top 5 Companies Market Share Analysis
- 14.3.2 Top 3 Companies Market Share Analysis
- 14.4. List of Potential Customers
- 15. Research Methodology
List of Figures
- Figure 1: Global E-liquid Industry Revenue Breakdown (Million, %) by Region 2025 & 2033
- Figure 2: South Africa E-liquid Industry Revenue (Million), by Product Type 2025 & 2033
- Figure 3: South Africa E-liquid Industry Revenue Share (%), by Product Type 2025 & 2033
- Figure 4: South Africa E-liquid Industry Revenue (Million), by Distribution Channel 2025 & 2033
- Figure 5: South Africa E-liquid Industry Revenue Share (%), by Distribution Channel 2025 & 2033
- Figure 6: South Africa E-liquid Industry Revenue (Million), by Geography 2025 & 2033
- Figure 7: South Africa E-liquid Industry Revenue Share (%), by Geography 2025 & 2033
- Figure 8: South Africa E-liquid Industry Revenue (Million), by Country 2025 & 2033
- Figure 9: South Africa E-liquid Industry Revenue Share (%), by Country 2025 & 2033
- Figure 10: Nigeria E-liquid Industry Revenue (Million), by Product Type 2025 & 2033
- Figure 11: Nigeria E-liquid Industry Revenue Share (%), by Product Type 2025 & 2033
- Figure 12: Nigeria E-liquid Industry Revenue (Million), by Distribution Channel 2025 & 2033
- Figure 13: Nigeria E-liquid Industry Revenue Share (%), by Distribution Channel 2025 & 2033
- Figure 14: Nigeria E-liquid Industry Revenue (Million), by Geography 2025 & 2033
- Figure 15: Nigeria E-liquid Industry Revenue Share (%), by Geography 2025 & 2033
- Figure 16: Nigeria E-liquid Industry Revenue (Million), by Country 2025 & 2033
- Figure 17: Nigeria E-liquid Industry Revenue Share (%), by Country 2025 & 2033
- Figure 18: Kenya E-liquid Industry Revenue (Million), by Product Type 2025 & 2033
- Figure 19: Kenya E-liquid Industry Revenue Share (%), by Product Type 2025 & 2033
- Figure 20: Kenya E-liquid Industry Revenue (Million), by Distribution Channel 2025 & 2033
- Figure 21: Kenya E-liquid Industry Revenue Share (%), by Distribution Channel 2025 & 2033
- Figure 22: Kenya E-liquid Industry Revenue (Million), by Geography 2025 & 2033
- Figure 23: Kenya E-liquid Industry Revenue Share (%), by Geography 2025 & 2033
- Figure 24: Kenya E-liquid Industry Revenue (Million), by Country 2025 & 2033
- Figure 25: Kenya E-liquid Industry Revenue Share (%), by Country 2025 & 2033
- Figure 26: Ghana E-liquid Industry Revenue (Million), by Product Type 2025 & 2033
- Figure 27: Ghana E-liquid Industry Revenue Share (%), by Product Type 2025 & 2033
- Figure 28: Ghana E-liquid Industry Revenue (Million), by Distribution Channel 2025 & 2033
- Figure 29: Ghana E-liquid Industry Revenue Share (%), by Distribution Channel 2025 & 2033
- Figure 30: Ghana E-liquid Industry Revenue (Million), by Geography 2025 & 2033
- Figure 31: Ghana E-liquid Industry Revenue Share (%), by Geography 2025 & 2033
- Figure 32: Ghana E-liquid Industry Revenue (Million), by Country 2025 & 2033
- Figure 33: Ghana E-liquid Industry Revenue Share (%), by Country 2025 & 2033
- Figure 34: United Arab Emirates E-liquid Industry Revenue (Million), by Product Type 2025 & 2033
- Figure 35: United Arab Emirates E-liquid Industry Revenue Share (%), by Product Type 2025 & 2033
- Figure 36: United Arab Emirates E-liquid Industry Revenue (Million), by Distribution Channel 2025 & 2033
- Figure 37: United Arab Emirates E-liquid Industry Revenue Share (%), by Distribution Channel 2025 & 2033
- Figure 38: United Arab Emirates E-liquid Industry Revenue (Million), by Geography 2025 & 2033
- Figure 39: United Arab Emirates E-liquid Industry Revenue Share (%), by Geography 2025 & 2033
- Figure 40: United Arab Emirates E-liquid Industry Revenue (Million), by Country 2025 & 2033
- Figure 41: United Arab Emirates E-liquid Industry Revenue Share (%), by Country 2025 & 2033
- Figure 42: Egypt E-liquid Industry Revenue (Million), by Product Type 2025 & 2033
- Figure 43: Egypt E-liquid Industry Revenue Share (%), by Product Type 2025 & 2033
- Figure 44: Egypt E-liquid Industry Revenue (Million), by Distribution Channel 2025 & 2033
- Figure 45: Egypt E-liquid Industry Revenue Share (%), by Distribution Channel 2025 & 2033
- Figure 46: Egypt E-liquid Industry Revenue (Million), by Geography 2025 & 2033
- Figure 47: Egypt E-liquid Industry Revenue Share (%), by Geography 2025 & 2033
- Figure 48: Egypt E-liquid Industry Revenue (Million), by Country 2025 & 2033
- Figure 49: Egypt E-liquid Industry Revenue Share (%), by Country 2025 & 2033
- Figure 50: Rest of Middle East E-liquid Industry Revenue (Million), by Product Type 2025 & 2033
- Figure 51: Rest of Middle East E-liquid Industry Revenue Share (%), by Product Type 2025 & 2033
- Figure 52: Rest of Middle East E-liquid Industry Revenue (Million), by Distribution Channel 2025 & 2033
- Figure 53: Rest of Middle East E-liquid Industry Revenue Share (%), by Distribution Channel 2025 & 2033
- Figure 54: Rest of Middle East E-liquid Industry Revenue (Million), by Geography 2025 & 2033
- Figure 55: Rest of Middle East E-liquid Industry Revenue Share (%), by Geography 2025 & 2033
- Figure 56: Rest of Middle East E-liquid Industry Revenue (Million), by Country 2025 & 2033
- Figure 57: Rest of Middle East E-liquid Industry Revenue Share (%), by Country 2025 & 2033
List of Tables
- Table 1: Global E-liquid Industry Revenue Million Forecast, by Product Type 2020 & 2033
- Table 2: Global E-liquid Industry Revenue Million Forecast, by Distribution Channel 2020 & 2033
- Table 3: Global E-liquid Industry Revenue Million Forecast, by Geography 2020 & 2033
- Table 4: Global E-liquid Industry Revenue Million Forecast, by Region 2020 & 2033
- Table 5: Global E-liquid Industry Revenue Million Forecast, by Product Type 2020 & 2033
- Table 6: Global E-liquid Industry Revenue Million Forecast, by Distribution Channel 2020 & 2033
- Table 7: Global E-liquid Industry Revenue Million Forecast, by Geography 2020 & 2033
- Table 8: Global E-liquid Industry Revenue Million Forecast, by Country 2020 & 2033
- Table 9: Global E-liquid Industry Revenue Million Forecast, by Product Type 2020 & 2033
- Table 10: Global E-liquid Industry Revenue Million Forecast, by Distribution Channel 2020 & 2033
- Table 11: Global E-liquid Industry Revenue Million Forecast, by Geography 2020 & 2033
- Table 12: Global E-liquid Industry Revenue Million Forecast, by Country 2020 & 2033
- Table 13: Global E-liquid Industry Revenue Million Forecast, by Product Type 2020 & 2033
- Table 14: Global E-liquid Industry Revenue Million Forecast, by Distribution Channel 2020 & 2033
- Table 15: Global E-liquid Industry Revenue Million Forecast, by Geography 2020 & 2033
- Table 16: Global E-liquid Industry Revenue Million Forecast, by Country 2020 & 2033
- Table 17: Global E-liquid Industry Revenue Million Forecast, by Product Type 2020 & 2033
- Table 18: Global E-liquid Industry Revenue Million Forecast, by Distribution Channel 2020 & 2033
- Table 19: Global E-liquid Industry Revenue Million Forecast, by Geography 2020 & 2033
- Table 20: Global E-liquid Industry Revenue Million Forecast, by Country 2020 & 2033
- Table 21: Global E-liquid Industry Revenue Million Forecast, by Product Type 2020 & 2033
- Table 22: Global E-liquid Industry Revenue Million Forecast, by Distribution Channel 2020 & 2033
- Table 23: Global E-liquid Industry Revenue Million Forecast, by Geography 2020 & 2033
- Table 24: Global E-liquid Industry Revenue Million Forecast, by Country 2020 & 2033
- Table 25: Global E-liquid Industry Revenue Million Forecast, by Product Type 2020 & 2033
- Table 26: Global E-liquid Industry Revenue Million Forecast, by Distribution Channel 2020 & 2033
- Table 27: Global E-liquid Industry Revenue Million Forecast, by Geography 2020 & 2033
- Table 28: Global E-liquid Industry Revenue Million Forecast, by Country 2020 & 2033
- Table 29: Global E-liquid Industry Revenue Million Forecast, by Product Type 2020 & 2033
- Table 30: Global E-liquid Industry Revenue Million Forecast, by Distribution Channel 2020 & 2033
- Table 31: Global E-liquid Industry Revenue Million Forecast, by Geography 2020 & 2033
- Table 32: Global E-liquid Industry Revenue Million Forecast, by Country 2020 & 2033
Frequently Asked Questions
1. What is the projected Compound Annual Growth Rate (CAGR) of the E-liquid Industry?
The projected CAGR is approximately 18.20%.
2. Which companies are prominent players in the E-liquid Industry?
Key companies in the market include RITCHY GROUP, Innokin Technology, Philip Morris International Inc, Joyetech Group, Ecigs Solutions Ltd, Intellicig Inc, Aspire, KangerTech, British American Tobacco, VIP Electronic Cigarettes.
3. What are the main segments of the E-liquid Industry?
The market segments include Product Type, Distribution Channel, Geography.
4. Can you provide details about the market size?
The market size is estimated to be USD 128.70 Million as of 2022.
5. What are some drivers contributing to market growth?
Aggressive Social Media Marketing; Lower-risk Factor Associated with the Use of E-Cigarettes Compared to Conventional/Combustible Cigarettes.
6. What are the notable trends driving market growth?
Penetration of E-cigarettes in Organized Retail.
7. Are there any restraints impacting market growth?
Government Initiatives to Ban Disposable E-Cigarettes.
8. Can you provide examples of recent developments in the market?
In April 2022, RELX International, a multinational electronic cigarettes company, lauds the recent decision by Egyptian authorities to allow the legal import and commercialization of e-cigarette products in the country. The lifting of the ban highlights the Egyptian authorities' progressive approach to e-cigarettes. It sets the stage for creating a regulated market rich with business opportunities by serving the demand for easily accessible, quality products by legal age (adult) consumers across the country.
9. What pricing options are available for accessing the report?
Pricing options include single-user, multi-user, and enterprise licenses priced at USD 4750, USD 5250, and USD 8750 respectively.
10. Is the market size provided in terms of value or volume?
The market size is provided in terms of value, measured in Million.
11. Are there any specific market keywords associated with the report?
Yes, the market keyword associated with the report is "E-liquid Industry," which aids in identifying and referencing the specific market segment covered.
12. How do I determine which pricing option suits my needs best?
The pricing options vary based on user requirements and access needs. Individual users may opt for single-user licenses, while businesses requiring broader access may choose multi-user or enterprise licenses for cost-effective access to the report.
13. Are there any additional resources or data provided in the E-liquid Industry report?
While the report offers comprehensive insights, it's advisable to review the specific contents or supplementary materials provided to ascertain if additional resources or data are available.
14. How can I stay updated on further developments or reports in the E-liquid Industry?
To stay informed about further developments, trends, and reports in the E-liquid Industry, consider subscribing to industry newsletters, following relevant companies and organizations, or regularly checking reputable industry news sources and publications.
Methodology
Step 1 - Identification of Relevant Samples Size from Population Database


Step 2 - Approaches for Defining Global Market Size (Value, Volume* & Price*)

Note*: In applicable scenarios
Step 3 - Data Sources
Primary Research
- Web Analytics
- Survey Reports
- Research Institute
- Latest Research Reports
- Opinion Leaders
Secondary Research
- Annual Reports
- White Paper
- Latest Press Release
- Industry Association
- Paid Database
- Investor Presentations

Step 4 - Data Triangulation
Involves using different sources of information in order to increase the validity of a study
These sources are likely to be stakeholders in a program - participants, other researchers, program staff, other community members, and so on.
Then we put all data in single framework & apply various statistical tools to find out the dynamic on the market.
During the analysis stage, feedback from the stakeholder groups would be compared to determine areas of agreement as well as areas of divergence