

Key Insights
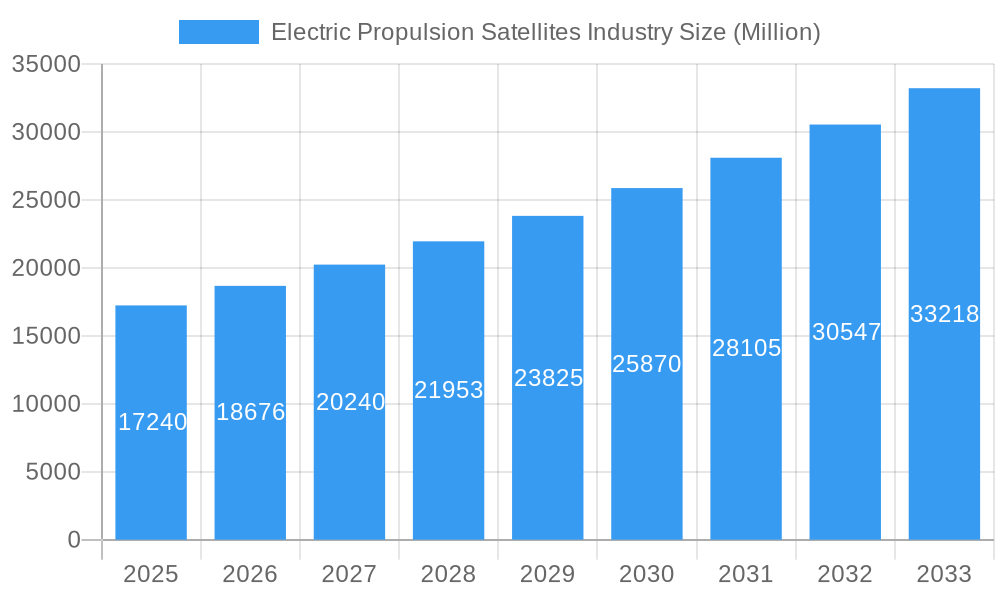
The global Electric Propulsion Satellites Industry is poised for robust expansion, driven by the increasing demand for more efficient and cost-effective satellite operations. The market is projected to reach USD 17.24 billion in 2025, demonstrating a compelling CAGR of 8.4% during the forecast period of 2025-2033. This significant growth is fueled by several key factors. The escalating need for sophisticated satellite functionalities in telecommunications, Earth observation, and defense applications necessitates advanced propulsion systems. Electric propulsion, with its high specific impulse and lower propellant mass requirements, offers substantial advantages over traditional chemical propulsion, leading to reduced launch costs and extended mission durations. Furthermore, the burgeoning growth of the small satellite market, characterized by constellations for broadband internet and advanced remote sensing, is a major catalyst. As the cost of space access continues to decline and mission complexity increases, electric propulsion solutions are becoming indispensable for achieving operational flexibility and mission success.
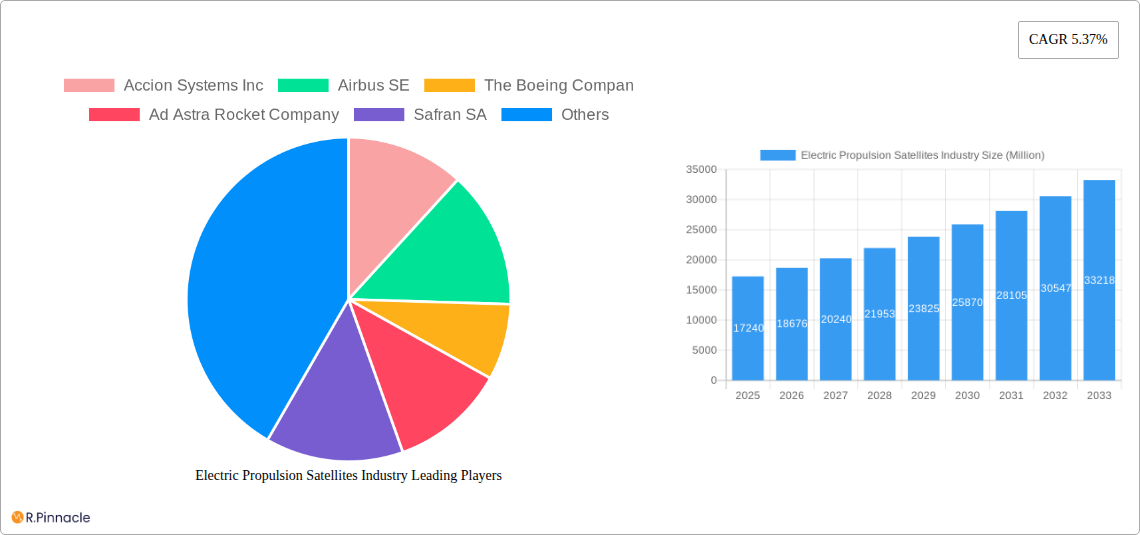
Electric Propulsion Satellites Industry Market Size (In Billion)
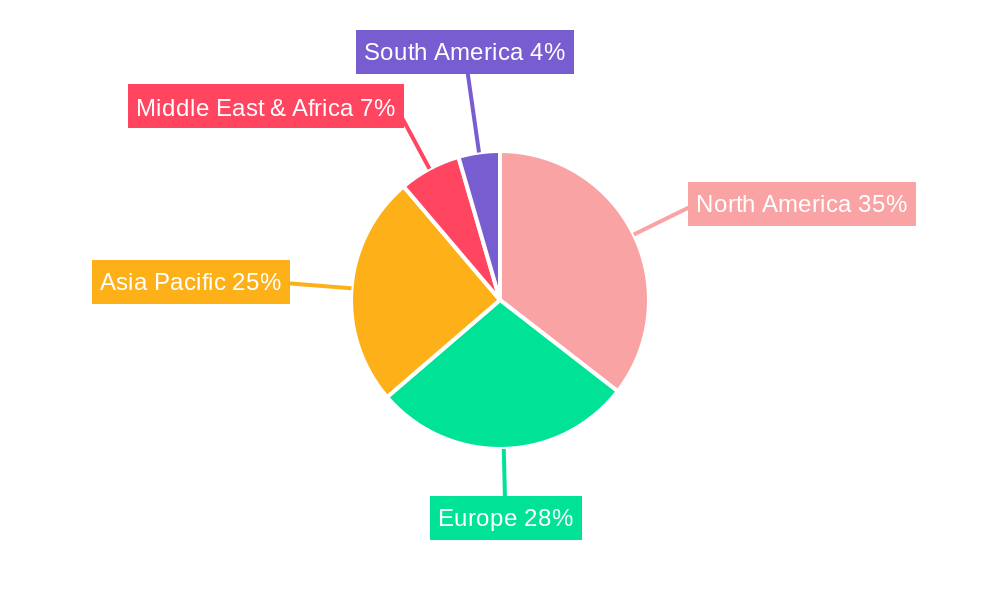
The industry is experiencing a dynamic shift towards full-electric propulsion systems, with hybrid systems also maintaining a significant presence, catering to diverse mission requirements. The end-user landscape is dominated by commercial applications, including satellite internet providers, Earth observation companies, and scientific research initiatives. However, the military segment is also showing substantial growth, driven by the need for enhanced satellite maneuverability, rapid orbital adjustments, and extended surveillance capabilities. Geographically, North America, particularly the United States, is expected to lead the market due to significant government investments in space exploration and a thriving commercial space sector. Asia Pacific, led by China and India, is also anticipated to exhibit rapid growth, driven by government initiatives to expand space capabilities and increasing private sector participation. Key players like Accion Systems Inc., Airbus SE, and The Boeing Company are actively investing in research and development to innovate and expand their product portfolios, further stimulating market growth and technological advancement.
Electric Propulsion Satellites Industry Company Market Share
This comprehensive report delivers a definitive analysis of the Electric Propulsion Satellites industry, a rapidly evolving sector critical for modern space operations. Leveraging unparalleled market intelligence, we provide actionable insights for stakeholders navigating this dynamic landscape. The study encompasses a detailed examination of market structure, growth drivers, regional dominance, product innovations, and future outlook, projecting the market to reach XXX billion USD by 2033. The analysis covers the historical period from 2019 to 2024, with a base year of 2025 and a robust forecast period extending to 2033, offering a deep dive into the XXX billion USD market.
Electric Propulsion Satellites Industry Market Structure & Innovation Trends
The Electric Propulsion Satellites industry exhibits a moderately concentrated market structure, with a few major players holding significant market share. Innovation is primarily driven by advancements in thrust efficiency, miniaturization, and increased power processing capabilities. Regulatory frameworks are evolving, focusing on space debris mitigation and standardization of propulsion technologies, impacting market entry and product development. Product substitutes, while nascent, include advanced chemical propulsion systems, but the long-term operational cost and efficiency benefits of electric propulsion continue to drive adoption. End-user demographics are expanding beyond traditional government and military applications to include a growing commercial satellite constellation market, with an increasing demand for cost-effective and sustainable orbit raising and station-keeping solutions. Mergers and acquisitions (M&A) are a notable trend, with deal values estimated to be in the billions of USD, as key companies seek to consolidate expertise, expand their product portfolios, and secure market leadership. Key players are actively investing in research and development to push the boundaries of electric propulsion technology.
- Market Concentration: Moderately concentrated, with key players investing heavily in R&D and strategic acquisitions.
- Innovation Drivers: Increased thrust efficiency, miniaturization, higher power processing units, and extended mission lifespans.
- Regulatory Frameworks: Evolving regulations focused on space sustainability, debris mitigation, and international collaboration.
- Product Substitutes: Advanced chemical propulsion (limited long-term viability for specific applications).
- End-User Demographics: Growth in commercial satellite constellations (LEO, MEO, GEO), government, and military applications.
- M&A Activities: Strategic acquisitions and partnerships to gain technological edge and market access, with deal values estimated in the billions.
Electric Propulsion Satellites Industry Market Dynamics & Trends
The Electric Propulsion Satellites industry is poised for significant growth, fueled by a confluence of technological advancements, increasing demand for satellite services, and the push for more sustainable and cost-effective space missions. The Compound Annual Growth Rate (CAGR) is projected to be exceptionally strong, indicating a substantial market expansion over the forecast period. Market penetration of electric propulsion systems is accelerating as their advantages in terms of higher specific impulse, longer operational lifetimes, and reduced propellant mass become more compelling for a wider range of satellite applications. Key growth drivers include the proliferation of small satellites and mega-constellations, requiring efficient and reliable propulsion for deployment, orbit maintenance, and de-orbiting. Technological disruptions are centered on the development of next-generation thruster technologies, such as advanced Hall thrusters, ion engines, and electric field thrusters, offering higher power densities and improved performance. Consumer preferences are shifting towards solutions that offer lower launch costs and longer mission durations, directly benefiting electric propulsion. Competitive dynamics are intensifying, with established aerospace giants and agile startups vying for market share through product innovation, strategic partnerships, and competitive pricing. The increasing demand for on-orbit servicing and debris removal missions also presents a significant growth avenue. The global market for electric propulsion systems is expected to reach hundreds of billions of USD by 2033.
Dominant Regions & Segments in Electric Propulsion Satellites Industry
North America, particularly the United States, currently dominates the Electric Propulsion Satellites industry, driven by robust government investment in space exploration and defense, a thriving commercial satellite sector, and the presence of leading research institutions and manufacturers. The Commercial segment is exhibiting the most significant growth, propelled by the exponential rise in small satellite constellations for telecommunications, Earth observation, and internet connectivity. Within propulsion types, the Full Electric segment is expected to see widespread adoption due to its inherent efficiency and suitability for long-duration missions.
Key Drivers for Regional and Segment Dominance:
- Economic Policies: Favorable government funding for space programs, tax incentives for R&D, and a strong venture capital ecosystem in North America.
- Infrastructure: Presence of advanced manufacturing facilities, launch providers, and skilled workforce.
- Technological Innovation: Leading research and development in advanced propulsion systems and satellite technology.
- Market Demand: High demand for satellite-based services from both commercial and governmental entities.
Dominance Analysis:
- Leading Region: North America (specifically the USA) due to strong governmental and commercial investment.
- Dominant Segment (End User): Commercial, driven by the growth of satellite constellations.
- Dominant Segment (Propulsion Type): Full Electric, due to its efficiency and suitability for a wide array of missions.
- Emerging Regions: Europe and Asia-Pacific are rapidly growing, fueled by increasing governmental space initiatives and the burgeoning private space sector.
Electric Propulsion Satellites Industry Product Innovations
Product innovations in the Electric Propulsion Satellites industry are focused on enhancing performance, reliability, and miniaturization. Companies are developing thrusters with higher thrust-to-power ratios, improved propellant utilization, and extended operational lifespans, enabling longer and more complex missions. Advancements in power processing units (PPUs) are crucial for efficiently managing the high electrical power required for these systems. Innovations in propellant management systems and advanced materials are also contributing to improved efficiency and reduced system weight. These developments offer competitive advantages by enabling smaller, lighter, and more capable satellites, thereby reducing launch costs and expanding mission possibilities. The market is witnessing a trend towards modular and scalable electric propulsion systems to cater to diverse satellite sizes and mission requirements.
Report Scope & Segmentation Analysis
This report meticulously analyzes the Electric Propulsion Satellites industry across key segments to provide a comprehensive market overview. The segmentation includes an in-depth examination of:
Propulsion Type:
- Full Electric: Characterized by the use of electric power for both ionization and acceleration of propellant. This segment is projected to witness substantial growth due to its high specific impulse and efficiency, ideal for long-duration missions and satellite constellations. Market size is estimated to be in the billions of USD.
- Hybrid: Combines electric propulsion with a chemical component for thrust augmentation or specific mission phases. This segment offers a balance of performance and responsiveness, catering to a diverse range of applications.
End User:
- Commercial: Encompasses telecommunications, Earth observation, internet of things (IoT), and satellite internet services. This segment is a primary growth engine, driven by the proliferation of LEO constellations.
- Military: Includes applications for defense, surveillance, reconnaissance, and secure communications. Government and defense budgets are significant contributors to this segment, ensuring continued demand for advanced propulsion.
Each segment's market size, growth projections, and competitive dynamics are analyzed throughout the study period (2019–2033), with a base year of 2025.
Key Drivers of Electric Propulsion Satellites Industry Growth
The Electric Propulsion Satellites industry is experiencing robust growth driven by several key factors. The increasing demand for satellite services, particularly in telecommunications and Earth observation, necessitates more efficient and cost-effective propulsion solutions. The proliferation of small satellite constellations, including those for global internet access, directly benefits from the low-mass and high-efficiency characteristics of electric propulsion. Technological advancements, such as higher specific impulse, extended mission lifespans, and miniaturization of thrusters, are making electric propulsion increasingly viable for a broader range of applications. Furthermore, the growing focus on space sustainability and debris mitigation favors electric propulsion systems for de-orbiting capabilities. Economic factors, including reduced launch costs achieved through lighter propulsion systems, also contribute significantly to market expansion.
Challenges in the Electric Propulsion Satellites Industry Sector
Despite its immense growth potential, the Electric Propulsion Satellites industry faces several challenges. High initial development costs for advanced electric propulsion systems can be a barrier for smaller companies. Technical complexities and reliability concerns in space environments, particularly for long-duration missions, require rigorous testing and validation. Supply chain constraints for specialized components and raw materials can impact production timelines and costs. Furthermore, evolving regulatory frameworks and standardization challenges can create uncertainty for manufacturers. Competitive pressures from established chemical propulsion technologies for certain niche applications also pose a restraint. The demand for higher power levels and the associated power generation and thermal management solutions present ongoing engineering hurdles, with estimated impact on development timelines and costs in the millions to billions of USD.
Emerging Opportunities in Electric Propulsion Satellites Industry
The Electric Propulsion Satellites industry is ripe with emerging opportunities. The growing demand for in-orbit servicing, assembly, and manufacturing (ISAM) presents a significant avenue for electric propulsion, enabling precise maneuvering and station-keeping. The development of propellantless propulsion technologies, while still in early research stages, could revolutionize space travel. The expansion of the lunar and Mars exploration missions, both governmental and commercial, will require highly efficient and long-duration propulsion systems. Furthermore, the increasing focus on space situational awareness and active debris removal creates new markets for specialized electric propulsion systems. The adoption of electric propulsion for large constellations in lower Earth orbits will continue to drive market growth and technological innovation. The global market value for these opportunities is estimated to be in the tens of billions of USD.
Leading Players in the Electric Propulsion Satellites Industry Market
- Accion Systems Inc
- Airbus SE
- The Boeing Company
- Ad Astra Rocket Company
- Safran SA
- Thales
- Aerojet Rocketdyne Holdings Inc
- Sitael S p A
- Busek Co Inc
- Northrop Grumman Corporation
Key Developments in Electric Propulsion Satellites Industry Industry
- 2023: Sitael S p A successfully tested its advanced Hall effect thruster for next-generation satellite platforms, enhancing mission capabilities.
- 2023: Accion Systems Inc secured significant funding for the development of its Tiled Ion Thruster, promising higher thrust for commercial applications.
- 2022: Airbus SE announced the integration of its advanced electric propulsion systems on multiple commercial satellite platforms, underscoring market adoption.
- 2022: Northrop Grumman Corporation showcased its Hall effect thruster technology for demanding military satellite applications, highlighting reliability and performance.
- 2021: Safran SA expanded its portfolio with the acquisition of a key player in electric propulsion components, strengthening its market position.
- 2020: The Boeing Company continued its research into advanced electric propulsion concepts for future deep space missions.
- 2019: Aerojet Rocketdyne Holdings Inc demonstrated enhanced performance from its X-37B solar electric propulsion system, indicating continued progress.
Future Outlook for Electric Propulsion Satellites Industry Market
The future outlook for the Electric Propulsion Satellites industry is exceptionally bright, driven by sustained innovation and increasing adoption across diverse applications. The market is expected to experience significant expansion in the coming years, potentially reaching hundreds of billions of USD. Growth accelerators include the continuous miniaturization of satellites, the demand for longer and more ambitious space missions, and the ongoing development of more powerful and efficient electric propulsion technologies. Strategic opportunities lie in expanding into emerging markets like in-orbit servicing and space resource utilization. Companies that can offer scalable, high-performance, and cost-effective electric propulsion solutions will be well-positioned to capitalize on this robust market growth. The industry is poised to play a pivotal role in the future of space exploration and commercialization.
Electric Propulsion Satellites Industry Segmentation
-
1. Propulsion Type
- 1.1. Full Electric
- 1.2. Hybrid
-
2. End User
- 2.1. Commercial
- 2.2. Military
Electric Propulsion Satellites Industry Segmentation By Geography
-
1. North America
- 1.1. United States
- 1.2. Canada
- 1.3. Mexico
-
2. South America
- 2.1. Brazil
- 2.2. Argentina
- 2.3. Rest of South America
-
3. Europe
- 3.1. United Kingdom
- 3.2. Germany
- 3.3. France
- 3.4. Italy
- 3.5. Spain
- 3.6. Russia
- 3.7. Benelux
- 3.8. Nordics
- 3.9. Rest of Europe
-
4. Middle East & Africa
- 4.1. Turkey
- 4.2. Israel
- 4.3. GCC
- 4.4. North Africa
- 4.5. South Africa
- 4.6. Rest of Middle East & Africa
-
5. Asia Pacific
- 5.1. China
- 5.2. India
- 5.3. Japan
- 5.4. South Korea
- 5.5. ASEAN
- 5.6. Oceania
- 5.7. Rest of Asia Pacific
Electric Propulsion Satellites Industry Regional Market Share
Geographic Coverage of Electric Propulsion Satellites Industry
Electric Propulsion Satellites Industry REPORT HIGHLIGHTS
| Aspects | Details |
|---|---|
| Study Period | 2020-2034 |
| Base Year | 2025 |
| Estimated Year | 2026 |
| Forecast Period | 2026-2034 |
| Historical Period | 2020-2025 |
| Growth Rate | CAGR of 13.7% from 2020-2034 |
| Segmentation |
|
Table of Contents
- 1. Introduction
- 1.1. Research Scope
- 1.2. Market Segmentation
- 1.3. Research Objective
- 1.4. Definitions and Assumptions
- 2. Executive Summary
- 2.1. Market Snapshot
- 3. Market Dynamics
- 3.1. Market Drivers
- 3.2. Market Restrains
- 3.3. Market Trends
- 3.4. Market Opportunities
- 4. Market Factor Analysis
- 4.1. Porters Five Forces
- 4.1.1. Bargaining Power of Suppliers
- 4.1.2. Bargaining Power of Buyers
- 4.1.3. Threat of New Entrants
- 4.1.4. Threat of Substitutes
- 4.1.5. Competitive Rivalry
- 4.2. PESTEL analysis
- 4.3. BCG Analysis
- 4.3.1. Stars (High Growth, High Market Share)
- 4.3.2. Cash Cows (Low Growth, High Market Share)
- 4.3.3. Question Mark (High Growth, Low Market Share)
- 4.3.4. Dogs (Low Growth, Low Market Share)
- 4.4. Ansoff Matrix Analysis
- 4.5. Supply Chain Analysis
- 4.6. Regulatory Landscape
- 4.7. Current Market Potential and Opportunity Assessment (TAM–SAM–SOM Framework)
- 4.8. PRI Analyst Note
- 4.1. Porters Five Forces
- 5. Market Analysis, Insights and Forecast 2021-2033
- 5.1. Market Analysis, Insights and Forecast - by Propulsion Type
- 5.1.1. Full Electric
- 5.1.2. Hybrid
- 5.2. Market Analysis, Insights and Forecast - by End User
- 5.2.1. Commercial
- 5.2.2. Military
- 5.3. Market Analysis, Insights and Forecast - by Region
- 5.3.1. North America
- 5.3.2. South America
- 5.3.3. Europe
- 5.3.4. Middle East & Africa
- 5.3.5. Asia Pacific
- 5.1. Market Analysis, Insights and Forecast - by Propulsion Type
- 6. Global Electric Propulsion Satellites Industry Analysis, Insights and Forecast, 2021-2033
- 6.1. Market Analysis, Insights and Forecast - by Propulsion Type
- 6.1.1. Full Electric
- 6.1.2. Hybrid
- 6.2. Market Analysis, Insights and Forecast - by End User
- 6.2.1. Commercial
- 6.2.2. Military
- 6.1. Market Analysis, Insights and Forecast - by Propulsion Type
- 7. North America Electric Propulsion Satellites Industry Analysis, Insights and Forecast, 2020-2032
- 7.1. Market Analysis, Insights and Forecast - by Propulsion Type
- 7.1.1. Full Electric
- 7.1.2. Hybrid
- 7.2. Market Analysis, Insights and Forecast - by End User
- 7.2.1. Commercial
- 7.2.2. Military
- 7.1. Market Analysis, Insights and Forecast - by Propulsion Type
- 8. South America Electric Propulsion Satellites Industry Analysis, Insights and Forecast, 2020-2032
- 8.1. Market Analysis, Insights and Forecast - by Propulsion Type
- 8.1.1. Full Electric
- 8.1.2. Hybrid
- 8.2. Market Analysis, Insights and Forecast - by End User
- 8.2.1. Commercial
- 8.2.2. Military
- 8.1. Market Analysis, Insights and Forecast - by Propulsion Type
- 9. Europe Electric Propulsion Satellites Industry Analysis, Insights and Forecast, 2020-2032
- 9.1. Market Analysis, Insights and Forecast - by Propulsion Type
- 9.1.1. Full Electric
- 9.1.2. Hybrid
- 9.2. Market Analysis, Insights and Forecast - by End User
- 9.2.1. Commercial
- 9.2.2. Military
- 9.1. Market Analysis, Insights and Forecast - by Propulsion Type
- 10. Middle East & Africa Electric Propulsion Satellites Industry Analysis, Insights and Forecast, 2020-2032
- 10.1. Market Analysis, Insights and Forecast - by Propulsion Type
- 10.1.1. Full Electric
- 10.1.2. Hybrid
- 10.2. Market Analysis, Insights and Forecast - by End User
- 10.2.1. Commercial
- 10.2.2. Military
- 10.1. Market Analysis, Insights and Forecast - by Propulsion Type
- 11. Asia Pacific Electric Propulsion Satellites Industry Analysis, Insights and Forecast, 2020-2032
- 11.1. Market Analysis, Insights and Forecast - by Propulsion Type
- 11.1.1. Full Electric
- 11.1.2. Hybrid
- 11.2. Market Analysis, Insights and Forecast - by End User
- 11.2.1. Commercial
- 11.2.2. Military
- 11.1. Market Analysis, Insights and Forecast - by Propulsion Type
- 12. Competitive Analysis
- 12.1. Company Profiles
- 12.1.1 Accion Systems Inc
- 12.1.1.1. Company Overview
- 12.1.1.2. Products
- 12.1.1.3. Company Financials
- 12.1.1.4. SWOT Analysis
- 12.1.2 Airbus SE
- 12.1.2.1. Company Overview
- 12.1.2.2. Products
- 12.1.2.3. Company Financials
- 12.1.2.4. SWOT Analysis
- 12.1.3 The Boeing Compan
- 12.1.3.1. Company Overview
- 12.1.3.2. Products
- 12.1.3.3. Company Financials
- 12.1.3.4. SWOT Analysis
- 12.1.4 Ad Astra Rocket Company
- 12.1.4.1. Company Overview
- 12.1.4.2. Products
- 12.1.4.3. Company Financials
- 12.1.4.4. SWOT Analysis
- 12.1.5 Safran SA
- 12.1.5.1. Company Overview
- 12.1.5.2. Products
- 12.1.5.3. Company Financials
- 12.1.5.4. SWOT Analysis
- 12.1.6 Thales
- 12.1.6.1. Company Overview
- 12.1.6.2. Products
- 12.1.6.3. Company Financials
- 12.1.6.4. SWOT Analysis
- 12.1.7 Aerojet Rocketdyne Holdings Inc
- 12.1.7.1. Company Overview
- 12.1.7.2. Products
- 12.1.7.3. Company Financials
- 12.1.7.4. SWOT Analysis
- 12.1.8 Sitael S p A
- 12.1.8.1. Company Overview
- 12.1.8.2. Products
- 12.1.8.3. Company Financials
- 12.1.8.4. SWOT Analysis
- 12.1.9 Busek Co Inc
- 12.1.9.1. Company Overview
- 12.1.9.2. Products
- 12.1.9.3. Company Financials
- 12.1.9.4. SWOT Analysis
- 12.1.10 Northrop Grumman Corporation
- 12.1.10.1. Company Overview
- 12.1.10.2. Products
- 12.1.10.3. Company Financials
- 12.1.10.4. SWOT Analysis
- 12.1.1 Accion Systems Inc
- 12.2. Market Entropy
- 12.2.1 Company's Key Areas Served
- 12.2.2 Recent Developments
- 12.3. Company Market Share Analysis 2025
- 12.3.1 Top 5 Companies Market Share Analysis
- 12.3.2 Top 3 Companies Market Share Analysis
- 12.4. List of Potential Customers
- 13. Research Methodology
List of Figures
- Figure 1: Global Electric Propulsion Satellites Industry Revenue Breakdown (billion, %) by Region 2025 & 2033
- Figure 2: North America Electric Propulsion Satellites Industry Revenue (billion), by Propulsion Type 2025 & 2033
- Figure 3: North America Electric Propulsion Satellites Industry Revenue Share (%), by Propulsion Type 2025 & 2033
- Figure 4: North America Electric Propulsion Satellites Industry Revenue (billion), by End User 2025 & 2033
- Figure 5: North America Electric Propulsion Satellites Industry Revenue Share (%), by End User 2025 & 2033
- Figure 6: North America Electric Propulsion Satellites Industry Revenue (billion), by Country 2025 & 2033
- Figure 7: North America Electric Propulsion Satellites Industry Revenue Share (%), by Country 2025 & 2033
- Figure 8: South America Electric Propulsion Satellites Industry Revenue (billion), by Propulsion Type 2025 & 2033
- Figure 9: South America Electric Propulsion Satellites Industry Revenue Share (%), by Propulsion Type 2025 & 2033
- Figure 10: South America Electric Propulsion Satellites Industry Revenue (billion), by End User 2025 & 2033
- Figure 11: South America Electric Propulsion Satellites Industry Revenue Share (%), by End User 2025 & 2033
- Figure 12: South America Electric Propulsion Satellites Industry Revenue (billion), by Country 2025 & 2033
- Figure 13: South America Electric Propulsion Satellites Industry Revenue Share (%), by Country 2025 & 2033
- Figure 14: Europe Electric Propulsion Satellites Industry Revenue (billion), by Propulsion Type 2025 & 2033
- Figure 15: Europe Electric Propulsion Satellites Industry Revenue Share (%), by Propulsion Type 2025 & 2033
- Figure 16: Europe Electric Propulsion Satellites Industry Revenue (billion), by End User 2025 & 2033
- Figure 17: Europe Electric Propulsion Satellites Industry Revenue Share (%), by End User 2025 & 2033
- Figure 18: Europe Electric Propulsion Satellites Industry Revenue (billion), by Country 2025 & 2033
- Figure 19: Europe Electric Propulsion Satellites Industry Revenue Share (%), by Country 2025 & 2033
- Figure 20: Middle East & Africa Electric Propulsion Satellites Industry Revenue (billion), by Propulsion Type 2025 & 2033
- Figure 21: Middle East & Africa Electric Propulsion Satellites Industry Revenue Share (%), by Propulsion Type 2025 & 2033
- Figure 22: Middle East & Africa Electric Propulsion Satellites Industry Revenue (billion), by End User 2025 & 2033
- Figure 23: Middle East & Africa Electric Propulsion Satellites Industry Revenue Share (%), by End User 2025 & 2033
- Figure 24: Middle East & Africa Electric Propulsion Satellites Industry Revenue (billion), by Country 2025 & 2033
- Figure 25: Middle East & Africa Electric Propulsion Satellites Industry Revenue Share (%), by Country 2025 & 2033
- Figure 26: Asia Pacific Electric Propulsion Satellites Industry Revenue (billion), by Propulsion Type 2025 & 2033
- Figure 27: Asia Pacific Electric Propulsion Satellites Industry Revenue Share (%), by Propulsion Type 2025 & 2033
- Figure 28: Asia Pacific Electric Propulsion Satellites Industry Revenue (billion), by End User 2025 & 2033
- Figure 29: Asia Pacific Electric Propulsion Satellites Industry Revenue Share (%), by End User 2025 & 2033
- Figure 30: Asia Pacific Electric Propulsion Satellites Industry Revenue (billion), by Country 2025 & 2033
- Figure 31: Asia Pacific Electric Propulsion Satellites Industry Revenue Share (%), by Country 2025 & 2033
List of Tables
- Table 1: Global Electric Propulsion Satellites Industry Revenue billion Forecast, by Propulsion Type 2020 & 2033
- Table 2: Global Electric Propulsion Satellites Industry Revenue billion Forecast, by End User 2020 & 2033
- Table 3: Global Electric Propulsion Satellites Industry Revenue billion Forecast, by Region 2020 & 2033
- Table 4: Global Electric Propulsion Satellites Industry Revenue billion Forecast, by Propulsion Type 2020 & 2033
- Table 5: Global Electric Propulsion Satellites Industry Revenue billion Forecast, by End User 2020 & 2033
- Table 6: Global Electric Propulsion Satellites Industry Revenue billion Forecast, by Country 2020 & 2033
- Table 7: United States Electric Propulsion Satellites Industry Revenue (billion) Forecast, by Application 2020 & 2033
- Table 8: Canada Electric Propulsion Satellites Industry Revenue (billion) Forecast, by Application 2020 & 2033
- Table 9: Mexico Electric Propulsion Satellites Industry Revenue (billion) Forecast, by Application 2020 & 2033
- Table 10: Global Electric Propulsion Satellites Industry Revenue billion Forecast, by Propulsion Type 2020 & 2033
- Table 11: Global Electric Propulsion Satellites Industry Revenue billion Forecast, by End User 2020 & 2033
- Table 12: Global Electric Propulsion Satellites Industry Revenue billion Forecast, by Country 2020 & 2033
- Table 13: Brazil Electric Propulsion Satellites Industry Revenue (billion) Forecast, by Application 2020 & 2033
- Table 14: Argentina Electric Propulsion Satellites Industry Revenue (billion) Forecast, by Application 2020 & 2033
- Table 15: Rest of South America Electric Propulsion Satellites Industry Revenue (billion) Forecast, by Application 2020 & 2033
- Table 16: Global Electric Propulsion Satellites Industry Revenue billion Forecast, by Propulsion Type 2020 & 2033
- Table 17: Global Electric Propulsion Satellites Industry Revenue billion Forecast, by End User 2020 & 2033
- Table 18: Global Electric Propulsion Satellites Industry Revenue billion Forecast, by Country 2020 & 2033
- Table 19: United Kingdom Electric Propulsion Satellites Industry Revenue (billion) Forecast, by Application 2020 & 2033
- Table 20: Germany Electric Propulsion Satellites Industry Revenue (billion) Forecast, by Application 2020 & 2033
- Table 21: France Electric Propulsion Satellites Industry Revenue (billion) Forecast, by Application 2020 & 2033
- Table 22: Italy Electric Propulsion Satellites Industry Revenue (billion) Forecast, by Application 2020 & 2033
- Table 23: Spain Electric Propulsion Satellites Industry Revenue (billion) Forecast, by Application 2020 & 2033
- Table 24: Russia Electric Propulsion Satellites Industry Revenue (billion) Forecast, by Application 2020 & 2033
- Table 25: Benelux Electric Propulsion Satellites Industry Revenue (billion) Forecast, by Application 2020 & 2033
- Table 26: Nordics Electric Propulsion Satellites Industry Revenue (billion) Forecast, by Application 2020 & 2033
- Table 27: Rest of Europe Electric Propulsion Satellites Industry Revenue (billion) Forecast, by Application 2020 & 2033
- Table 28: Global Electric Propulsion Satellites Industry Revenue billion Forecast, by Propulsion Type 2020 & 2033
- Table 29: Global Electric Propulsion Satellites Industry Revenue billion Forecast, by End User 2020 & 2033
- Table 30: Global Electric Propulsion Satellites Industry Revenue billion Forecast, by Country 2020 & 2033
- Table 31: Turkey Electric Propulsion Satellites Industry Revenue (billion) Forecast, by Application 2020 & 2033
- Table 32: Israel Electric Propulsion Satellites Industry Revenue (billion) Forecast, by Application 2020 & 2033
- Table 33: GCC Electric Propulsion Satellites Industry Revenue (billion) Forecast, by Application 2020 & 2033
- Table 34: North Africa Electric Propulsion Satellites Industry Revenue (billion) Forecast, by Application 2020 & 2033
- Table 35: South Africa Electric Propulsion Satellites Industry Revenue (billion) Forecast, by Application 2020 & 2033
- Table 36: Rest of Middle East & Africa Electric Propulsion Satellites Industry Revenue (billion) Forecast, by Application 2020 & 2033
- Table 37: Global Electric Propulsion Satellites Industry Revenue billion Forecast, by Propulsion Type 2020 & 2033
- Table 38: Global Electric Propulsion Satellites Industry Revenue billion Forecast, by End User 2020 & 2033
- Table 39: Global Electric Propulsion Satellites Industry Revenue billion Forecast, by Country 2020 & 2033
- Table 40: China Electric Propulsion Satellites Industry Revenue (billion) Forecast, by Application 2020 & 2033
- Table 41: India Electric Propulsion Satellites Industry Revenue (billion) Forecast, by Application 2020 & 2033
- Table 42: Japan Electric Propulsion Satellites Industry Revenue (billion) Forecast, by Application 2020 & 2033
- Table 43: South Korea Electric Propulsion Satellites Industry Revenue (billion) Forecast, by Application 2020 & 2033
- Table 44: ASEAN Electric Propulsion Satellites Industry Revenue (billion) Forecast, by Application 2020 & 2033
- Table 45: Oceania Electric Propulsion Satellites Industry Revenue (billion) Forecast, by Application 2020 & 2033
- Table 46: Rest of Asia Pacific Electric Propulsion Satellites Industry Revenue (billion) Forecast, by Application 2020 & 2033
Frequently Asked Questions
1. What is the projected Compound Annual Growth Rate (CAGR) of the Electric Propulsion Satellites Industry?
The projected CAGR is approximately 13.7%.
2. Which companies are prominent players in the Electric Propulsion Satellites Industry?
Key companies in the market include Accion Systems Inc, Airbus SE, The Boeing Compan, Ad Astra Rocket Company, Safran SA, Thales, Aerojet Rocketdyne Holdings Inc, Sitael S p A, Busek Co Inc, Northrop Grumman Corporation.
3. What are the main segments of the Electric Propulsion Satellites Industry?
The market segments include Propulsion Type, End User.
4. Can you provide details about the market size?
The market size is estimated to be USD 55.23 billion as of 2022.
5. What are some drivers contributing to market growth?
N/A
6. What are the notable trends driving market growth?
The growing interest of governments and private players in space exploration have fueled the expansion of this market.
7. Are there any restraints impacting market growth?
N/A
8. Can you provide examples of recent developments in the market?
N/A
9. What pricing options are available for accessing the report?
Pricing options include single-user, multi-user, and enterprise licenses priced at USD 3800, USD 4500, and USD 5800 respectively.
10. Is the market size provided in terms of value or volume?
The market size is provided in terms of value, measured in billion.
11. Are there any specific market keywords associated with the report?
Yes, the market keyword associated with the report is "Electric Propulsion Satellites Industry," which aids in identifying and referencing the specific market segment covered.
12. How do I determine which pricing option suits my needs best?
The pricing options vary based on user requirements and access needs. Individual users may opt for single-user licenses, while businesses requiring broader access may choose multi-user or enterprise licenses for cost-effective access to the report.
13. Are there any additional resources or data provided in the Electric Propulsion Satellites Industry report?
While the report offers comprehensive insights, it's advisable to review the specific contents or supplementary materials provided to ascertain if additional resources or data are available.
14. How can I stay updated on further developments or reports in the Electric Propulsion Satellites Industry?
To stay informed about further developments, trends, and reports in the Electric Propulsion Satellites Industry, consider subscribing to industry newsletters, following relevant companies and organizations, or regularly checking reputable industry news sources and publications.
Methodology
Step 1 - Identification of Relevant Samples Size from Population Database


Step 2 - Approaches for Defining Global Market Size (Value, Volume* & Price*)

Note*: In applicable scenarios
Step 3 - Data Sources
Primary Research
- Web Analytics
- Survey Reports
- Research Institute
- Latest Research Reports
- Opinion Leaders
Secondary Research
- Annual Reports
- White Paper
- Latest Press Release
- Industry Association
- Paid Database
- Investor Presentations

Step 4 - Data Triangulation
Involves using different sources of information in order to increase the validity of a study
These sources are likely to be stakeholders in a program - participants, other researchers, program staff, other community members, and so on.
Then we put all data in single framework & apply various statistical tools to find out the dynamic on the market.
During the analysis stage, feedback from the stakeholder groups would be compared to determine areas of agreement as well as areas of divergence