

Key Insights
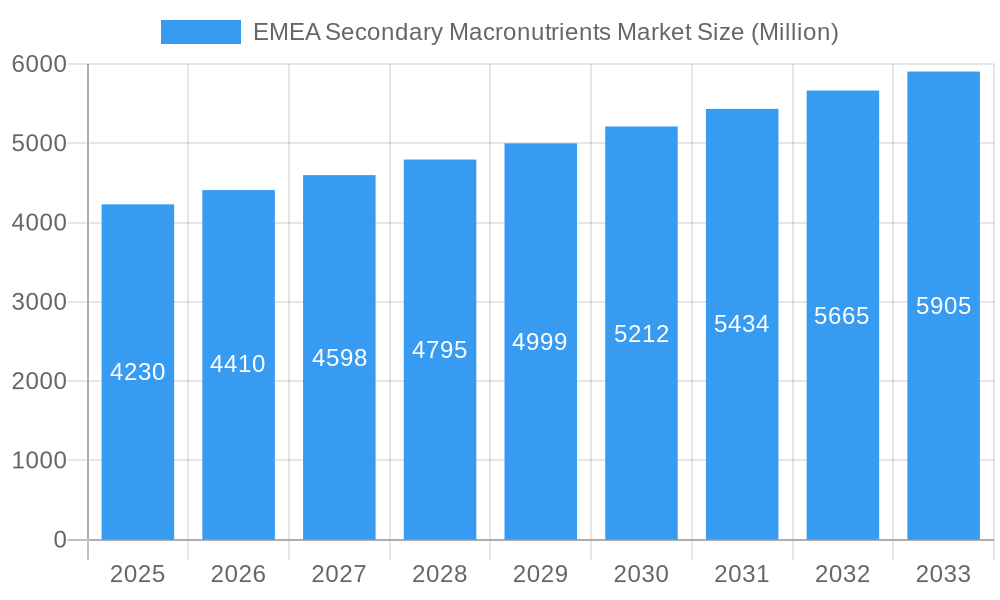
The EMEA Secondary Macronutrients Market, valued at approximately $4.23 billion in 2025, is projected to experience robust growth, driven by increasing agricultural output demands and the rising adoption of sustainable farming practices across the region. The Compound Annual Growth Rate (CAGR) of 4.20% from 2025 to 2033 signifies a consistent market expansion. Key drivers include the growing global population necessitating higher food production, the increasing prevalence of nutrient-deficient soils requiring supplementation, and government initiatives promoting efficient fertilizer utilization and sustainable agriculture. Market segmentation reveals strong demand across various crop types, with grains and cereals, pulses and oilseeds, and fruits and vegetables representing significant market segments. The preference for application methods varies regionally, but both solid and liquid forms continue to hold substantial market shares. Leading players like Haifa Group, Eurochem Group AG, and Yara International ASA are strategically expanding their product portfolios and geographic reach to capitalize on this growth. Competitive pressures are evident, with companies focusing on product innovation, efficient supply chain management, and targeted marketing strategies to maintain market share. The market's growth trajectory is influenced by factors such as fluctuating raw material prices, evolving environmental regulations, and potential disruptions to global supply chains.
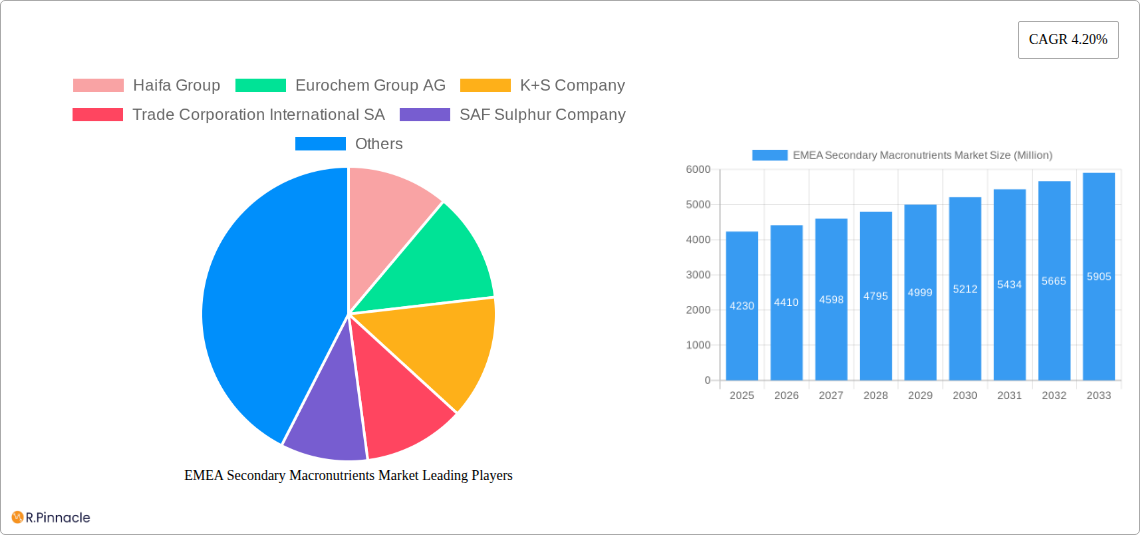
EMEA Secondary Macronutrients Market Market Size (In Billion)
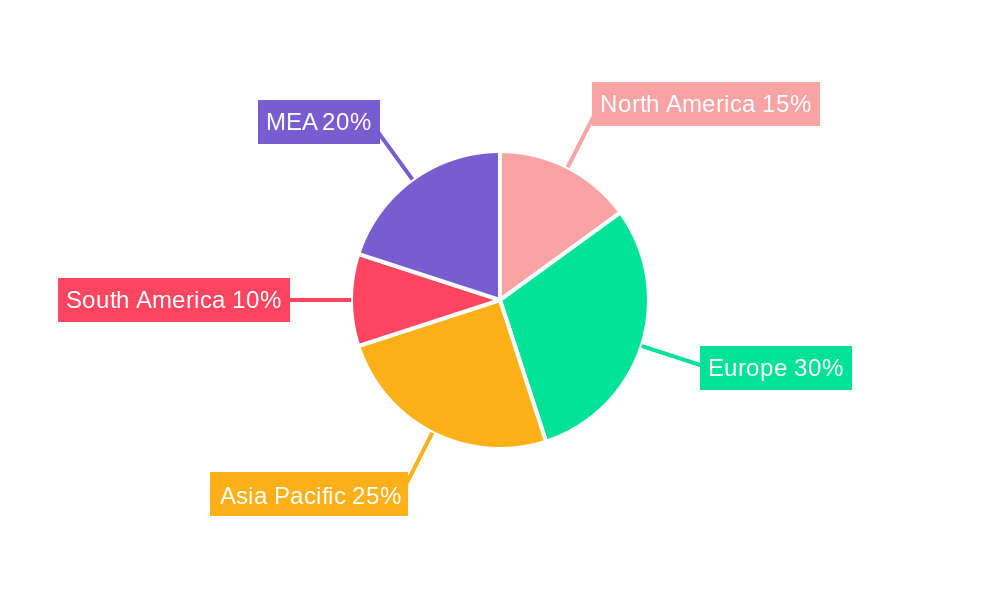
Within the EMEA region, substantial market opportunities exist in countries experiencing rapid agricultural development and increasing food security concerns. While North Africa and the Middle East present significant growth potential, Europe shows a more mature market with focus shifting toward sustainable and precision farming techniques. The market's future expansion will depend on factors such as technological advancements in fertilizer formulation, improved soil testing capabilities, and farmer education programs promoting optimal fertilizer usage. The adoption of precision agriculture, involving targeted nutrient application and data-driven decision-making, will further influence the market's development. Future market analysis should carefully monitor the impact of geopolitical events and climate change on agricultural production and fertilizer demand within the EMEA region.
EMEA Secondary Macronutrients Market Company Market Share
EMEA Secondary Macronutrients Market Report: 2019-2033
This comprehensive report provides an in-depth analysis of the EMEA Secondary Macronutrients Market, offering invaluable insights for industry professionals, investors, and strategic decision-makers. Covering the period 2019-2033, with a focus on 2025, this report meticulously examines market dynamics, growth drivers, challenges, and future opportunities. The study utilizes a robust methodology incorporating historical data (2019-2024), current estimates (2025), and future forecasts (2025-2033) to deliver a clear and actionable understanding of this dynamic market.
EMEA Secondary Macronutrients Market Structure & Innovation Trends
This section analyzes the competitive landscape of the EMEA Secondary Macronutrients market, examining market concentration, innovation drivers, regulatory frameworks, and M&A activities. The market is moderately consolidated, with key players such as Haifa Group, Eurochem Group AG, and K+S Company holding significant market share (exact figures detailed within the report). Innovation is driven by the need for sustainable and efficient agricultural practices, leading to the development of novel formulations and application methods. Stringent environmental regulations across the EMEA region are influencing product development and manufacturing processes. Product substitution is a significant factor, with organic and bio-based alternatives gaining traction. The report includes a detailed analysis of recent M&A activities, including deal values and their impact on market structure. For instance, the xx Million deal between [Company A] and [Company B] in [Year] significantly altered the market share distribution. The report also profiles end-user demographics and their evolving needs.
EMEA Secondary Macronutrients Market Dynamics & Trends
The EMEA Secondary Macronutrients market is experiencing robust growth, driven by several factors. Increasing demand for food and feed, coupled with the growing adoption of intensive farming practices, are key drivers. Technological advancements in fertilizer production and application techniques are improving efficiency and yield, further stimulating market expansion. Consumer preferences for high-quality produce and organic farming methods are also influencing market dynamics. The market exhibits a healthy CAGR of xx% during the forecast period (2025-2033), and market penetration is expected to reach xx% by 2033. Competitive dynamics are characterized by intense competition among established players and the emergence of new entrants. This competitive landscape fosters innovation and drives price competitiveness. The report details the impact of technological disruptions, such as precision farming and digital agriculture, on market growth.
Dominant Regions & Segments in EMEA Secondary Macronutrients Market
This section identifies the leading regions, countries, and segments within the EMEA Secondary Macronutrients market. Western Europe is currently the dominant region, driven by high agricultural output and advanced farming practices. However, Eastern Europe and the Middle East are exhibiting strong growth potential, fueled by rising agricultural investments and government support.
- Nutrient Type: Sulfur currently holds the largest market share, followed by Calcium and Magnesium. The strong demand for sulfur-based fertilizers in cereal production is a major driver.
- Application Method: Solid application methods dominate the market due to established infrastructure and cost-effectiveness. However, liquid application methods are gaining traction due to their precision and efficiency.
- Crop Type: Grains and cereals represent the largest segment, followed by pulses and oilseeds. The growing demand for food security is boosting the use of secondary macronutrients in this area.
Key drivers for regional dominance include favorable economic policies supporting agriculture, robust infrastructure for fertilizer distribution, and access to advanced technology.
EMEA Secondary Macronutrients Market Product Innovations
Recent innovations in the EMEA Secondary Macronutrients market focus on developing sustainable and high-efficiency fertilizers. This includes the introduction of slow-release formulations, micronutrient-enriched blends, and innovative application technologies. These innovations are aimed at improving nutrient use efficiency, reducing environmental impact, and enhancing crop yields. Competition is driving the development of value-added products with improved performance and enhanced features. These innovations are improving the overall market fit by addressing specific needs of farmers and promoting sustainable agricultural practices.
Report Scope & Segmentation Analysis
This report segments the EMEA Secondary Macronutrients market based on nutrient type (Sulfur, Calcium, Magnesium), application method (Solid, Liquid), and crop type (Grains and Cereals, Pulses and Oilseeds, Fruits and Vegetables, Turfs and Ornamentals, Other Crop Types). Each segment’s market size, growth projections, and competitive dynamics are thoroughly analyzed. For example, the Sulfur segment is projected to exhibit a CAGR of xx% during the forecast period, driven by its essential role in crop nutrition. The Solid application method segment currently dominates but faces increasing competition from liquid application technologies. The Grains and Cereals crop segment remains the largest, reflecting the vast acreage dedicated to cereal production across the EMEA region.
Key Drivers of EMEA Secondary Macronutrients Market Growth
Several factors fuel the growth of the EMEA Secondary Macronutrients market. The increasing global demand for food, coupled with rising agricultural productivity requirements, is a primary driver. Government initiatives promoting sustainable agriculture and food security are also stimulating market expansion. Technological advancements in fertilizer production, application, and precision agriculture enhance efficiency and yield, boosting demand. Furthermore, favorable economic conditions in several EMEA countries contribute to increased agricultural investments and fertilizer usage.
Challenges in the EMEA Secondary Macronutrients Market Sector
The EMEA Secondary Macronutrients market faces several challenges. Fluctuations in raw material prices and supply chain disruptions can impact production costs and profitability. Stringent environmental regulations and increasing scrutiny of fertilizer's environmental impact pose significant hurdles. Intense competition from existing players and emerging market entrants puts pressure on pricing and margins. These challenges can impact market growth, profitability, and sustainability. For example, supply chain disruptions caused by [Event] in [Year] resulted in a xx% increase in fertilizer prices.
Emerging Opportunities in EMEA Secondary Macronutrients Market
Despite the challenges, several opportunities exist. The growing adoption of precision agriculture and digital farming technologies creates opportunities for innovative product development and application. The increasing demand for organic and sustainable fertilizers offers significant potential for specialized product offerings. Expansion into emerging markets in Eastern Europe and Africa presents growth prospects. These opportunities can lead to significant market expansion and diversification.
Leading Players in the EMEA Secondary Macronutrients Market Market
- Haifa Group
- Eurochem Group AG
- K+S Company
- Trade Corporation International SA
- SAF Sulphur Company
- Saudi United Fertilizer Company (al-asmida)
- Al-tayseer Chemical Industry
- Israel Chemical Company
- Takamul National Agriculture
- Yara International ASA
Key Developments in EMEA Secondary Macronutrients Market Industry
- Jan 2023: Haifa Group launched a new slow-release sulfur fertilizer.
- Apr 2022: Eurochem Group AG acquired a smaller fertilizer producer, expanding its market share.
- Oct 2021: New EU regulations on fertilizer production came into effect. (Further details on specific developments and their impact will be included in the full report.)
Future Outlook for EMEA Secondary Macronutrients Market Market
The EMEA Secondary Macronutrients market is poised for continued growth, driven by sustained demand for food and feed, technological advancements, and supportive government policies. Strategic partnerships, investments in research and development, and expansion into new markets will be crucial for success. The focus on sustainable and efficient fertilizer solutions will shape the future of this market. The market's future potential is significant, offering attractive opportunities for both established players and new entrants.
EMEA Secondary Macronutrients Market Segmentation
- 1. Production Analysis
- 2. Consumption Analysis
- 3. Import Market Analysis (Value & Volume)
- 4. Export Market Analysis (Value & Volume)
- 5. Price Trend Analysis
EMEA Secondary Macronutrients Market Segmentation By Geography
-
1. North America
- 1.1. United States
- 1.2. Canada
- 1.3. Mexico
-
2. South America
- 2.1. Brazil
- 2.2. Argentina
- 2.3. Rest of South America
-
3. Europe
- 3.1. United Kingdom
- 3.2. Germany
- 3.3. France
- 3.4. Italy
- 3.5. Spain
- 3.6. Russia
- 3.7. Benelux
- 3.8. Nordics
- 3.9. Rest of Europe
-
4. Middle East & Africa
- 4.1. Turkey
- 4.2. Israel
- 4.3. GCC
- 4.4. North Africa
- 4.5. South Africa
- 4.6. Rest of Middle East & Africa
-
5. Asia Pacific
- 5.1. China
- 5.2. India
- 5.3. Japan
- 5.4. South Korea
- 5.5. ASEAN
- 5.6. Oceania
- 5.7. Rest of Asia Pacific
EMEA Secondary Macronutrients Market Regional Market Share
Geographic Coverage of EMEA Secondary Macronutrients Market
EMEA Secondary Macronutrients Market REPORT HIGHLIGHTS
| Aspects | Details |
|---|---|
| Study Period | 2020-2034 |
| Base Year | 2025 |
| Estimated Year | 2026 |
| Forecast Period | 2026-2034 |
| Historical Period | 2020-2025 |
| Growth Rate | CAGR of 4.20% from 2020-2034 |
| Segmentation |
|
Table of Contents
- 1. Introduction
- 1.1. Research Scope
- 1.2. Market Segmentation
- 1.3. Research Objective
- 1.4. Definitions and Assumptions
- 2. Executive Summary
- 2.1. Market Snapshot
- 3. Market Dynamics
- 3.1. Market Drivers
- 3.2. Market Restrains
- 3.3. Market Trends
- 3.4. Market Opportunities
- 4. Market Factor Analysis
- 4.1. Porters Five Forces
- 4.1.1. Bargaining Power of Suppliers
- 4.1.2. Bargaining Power of Buyers
- 4.1.3. Threat of New Entrants
- 4.1.4. Threat of Substitutes
- 4.1.5. Competitive Rivalry
- 4.2. PESTEL analysis
- 4.3. BCG Analysis
- 4.3.1. Stars (High Growth, High Market Share)
- 4.3.2. Cash Cows (Low Growth, High Market Share)
- 4.3.3. Question Mark (High Growth, Low Market Share)
- 4.3.4. Dogs (Low Growth, Low Market Share)
- 4.4. Ansoff Matrix Analysis
- 4.5. Supply Chain Analysis
- 4.6. Regulatory Landscape
- 4.7. Current Market Potential and Opportunity Assessment (TAM–SAM–SOM Framework)
- 4.8. PRI Analyst Note
- 4.1. Porters Five Forces
- 5. Market Analysis, Insights and Forecast 2021-2033
- 5.1. Market Analysis, Insights and Forecast - by Production Analysis
- 5.2. Market Analysis, Insights and Forecast - by Consumption Analysis
- 5.3. Market Analysis, Insights and Forecast - by Import Market Analysis (Value & Volume)
- 5.4. Market Analysis, Insights and Forecast - by Export Market Analysis (Value & Volume)
- 5.5. Market Analysis, Insights and Forecast - by Price Trend Analysis
- 5.6. Market Analysis, Insights and Forecast - by Region
- 5.6.1. North America
- 5.6.2. South America
- 5.6.3. Europe
- 5.6.4. Middle East & Africa
- 5.6.5. Asia Pacific
- 6. Global EMEA Secondary Macronutrients Market Analysis, Insights and Forecast, 2021-2033
- 6.1. Market Analysis, Insights and Forecast - by Production Analysis
- 6.2. Market Analysis, Insights and Forecast - by Consumption Analysis
- 6.3. Market Analysis, Insights and Forecast - by Import Market Analysis (Value & Volume)
- 6.4. Market Analysis, Insights and Forecast - by Export Market Analysis (Value & Volume)
- 6.5. Market Analysis, Insights and Forecast - by Price Trend Analysis
- 7. North America EMEA Secondary Macronutrients Market Analysis, Insights and Forecast, 2020-2032
- 7.1. Market Analysis, Insights and Forecast - by Production Analysis
- 7.2. Market Analysis, Insights and Forecast - by Consumption Analysis
- 7.3. Market Analysis, Insights and Forecast - by Import Market Analysis (Value & Volume)
- 7.4. Market Analysis, Insights and Forecast - by Export Market Analysis (Value & Volume)
- 7.5. Market Analysis, Insights and Forecast - by Price Trend Analysis
- 8. South America EMEA Secondary Macronutrients Market Analysis, Insights and Forecast, 2020-2032
- 8.1. Market Analysis, Insights and Forecast - by Production Analysis
- 8.2. Market Analysis, Insights and Forecast - by Consumption Analysis
- 8.3. Market Analysis, Insights and Forecast - by Import Market Analysis (Value & Volume)
- 8.4. Market Analysis, Insights and Forecast - by Export Market Analysis (Value & Volume)
- 8.5. Market Analysis, Insights and Forecast - by Price Trend Analysis
- 9. Europe EMEA Secondary Macronutrients Market Analysis, Insights and Forecast, 2020-2032
- 9.1. Market Analysis, Insights and Forecast - by Production Analysis
- 9.2. Market Analysis, Insights and Forecast - by Consumption Analysis
- 9.3. Market Analysis, Insights and Forecast - by Import Market Analysis (Value & Volume)
- 9.4. Market Analysis, Insights and Forecast - by Export Market Analysis (Value & Volume)
- 9.5. Market Analysis, Insights and Forecast - by Price Trend Analysis
- 10. Middle East & Africa EMEA Secondary Macronutrients Market Analysis, Insights and Forecast, 2020-2032
- 10.1. Market Analysis, Insights and Forecast - by Production Analysis
- 10.2. Market Analysis, Insights and Forecast - by Consumption Analysis
- 10.3. Market Analysis, Insights and Forecast - by Import Market Analysis (Value & Volume)
- 10.4. Market Analysis, Insights and Forecast - by Export Market Analysis (Value & Volume)
- 10.5. Market Analysis, Insights and Forecast - by Price Trend Analysis
- 11. Asia Pacific EMEA Secondary Macronutrients Market Analysis, Insights and Forecast, 2020-2032
- 11.1. Market Analysis, Insights and Forecast - by Production Analysis
- 11.2. Market Analysis, Insights and Forecast - by Consumption Analysis
- 11.3. Market Analysis, Insights and Forecast - by Import Market Analysis (Value & Volume)
- 11.4. Market Analysis, Insights and Forecast - by Export Market Analysis (Value & Volume)
- 11.5. Market Analysis, Insights and Forecast - by Price Trend Analysis
- 12. Competitive Analysis
- 12.1. Company Profiles
- 12.1.1 Haifa Group
- 12.1.1.1. Company Overview
- 12.1.1.2. Products
- 12.1.1.3. Company Financials
- 12.1.1.4. SWOT Analysis
- 12.1.2 Eurochem Group AG
- 12.1.2.1. Company Overview
- 12.1.2.2. Products
- 12.1.2.3. Company Financials
- 12.1.2.4. SWOT Analysis
- 12.1.3 K+S Company
- 12.1.3.1. Company Overview
- 12.1.3.2. Products
- 12.1.3.3. Company Financials
- 12.1.3.4. SWOT Analysis
- 12.1.4 Trade Corporation International SA
- 12.1.4.1. Company Overview
- 12.1.4.2. Products
- 12.1.4.3. Company Financials
- 12.1.4.4. SWOT Analysis
- 12.1.5 SAF Sulphur Company
- 12.1.5.1. Company Overview
- 12.1.5.2. Products
- 12.1.5.3. Company Financials
- 12.1.5.4. SWOT Analysis
- 12.1.6 Saudi United Fertilizer Company (al-asmida)
- 12.1.6.1. Company Overview
- 12.1.6.2. Products
- 12.1.6.3. Company Financials
- 12.1.6.4. SWOT Analysis
- 12.1.7 Al-tayseer Chemical Industry
- 12.1.7.1. Company Overview
- 12.1.7.2. Products
- 12.1.7.3. Company Financials
- 12.1.7.4. SWOT Analysis
- 12.1.8 Israel Chemical Company
- 12.1.8.1. Company Overview
- 12.1.8.2. Products
- 12.1.8.3. Company Financials
- 12.1.8.4. SWOT Analysis
- 12.1.9 Takamul National Agriculture
- 12.1.9.1. Company Overview
- 12.1.9.2. Products
- 12.1.9.3. Company Financials
- 12.1.9.4. SWOT Analysis
- 12.1.10 Yara International ASA
- 12.1.10.1. Company Overview
- 12.1.10.2. Products
- 12.1.10.3. Company Financials
- 12.1.10.4. SWOT Analysis
- 12.1.1 Haifa Group
- 12.2. Market Entropy
- 12.2.1 Company's Key Areas Served
- 12.2.2 Recent Developments
- 12.3. Company Market Share Analysis 2025
- 12.3.1 Top 5 Companies Market Share Analysis
- 12.3.2 Top 3 Companies Market Share Analysis
- 12.4. List of Potential Customers
- 13. Research Methodology
List of Figures
- Figure 1: Global EMEA Secondary Macronutrients Market Revenue Breakdown (Million, %) by Region 2025 & 2033
- Figure 2: North America EMEA Secondary Macronutrients Market Revenue (Million), by Production Analysis 2025 & 2033
- Figure 3: North America EMEA Secondary Macronutrients Market Revenue Share (%), by Production Analysis 2025 & 2033
- Figure 4: North America EMEA Secondary Macronutrients Market Revenue (Million), by Consumption Analysis 2025 & 2033
- Figure 5: North America EMEA Secondary Macronutrients Market Revenue Share (%), by Consumption Analysis 2025 & 2033
- Figure 6: North America EMEA Secondary Macronutrients Market Revenue (Million), by Import Market Analysis (Value & Volume) 2025 & 2033
- Figure 7: North America EMEA Secondary Macronutrients Market Revenue Share (%), by Import Market Analysis (Value & Volume) 2025 & 2033
- Figure 8: North America EMEA Secondary Macronutrients Market Revenue (Million), by Export Market Analysis (Value & Volume) 2025 & 2033
- Figure 9: North America EMEA Secondary Macronutrients Market Revenue Share (%), by Export Market Analysis (Value & Volume) 2025 & 2033
- Figure 10: North America EMEA Secondary Macronutrients Market Revenue (Million), by Price Trend Analysis 2025 & 2033
- Figure 11: North America EMEA Secondary Macronutrients Market Revenue Share (%), by Price Trend Analysis 2025 & 2033
- Figure 12: North America EMEA Secondary Macronutrients Market Revenue (Million), by Country 2025 & 2033
- Figure 13: North America EMEA Secondary Macronutrients Market Revenue Share (%), by Country 2025 & 2033
- Figure 14: South America EMEA Secondary Macronutrients Market Revenue (Million), by Production Analysis 2025 & 2033
- Figure 15: South America EMEA Secondary Macronutrients Market Revenue Share (%), by Production Analysis 2025 & 2033
- Figure 16: South America EMEA Secondary Macronutrients Market Revenue (Million), by Consumption Analysis 2025 & 2033
- Figure 17: South America EMEA Secondary Macronutrients Market Revenue Share (%), by Consumption Analysis 2025 & 2033
- Figure 18: South America EMEA Secondary Macronutrients Market Revenue (Million), by Import Market Analysis (Value & Volume) 2025 & 2033
- Figure 19: South America EMEA Secondary Macronutrients Market Revenue Share (%), by Import Market Analysis (Value & Volume) 2025 & 2033
- Figure 20: South America EMEA Secondary Macronutrients Market Revenue (Million), by Export Market Analysis (Value & Volume) 2025 & 2033
- Figure 21: South America EMEA Secondary Macronutrients Market Revenue Share (%), by Export Market Analysis (Value & Volume) 2025 & 2033
- Figure 22: South America EMEA Secondary Macronutrients Market Revenue (Million), by Price Trend Analysis 2025 & 2033
- Figure 23: South America EMEA Secondary Macronutrients Market Revenue Share (%), by Price Trend Analysis 2025 & 2033
- Figure 24: South America EMEA Secondary Macronutrients Market Revenue (Million), by Country 2025 & 2033
- Figure 25: South America EMEA Secondary Macronutrients Market Revenue Share (%), by Country 2025 & 2033
- Figure 26: Europe EMEA Secondary Macronutrients Market Revenue (Million), by Production Analysis 2025 & 2033
- Figure 27: Europe EMEA Secondary Macronutrients Market Revenue Share (%), by Production Analysis 2025 & 2033
- Figure 28: Europe EMEA Secondary Macronutrients Market Revenue (Million), by Consumption Analysis 2025 & 2033
- Figure 29: Europe EMEA Secondary Macronutrients Market Revenue Share (%), by Consumption Analysis 2025 & 2033
- Figure 30: Europe EMEA Secondary Macronutrients Market Revenue (Million), by Import Market Analysis (Value & Volume) 2025 & 2033
- Figure 31: Europe EMEA Secondary Macronutrients Market Revenue Share (%), by Import Market Analysis (Value & Volume) 2025 & 2033
- Figure 32: Europe EMEA Secondary Macronutrients Market Revenue (Million), by Export Market Analysis (Value & Volume) 2025 & 2033
- Figure 33: Europe EMEA Secondary Macronutrients Market Revenue Share (%), by Export Market Analysis (Value & Volume) 2025 & 2033
- Figure 34: Europe EMEA Secondary Macronutrients Market Revenue (Million), by Price Trend Analysis 2025 & 2033
- Figure 35: Europe EMEA Secondary Macronutrients Market Revenue Share (%), by Price Trend Analysis 2025 & 2033
- Figure 36: Europe EMEA Secondary Macronutrients Market Revenue (Million), by Country 2025 & 2033
- Figure 37: Europe EMEA Secondary Macronutrients Market Revenue Share (%), by Country 2025 & 2033
- Figure 38: Middle East & Africa EMEA Secondary Macronutrients Market Revenue (Million), by Production Analysis 2025 & 2033
- Figure 39: Middle East & Africa EMEA Secondary Macronutrients Market Revenue Share (%), by Production Analysis 2025 & 2033
- Figure 40: Middle East & Africa EMEA Secondary Macronutrients Market Revenue (Million), by Consumption Analysis 2025 & 2033
- Figure 41: Middle East & Africa EMEA Secondary Macronutrients Market Revenue Share (%), by Consumption Analysis 2025 & 2033
- Figure 42: Middle East & Africa EMEA Secondary Macronutrients Market Revenue (Million), by Import Market Analysis (Value & Volume) 2025 & 2033
- Figure 43: Middle East & Africa EMEA Secondary Macronutrients Market Revenue Share (%), by Import Market Analysis (Value & Volume) 2025 & 2033
- Figure 44: Middle East & Africa EMEA Secondary Macronutrients Market Revenue (Million), by Export Market Analysis (Value & Volume) 2025 & 2033
- Figure 45: Middle East & Africa EMEA Secondary Macronutrients Market Revenue Share (%), by Export Market Analysis (Value & Volume) 2025 & 2033
- Figure 46: Middle East & Africa EMEA Secondary Macronutrients Market Revenue (Million), by Price Trend Analysis 2025 & 2033
- Figure 47: Middle East & Africa EMEA Secondary Macronutrients Market Revenue Share (%), by Price Trend Analysis 2025 & 2033
- Figure 48: Middle East & Africa EMEA Secondary Macronutrients Market Revenue (Million), by Country 2025 & 2033
- Figure 49: Middle East & Africa EMEA Secondary Macronutrients Market Revenue Share (%), by Country 2025 & 2033
- Figure 50: Asia Pacific EMEA Secondary Macronutrients Market Revenue (Million), by Production Analysis 2025 & 2033
- Figure 51: Asia Pacific EMEA Secondary Macronutrients Market Revenue Share (%), by Production Analysis 2025 & 2033
- Figure 52: Asia Pacific EMEA Secondary Macronutrients Market Revenue (Million), by Consumption Analysis 2025 & 2033
- Figure 53: Asia Pacific EMEA Secondary Macronutrients Market Revenue Share (%), by Consumption Analysis 2025 & 2033
- Figure 54: Asia Pacific EMEA Secondary Macronutrients Market Revenue (Million), by Import Market Analysis (Value & Volume) 2025 & 2033
- Figure 55: Asia Pacific EMEA Secondary Macronutrients Market Revenue Share (%), by Import Market Analysis (Value & Volume) 2025 & 2033
- Figure 56: Asia Pacific EMEA Secondary Macronutrients Market Revenue (Million), by Export Market Analysis (Value & Volume) 2025 & 2033
- Figure 57: Asia Pacific EMEA Secondary Macronutrients Market Revenue Share (%), by Export Market Analysis (Value & Volume) 2025 & 2033
- Figure 58: Asia Pacific EMEA Secondary Macronutrients Market Revenue (Million), by Price Trend Analysis 2025 & 2033
- Figure 59: Asia Pacific EMEA Secondary Macronutrients Market Revenue Share (%), by Price Trend Analysis 2025 & 2033
- Figure 60: Asia Pacific EMEA Secondary Macronutrients Market Revenue (Million), by Country 2025 & 2033
- Figure 61: Asia Pacific EMEA Secondary Macronutrients Market Revenue Share (%), by Country 2025 & 2033
List of Tables
- Table 1: Global EMEA Secondary Macronutrients Market Revenue Million Forecast, by Production Analysis 2020 & 2033
- Table 2: Global EMEA Secondary Macronutrients Market Revenue Million Forecast, by Consumption Analysis 2020 & 2033
- Table 3: Global EMEA Secondary Macronutrients Market Revenue Million Forecast, by Import Market Analysis (Value & Volume) 2020 & 2033
- Table 4: Global EMEA Secondary Macronutrients Market Revenue Million Forecast, by Export Market Analysis (Value & Volume) 2020 & 2033
- Table 5: Global EMEA Secondary Macronutrients Market Revenue Million Forecast, by Price Trend Analysis 2020 & 2033
- Table 6: Global EMEA Secondary Macronutrients Market Revenue Million Forecast, by Region 2020 & 2033
- Table 7: Global EMEA Secondary Macronutrients Market Revenue Million Forecast, by Production Analysis 2020 & 2033
- Table 8: Global EMEA Secondary Macronutrients Market Revenue Million Forecast, by Consumption Analysis 2020 & 2033
- Table 9: Global EMEA Secondary Macronutrients Market Revenue Million Forecast, by Import Market Analysis (Value & Volume) 2020 & 2033
- Table 10: Global EMEA Secondary Macronutrients Market Revenue Million Forecast, by Export Market Analysis (Value & Volume) 2020 & 2033
- Table 11: Global EMEA Secondary Macronutrients Market Revenue Million Forecast, by Price Trend Analysis 2020 & 2033
- Table 12: Global EMEA Secondary Macronutrients Market Revenue Million Forecast, by Country 2020 & 2033
- Table 13: United States EMEA Secondary Macronutrients Market Revenue (Million) Forecast, by Application 2020 & 2033
- Table 14: Canada EMEA Secondary Macronutrients Market Revenue (Million) Forecast, by Application 2020 & 2033
- Table 15: Mexico EMEA Secondary Macronutrients Market Revenue (Million) Forecast, by Application 2020 & 2033
- Table 16: Global EMEA Secondary Macronutrients Market Revenue Million Forecast, by Production Analysis 2020 & 2033
- Table 17: Global EMEA Secondary Macronutrients Market Revenue Million Forecast, by Consumption Analysis 2020 & 2033
- Table 18: Global EMEA Secondary Macronutrients Market Revenue Million Forecast, by Import Market Analysis (Value & Volume) 2020 & 2033
- Table 19: Global EMEA Secondary Macronutrients Market Revenue Million Forecast, by Export Market Analysis (Value & Volume) 2020 & 2033
- Table 20: Global EMEA Secondary Macronutrients Market Revenue Million Forecast, by Price Trend Analysis 2020 & 2033
- Table 21: Global EMEA Secondary Macronutrients Market Revenue Million Forecast, by Country 2020 & 2033
- Table 22: Brazil EMEA Secondary Macronutrients Market Revenue (Million) Forecast, by Application 2020 & 2033
- Table 23: Argentina EMEA Secondary Macronutrients Market Revenue (Million) Forecast, by Application 2020 & 2033
- Table 24: Rest of South America EMEA Secondary Macronutrients Market Revenue (Million) Forecast, by Application 2020 & 2033
- Table 25: Global EMEA Secondary Macronutrients Market Revenue Million Forecast, by Production Analysis 2020 & 2033
- Table 26: Global EMEA Secondary Macronutrients Market Revenue Million Forecast, by Consumption Analysis 2020 & 2033
- Table 27: Global EMEA Secondary Macronutrients Market Revenue Million Forecast, by Import Market Analysis (Value & Volume) 2020 & 2033
- Table 28: Global EMEA Secondary Macronutrients Market Revenue Million Forecast, by Export Market Analysis (Value & Volume) 2020 & 2033
- Table 29: Global EMEA Secondary Macronutrients Market Revenue Million Forecast, by Price Trend Analysis 2020 & 2033
- Table 30: Global EMEA Secondary Macronutrients Market Revenue Million Forecast, by Country 2020 & 2033
- Table 31: United Kingdom EMEA Secondary Macronutrients Market Revenue (Million) Forecast, by Application 2020 & 2033
- Table 32: Germany EMEA Secondary Macronutrients Market Revenue (Million) Forecast, by Application 2020 & 2033
- Table 33: France EMEA Secondary Macronutrients Market Revenue (Million) Forecast, by Application 2020 & 2033
- Table 34: Italy EMEA Secondary Macronutrients Market Revenue (Million) Forecast, by Application 2020 & 2033
- Table 35: Spain EMEA Secondary Macronutrients Market Revenue (Million) Forecast, by Application 2020 & 2033
- Table 36: Russia EMEA Secondary Macronutrients Market Revenue (Million) Forecast, by Application 2020 & 2033
- Table 37: Benelux EMEA Secondary Macronutrients Market Revenue (Million) Forecast, by Application 2020 & 2033
- Table 38: Nordics EMEA Secondary Macronutrients Market Revenue (Million) Forecast, by Application 2020 & 2033
- Table 39: Rest of Europe EMEA Secondary Macronutrients Market Revenue (Million) Forecast, by Application 2020 & 2033
- Table 40: Global EMEA Secondary Macronutrients Market Revenue Million Forecast, by Production Analysis 2020 & 2033
- Table 41: Global EMEA Secondary Macronutrients Market Revenue Million Forecast, by Consumption Analysis 2020 & 2033
- Table 42: Global EMEA Secondary Macronutrients Market Revenue Million Forecast, by Import Market Analysis (Value & Volume) 2020 & 2033
- Table 43: Global EMEA Secondary Macronutrients Market Revenue Million Forecast, by Export Market Analysis (Value & Volume) 2020 & 2033
- Table 44: Global EMEA Secondary Macronutrients Market Revenue Million Forecast, by Price Trend Analysis 2020 & 2033
- Table 45: Global EMEA Secondary Macronutrients Market Revenue Million Forecast, by Country 2020 & 2033
- Table 46: Turkey EMEA Secondary Macronutrients Market Revenue (Million) Forecast, by Application 2020 & 2033
- Table 47: Israel EMEA Secondary Macronutrients Market Revenue (Million) Forecast, by Application 2020 & 2033
- Table 48: GCC EMEA Secondary Macronutrients Market Revenue (Million) Forecast, by Application 2020 & 2033
- Table 49: North Africa EMEA Secondary Macronutrients Market Revenue (Million) Forecast, by Application 2020 & 2033
- Table 50: South Africa EMEA Secondary Macronutrients Market Revenue (Million) Forecast, by Application 2020 & 2033
- Table 51: Rest of Middle East & Africa EMEA Secondary Macronutrients Market Revenue (Million) Forecast, by Application 2020 & 2033
- Table 52: Global EMEA Secondary Macronutrients Market Revenue Million Forecast, by Production Analysis 2020 & 2033
- Table 53: Global EMEA Secondary Macronutrients Market Revenue Million Forecast, by Consumption Analysis 2020 & 2033
- Table 54: Global EMEA Secondary Macronutrients Market Revenue Million Forecast, by Import Market Analysis (Value & Volume) 2020 & 2033
- Table 55: Global EMEA Secondary Macronutrients Market Revenue Million Forecast, by Export Market Analysis (Value & Volume) 2020 & 2033
- Table 56: Global EMEA Secondary Macronutrients Market Revenue Million Forecast, by Price Trend Analysis 2020 & 2033
- Table 57: Global EMEA Secondary Macronutrients Market Revenue Million Forecast, by Country 2020 & 2033
- Table 58: China EMEA Secondary Macronutrients Market Revenue (Million) Forecast, by Application 2020 & 2033
- Table 59: India EMEA Secondary Macronutrients Market Revenue (Million) Forecast, by Application 2020 & 2033
- Table 60: Japan EMEA Secondary Macronutrients Market Revenue (Million) Forecast, by Application 2020 & 2033
- Table 61: South Korea EMEA Secondary Macronutrients Market Revenue (Million) Forecast, by Application 2020 & 2033
- Table 62: ASEAN EMEA Secondary Macronutrients Market Revenue (Million) Forecast, by Application 2020 & 2033
- Table 63: Oceania EMEA Secondary Macronutrients Market Revenue (Million) Forecast, by Application 2020 & 2033
- Table 64: Rest of Asia Pacific EMEA Secondary Macronutrients Market Revenue (Million) Forecast, by Application 2020 & 2033
Frequently Asked Questions
1. What is the projected Compound Annual Growth Rate (CAGR) of the EMEA Secondary Macronutrients Market?
The projected CAGR is approximately 4.20%.
2. Which companies are prominent players in the EMEA Secondary Macronutrients Market?
Key companies in the market include Haifa Group, Eurochem Group AG, K+S Company, Trade Corporation International SA, SAF Sulphur Company, Saudi United Fertilizer Company (al-asmida), Al-tayseer Chemical Industry, Israel Chemical Company, Takamul National Agriculture, Yara International ASA.
3. What are the main segments of the EMEA Secondary Macronutrients Market?
The market segments include Production Analysis, Consumption Analysis, Import Market Analysis (Value & Volume), Export Market Analysis (Value & Volume), Price Trend Analysis.
4. Can you provide details about the market size?
The market size is estimated to be USD 4.23 Million as of 2022.
5. What are some drivers contributing to market growth?
Seed Treatment As A Solution To Enhance Yield; Growing Awareness For Seed Treatment Among The Farmers; Rising Trend Of Organic Farming.
6. What are the notable trends driving market growth?
Secondary Macronutrients Ensure Healthy Plant Growth.
7. Are there any restraints impacting market growth?
Limitations Across Farm-Level Seed Treatment; Rising Environmental Concerns.
8. Can you provide examples of recent developments in the market?
N/A
9. What pricing options are available for accessing the report?
Pricing options include single-user, multi-user, and enterprise licenses priced at USD 4750, USD 5250, and USD 8750 respectively.
10. Is the market size provided in terms of value or volume?
The market size is provided in terms of value, measured in Million.
11. Are there any specific market keywords associated with the report?
Yes, the market keyword associated with the report is "EMEA Secondary Macronutrients Market," which aids in identifying and referencing the specific market segment covered.
12. How do I determine which pricing option suits my needs best?
The pricing options vary based on user requirements and access needs. Individual users may opt for single-user licenses, while businesses requiring broader access may choose multi-user or enterprise licenses for cost-effective access to the report.
13. Are there any additional resources or data provided in the EMEA Secondary Macronutrients Market report?
While the report offers comprehensive insights, it's advisable to review the specific contents or supplementary materials provided to ascertain if additional resources or data are available.
14. How can I stay updated on further developments or reports in the EMEA Secondary Macronutrients Market?
To stay informed about further developments, trends, and reports in the EMEA Secondary Macronutrients Market, consider subscribing to industry newsletters, following relevant companies and organizations, or regularly checking reputable industry news sources and publications.
Methodology
Step 1 - Identification of Relevant Samples Size from Population Database


Step 2 - Approaches for Defining Global Market Size (Value, Volume* & Price*)

Note*: In applicable scenarios
Step 3 - Data Sources
Primary Research
- Web Analytics
- Survey Reports
- Research Institute
- Latest Research Reports
- Opinion Leaders
Secondary Research
- Annual Reports
- White Paper
- Latest Press Release
- Industry Association
- Paid Database
- Investor Presentations

Step 4 - Data Triangulation
Involves using different sources of information in order to increase the validity of a study
These sources are likely to be stakeholders in a program - participants, other researchers, program staff, other community members, and so on.
Then we put all data in single framework & apply various statistical tools to find out the dynamic on the market.
During the analysis stage, feedback from the stakeholder groups would be compared to determine areas of agreement as well as areas of divergence