

Key Insights
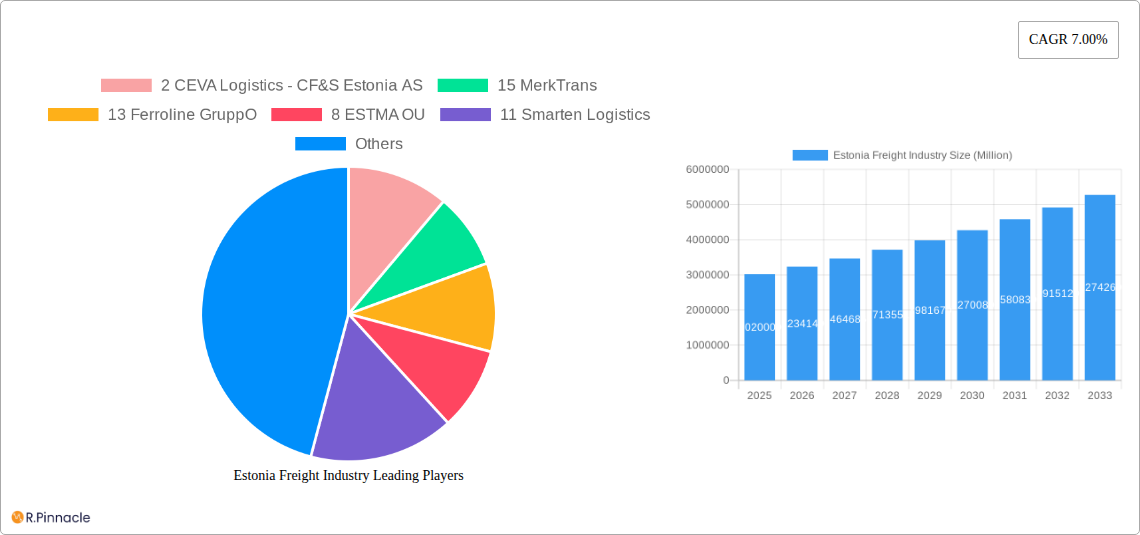
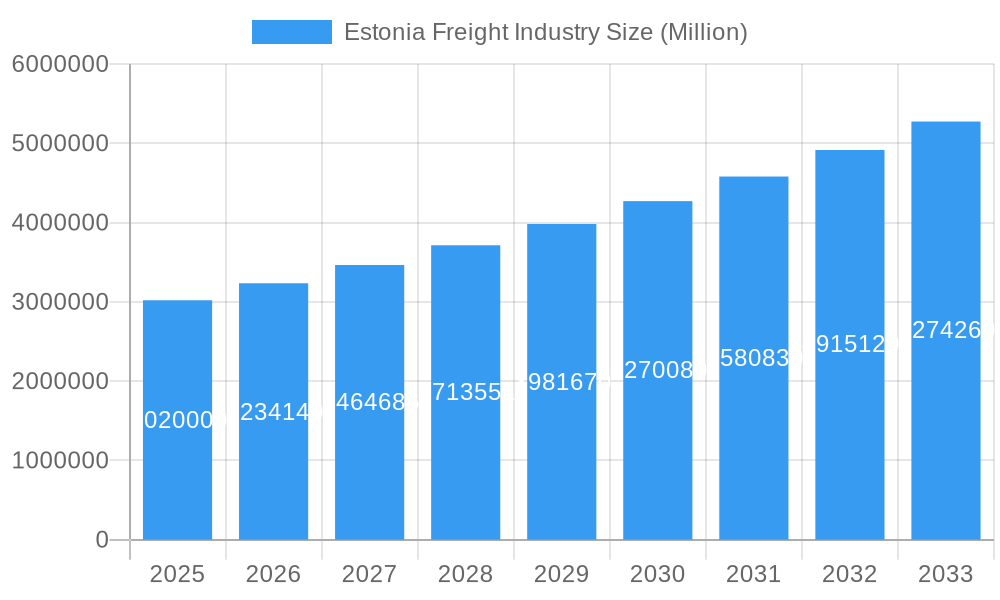
The Estonian freight industry, valued at €3.02 million in 2025, is projected to experience robust growth, driven by a Compound Annual Growth Rate (CAGR) of 7.00% from 2025 to 2033. This expansion is fueled by several key factors. The growth of e-commerce and increasing cross-border trade within the European Union are significantly boosting demand for efficient freight services. Furthermore, investments in infrastructure improvements, such as upgrades to rail networks and port facilities, are enhancing logistical capabilities and attracting foreign investment. The rise of technology, particularly in areas like logistics software and supply chain management, is streamlining operations and reducing costs for freight forwarders and related businesses. Specific sectors like manufacturing, automotive, and distributive trade (including FMCG) are major contributors to the industry's growth, requiring reliable and timely freight solutions.
Estonia Freight Industry Market Size (In Million)
However, the industry also faces challenges. Fluctuations in global fuel prices represent a significant cost pressure, impacting profitability. Competition from established international players, particularly those with extensive networks and resources, can be fierce. Addressing potential labor shortages and ensuring regulatory compliance within the evolving European Union framework also present ongoing concerns. The continued development and adoption of sustainable transportation practices, such as increasing the use of electric vehicles and optimizing delivery routes to reduce carbon emissions, will be crucial for long-term growth and industry sustainability. Segmentation analysis reveals strong performance in rail freight forwarding and warehousing, with significant potential for value-added services within the manufacturing and automotive sectors. Companies such as CEVA Logistics, DSV, and Rhenus Logistics are prominent players in the Estonian market, indicating the presence of both global and local businesses actively shaping the industry landscape.
Estonia Freight Industry Company Market Share
Estonia Freight Industry: A Comprehensive Market Report (2019-2033)
This in-depth report provides a comprehensive analysis of the Estonia freight industry, offering invaluable insights for industry professionals, investors, and strategic decision-makers. Covering the period 2019-2033, with a focus on 2025, this report unveils the market's structure, dynamics, key players, and future outlook. Benefit from actionable intelligence on market size, growth projections, and competitive landscapes to navigate this dynamic sector successfully.
Estonia Freight Industry Market Structure & Innovation Trends
The Estonian freight industry exhibits a moderately fragmented market structure, with a handful of large players and numerous smaller operators. While precise market share data for each company is unavailable, we estimate that the top 5 players (including CEVA Logistics - CF&S Estonia AS, MerkTrans, Ferroline GruppO, and others) account for approximately xx% of the total market value (estimated at xx Million in 2025). Innovation is driven by the increasing adoption of technology, particularly in warehousing and logistics management. The regulatory framework, while generally supportive of business, continues to evolve, impacting operational efficiency and costs. Product substitutes, such as improved road networks and digital platforms, pose challenges to traditional players.
- Market Concentration: Moderately fragmented, with a few dominant players.
- Innovation Drivers: Technological advancements in warehousing and logistics management systems.
- Regulatory Framework: Evolving, impacting operational efficiency and costs.
- Product Substitutes: Improved road networks and digital platforms.
- End-User Demographics: Predominantly driven by manufacturing, distribution, and other sectors.
- M&A Activity: While specific deal values are unavailable for recent years, consolidation is expected in the coming years, with an estimated xx Million in M&A activity forecasted for 2025-2033.
Estonia Freight Industry Market Dynamics & Trends
The Estonian freight industry is experiencing steady growth, driven primarily by rising e-commerce activity, expanding industrial production, and improving infrastructure. The increasing adoption of technology, including automation and data analytics, is significantly impacting the sector. This is contributing to improved efficiency, reduced costs, and enhanced customer service. However, competitive dynamics remain intense, with players constantly vying for market share. The CAGR for the period 2025-2033 is projected to be xx%, with market penetration of key technologies like AI and automation exceeding xx% by 2033. The predicted market size for 2025 is xx Million.
Dominant Regions & Segments in Estonia Freight Industry
While precise regional data is limited, the Estonian freight industry is concentrated around major urban centers and transportation hubs. The dominant segments include freight forwarding within the rail sector, warehousing services supporting manufacturing and distributive trade, particularly FMCG, and other value-added services like customs brokerage.
- Key Drivers:
- Economic policies: Government initiatives supporting infrastructure development and trade.
- Infrastructure: Improvements in road, rail, and port infrastructure facilitating efficient freight movement.
- Technological advancements: Automation and digitalization enhancing efficiency and visibility.
- Dominance Analysis: Manufacturing and automotive represent the largest end-user segment, followed by distributive trade (including FMCG). Freight forwarding and warehousing are the leading functional segments within the rail sector.
Estonia Freight Industry Product Innovations
Recent innovations in the Estonian freight industry include the integration of IoT (Internet of Things) devices for real-time tracking and monitoring of shipments, as well as the wider adoption of advanced warehouse management systems (WMS). These advancements increase efficiency, optimize resource allocation, and improve overall supply chain visibility. The successful market fit of these innovations is evidenced by their increasing adoption across various segments.
Report Scope & Segmentation Analysis
This report segments the Estonian freight industry by:
- Mode of Transport: Rail (Freight Forwarding, Warehousing, Value Added Services, Other Functions)
- End User: Manufacturing & Automotive, Oil & Gas, Mining & Quarrying, Agriculture, Fishing & Forestry, Construction, Distributive Trade (FMCG Included), Healthcare & Pharmaceuticals, Other End Users.
- Function: Freight Transport.
Each segment's growth projection, market size, and competitive dynamics are analyzed in detail within the full report. We project significant growth in warehousing and value-added services, driven by the increasing demand for efficient logistics solutions.
Key Drivers of Estonia Freight Industry Growth
The growth of the Estonian freight industry is fueled by several key factors. Firstly, increasing e-commerce activity boosts demand for efficient last-mile delivery services. Secondly, ongoing investments in infrastructure improve transport connectivity, leading to smoother operations. Finally, technological advancements enhance efficiency, reduce costs, and offer enhanced visibility throughout the supply chain.
Challenges in the Estonia Freight Industry Sector
The Estonian freight industry faces challenges such as fluctuating fuel prices and the overall economic volatility impacting transportation costs. Furthermore, competition is fierce, requiring players to invest in innovation and efficiency to maintain a competitive edge. Regulatory changes and labor market dynamics also present continuous operational challenges. The total estimated impact of these challenges on industry profit margins is approximately xx% in 2025.
Emerging Opportunities in Estonia Freight Industry
Emerging opportunities include the growth of green logistics, focusing on sustainable transportation solutions to reduce environmental impact. Furthermore, advancements in technology present chances for optimizing operations and enhancing customer experiences. The increasing demand for specialized logistics services tailored to specific sectors also creates lucrative possibilities.
Leading Players in the Estonia Freight Industry Market
- CEVA Logistics - CF&S Estonia AS
- MerkTrans
- Ferroline GruppO
- ESTMA OU
- Smarten Logistics
- KGK Logistics
- TT Estonia
- Parme Trans
- Hanson Logistics
- DHL EXPRESS
- DSV
- Group logistics OU
- Delamode Estonia
- Ace Logistics Estonia
- CF&S Estonia AS
- Rhenus Logistics
- Tallinna Toiduveod AS
(Note: This list is not exhaustive. Links provided where readily available. Information regarding specific company market share remains unavailable at this time.)
Key Developments in Estonia Freight Industry Industry
- July 2023: DHL Express opens a new USD 84.5 Million Americas region hub, enhancing global connectivity and capacity. This strengthens their position in the global logistics market and increases efficiency for European shipments.
- July 2023: CEVA Logistics implements automated warehouse systems in the Netherlands, tripling peak season handling capacity. This exemplifies the industry trend toward automation and efficiency improvements.
Future Outlook for Estonia Freight Industry Market
The future of the Estonian freight industry is promising, with continued growth expected driven by e-commerce expansion and infrastructural developments. The adoption of sustainable practices and technological innovation will shape the industry's evolution, presenting significant opportunities for players who adapt and invest strategically. Continued market consolidation is likely, leading to a more concentrated landscape in the coming decade.
Estonia Freight Industry Segmentation
-
1. Function
-
1.1. Freight Transport
- 1.1.1. Road
- 1.1.2. Inland Water
- 1.1.3. Air
- 1.1.4. Rail
- 1.2. Freight Forwarding
- 1.3. Warehousing
- 1.4. Value Added Services and Other Functions
-
1.1. Freight Transport
-
2. End User
- 2.1. Manufacturing and Automotive
- 2.2. Oil and Gas, Mining and Quarrying
- 2.3. Agriculture,Fishing and Forestry
- 2.4. Construction
- 2.5. Distribu
- 2.6. Healthcare and Pharmaceuticals
- 2.7. Other End Users
Estonia Freight Industry Segmentation By Geography
- 1. Estonia
Estonia Freight Industry Regional Market Share
Geographic Coverage of Estonia Freight Industry
Estonia Freight Industry REPORT HIGHLIGHTS
| Aspects | Details |
|---|---|
| Study Period | 2020-2034 |
| Base Year | 2025 |
| Estimated Year | 2026 |
| Forecast Period | 2026-2034 |
| Historical Period | 2020-2025 |
| Growth Rate | CAGR of 7.00% from 2020-2034 |
| Segmentation |
|
Table of Contents
- 1. Introduction
- 1.1. Research Scope
- 1.2. Market Segmentation
- 1.3. Research Objective
- 1.4. Definitions and Assumptions
- 2. Executive Summary
- 2.1. Market Snapshot
- 3. Market Dynamics
- 3.1. Market Drivers
- 3.2. Market Restrains
- 3.3. Market Trends
- 3.4. Market Opportunities
- 4. Market Factor Analysis
- 4.1. Porters Five Forces
- 4.1.1. Bargaining Power of Suppliers
- 4.1.2. Bargaining Power of Buyers
- 4.1.3. Threat of New Entrants
- 4.1.4. Threat of Substitutes
- 4.1.5. Competitive Rivalry
- 4.2. PESTEL analysis
- 4.3. BCG Analysis
- 4.3.1. Stars (High Growth, High Market Share)
- 4.3.2. Cash Cows (Low Growth, High Market Share)
- 4.3.3. Question Mark (High Growth, Low Market Share)
- 4.3.4. Dogs (Low Growth, Low Market Share)
- 4.4. Ansoff Matrix Analysis
- 4.5. Supply Chain Analysis
- 4.6. Regulatory Landscape
- 4.7. Current Market Potential and Opportunity Assessment (TAM–SAM–SOM Framework)
- 4.8. PRI Analyst Note
- 4.1. Porters Five Forces
- 5. Market Analysis, Insights and Forecast 2021-2033
- 5.1. Market Analysis, Insights and Forecast - by Function
- 5.1.1. Freight Transport
- 5.1.1.1. Road
- 5.1.1.2. Inland Water
- 5.1.1.3. Air
- 5.1.1.4. Rail
- 5.1.2. Freight Forwarding
- 5.1.3. Warehousing
- 5.1.4. Value Added Services and Other Functions
- 5.1.1. Freight Transport
- 5.2. Market Analysis, Insights and Forecast - by End User
- 5.2.1. Manufacturing and Automotive
- 5.2.2. Oil and Gas, Mining and Quarrying
- 5.2.3. Agriculture,Fishing and Forestry
- 5.2.4. Construction
- 5.2.5. Distribu
- 5.2.6. Healthcare and Pharmaceuticals
- 5.2.7. Other End Users
- 5.3. Market Analysis, Insights and Forecast - by Region
- 5.3.1. Estonia
- 5.1. Market Analysis, Insights and Forecast - by Function
- 6. Estonia Freight Industry Analysis, Insights and Forecast, 2021-2033
- 6.1. Market Analysis, Insights and Forecast - by Function
- 6.1.1. Freight Transport
- 6.1.1.1. Road
- 6.1.1.2. Inland Water
- 6.1.1.3. Air
- 6.1.1.4. Rail
- 6.1.2. Freight Forwarding
- 6.1.3. Warehousing
- 6.1.4. Value Added Services and Other Functions
- 6.1.1. Freight Transport
- 6.2. Market Analysis, Insights and Forecast - by End User
- 6.2.1. Manufacturing and Automotive
- 6.2.2. Oil and Gas, Mining and Quarrying
- 6.2.3. Agriculture,Fishing and Forestry
- 6.2.4. Construction
- 6.2.5. Distribu
- 6.2.6. Healthcare and Pharmaceuticals
- 6.2.7. Other End Users
- 6.1. Market Analysis, Insights and Forecast - by Function
- 7. Competitive Analysis
- 7.1. Company Profiles
- 7.1.1 2 CEVA Logistics - CF&S Estonia AS
- 7.1.1.1. Company Overview
- 7.1.1.2. Products
- 7.1.1.3. Company Financials
- 7.1.1.4. SWOT Analysis
- 7.1.2 15 MerkTrans
- 7.1.2.1. Company Overview
- 7.1.2.2. Products
- 7.1.2.3. Company Financials
- 7.1.2.4. SWOT Analysis
- 7.1.3 13 Ferroline GruppO
- 7.1.3.1. Company Overview
- 7.1.3.2. Products
- 7.1.3.3. Company Financials
- 7.1.3.4. SWOT Analysis
- 7.1.4 8 ESTMA OU
- 7.1.4.1. Company Overview
- 7.1.4.2. Products
- 7.1.4.3. Company Financials
- 7.1.4.4. SWOT Analysis
- 7.1.5 11 Smarten Logistics
- 7.1.5.1. Company Overview
- 7.1.5.2. Products
- 7.1.5.3. Company Financials
- 7.1.5.4. SWOT Analysis
- 7.1.6 16 KGK Logistics**List Not Exhaustive
- 7.1.6.1. Company Overview
- 7.1.6.2. Products
- 7.1.6.3. Company Financials
- 7.1.6.4. SWOT Analysis
- 7.1.7 5 TT Estonia
- 7.1.7.1. Company Overview
- 7.1.7.2. Products
- 7.1.7.3. Company Financials
- 7.1.7.4. SWOT Analysis
- 7.1.8 9 Parme Trans
- 7.1.8.1. Company Overview
- 7.1.8.2. Products
- 7.1.8.3. Company Financials
- 7.1.8.4. SWOT Analysis
- 7.1.9 6 Hanson Logistics
- 7.1.9.1. Company Overview
- 7.1.9.2. Products
- 7.1.9.3. Company Financials
- 7.1.9.4. SWOT Analysis
- 7.1.10 DHL EXPRESS
- 7.1.10.1. Company Overview
- 7.1.10.2. Products
- 7.1.10.3. Company Financials
- 7.1.10.4. SWOT Analysis
- 7.1.11 3 DSV
- 7.1.11.1. Company Overview
- 7.1.11.2. Products
- 7.1.11.3. Company Financials
- 7.1.11.4. SWOT Analysis
- 7.1.12 4 Group logistics OU
- 7.1.12.1. Company Overview
- 7.1.12.2. Products
- 7.1.12.3. Company Financials
- 7.1.12.4. SWOT Analysis
- 7.1.13 7 Delamode Estonia
- 7.1.13.1. Company Overview
- 7.1.13.2. Products
- 7.1.13.3. Company Financials
- 7.1.13.4. SWOT Analysis
- 7.1.14 10 Ace Logistics Estonia
- 7.1.14.1. Company Overview
- 7.1.14.2. Products
- 7.1.14.3. Company Financials
- 7.1.14.4. SWOT Analysis
- 7.1.15 14 CF&S Estonia AS
- 7.1.15.1. Company Overview
- 7.1.15.2. Products
- 7.1.15.3. Company Financials
- 7.1.15.4. SWOT Analysis
- 7.1.16 1 Rhenus Logistics
- 7.1.16.1. Company Overview
- 7.1.16.2. Products
- 7.1.16.3. Company Financials
- 7.1.16.4. SWOT Analysis
- 7.1.17 12 Tallinna Toiduveod AS
- 7.1.17.1. Company Overview
- 7.1.17.2. Products
- 7.1.17.3. Company Financials
- 7.1.17.4. SWOT Analysis
- 7.1.1 2 CEVA Logistics - CF&S Estonia AS
- 7.2. Market Entropy
- 7.2.1 Company's Key Areas Served
- 7.2.2 Recent Developments
- 7.3. Company Market Share Analysis 2025
- 7.3.1 Top 5 Companies Market Share Analysis
- 7.3.2 Top 3 Companies Market Share Analysis
- 7.4. List of Potential Customers
- 8. Research Methodology
List of Figures
- Figure 1: Estonia Freight Industry Revenue Breakdown (Million, %) by Product 2025 & 2033
- Figure 2: Estonia Freight Industry Share (%) by Company 2025
List of Tables
- Table 1: Estonia Freight Industry Revenue Million Forecast, by Function 2020 & 2033
- Table 2: Estonia Freight Industry Revenue Million Forecast, by End User 2020 & 2033
- Table 3: Estonia Freight Industry Revenue Million Forecast, by Region 2020 & 2033
- Table 4: Estonia Freight Industry Revenue Million Forecast, by Function 2020 & 2033
- Table 5: Estonia Freight Industry Revenue Million Forecast, by End User 2020 & 2033
- Table 6: Estonia Freight Industry Revenue Million Forecast, by Country 2020 & 2033
Frequently Asked Questions
1. What is the projected Compound Annual Growth Rate (CAGR) of the Estonia Freight Industry?
The projected CAGR is approximately 7.00%.
2. Which companies are prominent players in the Estonia Freight Industry?
Key companies in the market include 2 CEVA Logistics - CF&S Estonia AS, 15 MerkTrans, 13 Ferroline GruppO, 8 ESTMA OU, 11 Smarten Logistics, 16 KGK Logistics**List Not Exhaustive, 5 TT Estonia, 9 Parme Trans, 6 Hanson Logistics, DHL EXPRESS, 3 DSV, 4 Group logistics OU, 7 Delamode Estonia, 10 Ace Logistics Estonia, 14 CF&S Estonia AS, 1 Rhenus Logistics, 12 Tallinna Toiduveod AS.
3. What are the main segments of the Estonia Freight Industry?
The market segments include Function, End User.
4. Can you provide details about the market size?
The market size is estimated to be USD 3.02 Million as of 2022.
5. What are some drivers contributing to market growth?
Investments in the logistics infrastructure; Government Initiatives.
6. What are the notable trends driving market growth?
Rapid Growth of E commerce in the Region.
7. Are there any restraints impacting market growth?
Poor Infrastructure.
8. Can you provide examples of recent developments in the market?
July 2023: DHL Express, the world's leading provider of express shipping services, has announced the grand opening of its Americas region hub based at the Hartsfield-Jackson Atlanta International Airport (ATL). With a focus on sustainability, the USD 84.5 million investment further strengthens the company's connections and service capabilities between the U.S. and key global markets, increasing capacity, speeding transit times, and adding resilience to its network. Spanning 100,000 square feet, the state-of-the-art hub establishes direct connections between 19 cities in the Southeastern U.S. and key global markets, including Europe and major DHL hubs worldwide.
9. What pricing options are available for accessing the report?
Pricing options include single-user, multi-user, and enterprise licenses priced at USD 3800, USD 4500, and USD 5800 respectively.
10. Is the market size provided in terms of value or volume?
The market size is provided in terms of value, measured in Million.
11. Are there any specific market keywords associated with the report?
Yes, the market keyword associated with the report is "Estonia Freight Industry," which aids in identifying and referencing the specific market segment covered.
12. How do I determine which pricing option suits my needs best?
The pricing options vary based on user requirements and access needs. Individual users may opt for single-user licenses, while businesses requiring broader access may choose multi-user or enterprise licenses for cost-effective access to the report.
13. Are there any additional resources or data provided in the Estonia Freight Industry report?
While the report offers comprehensive insights, it's advisable to review the specific contents or supplementary materials provided to ascertain if additional resources or data are available.
14. How can I stay updated on further developments or reports in the Estonia Freight Industry?
To stay informed about further developments, trends, and reports in the Estonia Freight Industry, consider subscribing to industry newsletters, following relevant companies and organizations, or regularly checking reputable industry news sources and publications.
Methodology
Step 1 - Identification of Relevant Samples Size from Population Database


Step 2 - Approaches for Defining Global Market Size (Value, Volume* & Price*)

Note*: In applicable scenarios
Step 3 - Data Sources
Primary Research
- Web Analytics
- Survey Reports
- Research Institute
- Latest Research Reports
- Opinion Leaders
Secondary Research
- Annual Reports
- White Paper
- Latest Press Release
- Industry Association
- Paid Database
- Investor Presentations

Step 4 - Data Triangulation
Involves using different sources of information in order to increase the validity of a study
These sources are likely to be stakeholders in a program - participants, other researchers, program staff, other community members, and so on.
Then we put all data in single framework & apply various statistical tools to find out the dynamic on the market.
During the analysis stage, feedback from the stakeholder groups would be compared to determine areas of agreement as well as areas of divergence