

Key Insights
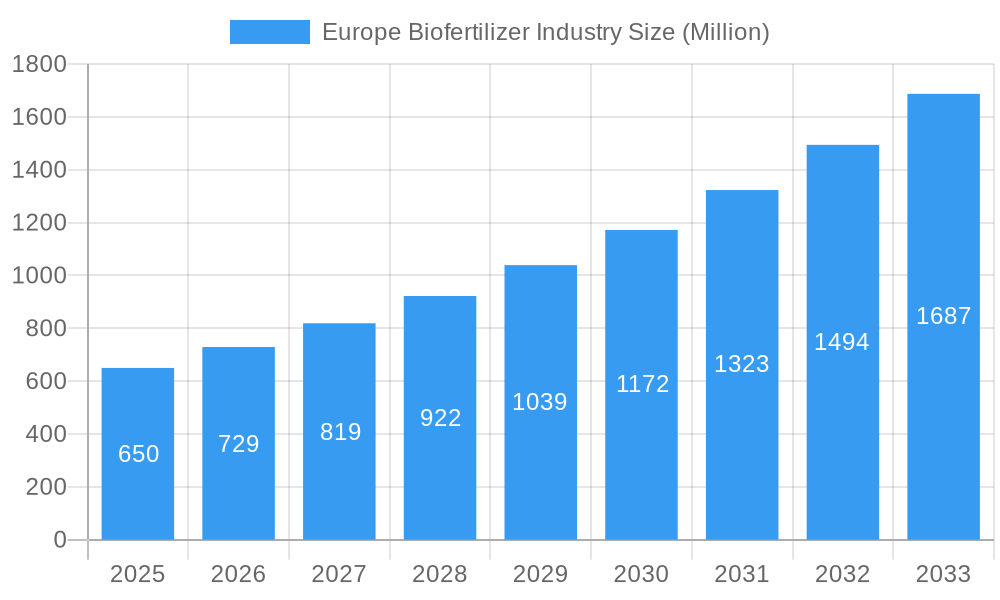
The European biofertilizer market, valued at €650 million in 2025, is projected to experience robust growth, exhibiting a Compound Annual Growth Rate (CAGR) of 12.10% from 2025 to 2033. This expansion is driven by several key factors. Increasing awareness of sustainable agriculture practices and the detrimental environmental effects of synthetic fertilizers are fueling demand for eco-friendly alternatives. Furthermore, stringent regulations aimed at reducing agricultural pollution and promoting biodiversity are creating a favorable regulatory landscape for biofertilizers. The growing global population and the consequent need to enhance crop yields while minimizing environmental impact are further bolstering market growth. Specific application segments like soil treatment and seed treatment are experiencing particularly strong growth, fueled by their effectiveness in improving nutrient uptake and promoting plant health. Leading players in the European biofertilizer market are focusing on innovation, particularly in developing carrier-enriched and liquid biofertilizer technologies, to cater to evolving farmer needs and optimize product efficacy. Germany, France, and the United Kingdom are major markets within Europe, although other countries are showing significant growth potential. The market segmentation, encompassing diverse crop types, microorganisms, and application technologies, reflects the adaptability and versatility of biofertilizers in addressing varied agricultural contexts.
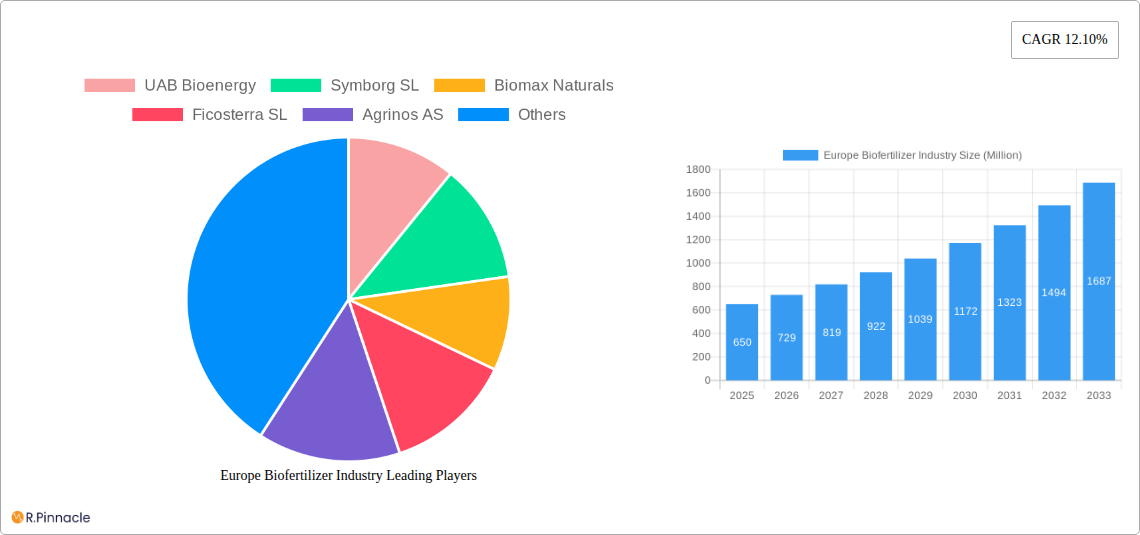
Europe Biofertilizer Industry Market Size (In Million)
The market’s growth is not without challenges. High initial investment costs associated with biofertilizer production and distribution can hinder market penetration, particularly among smaller farming operations. Inconsistency in product quality and efficacy across different brands requires further standardization and quality control measures to build consumer trust. Moreover, educating farmers about the benefits and proper application of biofertilizers remains crucial for widespread adoption. Despite these challenges, the long-term outlook for the European biofertilizer market remains positive, driven by increasing government support for sustainable agriculture, favorable environmental regulations, and growing consumer preference for organically produced food. The market's segmentation into various crop types, microorganisms, and technologies provides diverse opportunities for market players to specialize and cater to specific needs, fostering innovation and sustained growth.
Europe Biofertilizer Industry Company Market Share
Europe Biofertilizer Industry: A Comprehensive Market Report (2019-2033)
This in-depth report provides a comprehensive analysis of the European biofertilizer market, offering invaluable insights for industry professionals, investors, and stakeholders. The study period covers 2019-2033, with 2025 as the base and estimated year, and a forecast period of 2025-2033. The historical period analyzed is 2019-2024. The report leverages detailed market segmentation, analyzing key trends, growth drivers, and challenges shaping the future of this dynamic sector. Expect actionable intelligence and data-driven projections to help navigate the complexities of the European biofertilizer landscape.
Europe Biofertilizer Industry Market Structure & Innovation Trends
The European biofertilizer market exhibits a moderately fragmented structure, with several key players vying for market share. While precise market share figures for individual companies are proprietary data, a few companies including UAB Bioenergy, Symborg SL, Biomax Naturals, Ficosterra SL, Agrinos AS, Rizobacter Argentina S, Biocorrection AS, and ASB Greenworld represent a significant portion of the market. Innovation is driven by the increasing demand for sustainable agricultural practices, stricter regulations on chemical fertilizers, and the growing awareness of environmental concerns. The regulatory framework in Europe is evolving, with increasing emphasis on bio-based solutions. Product substitutes include conventional chemical fertilizers, however, biofertilizers offer several advantages, including improved soil health and reduced environmental impact. M&A activity is significant, with deal values reaching an estimated €xx Million in the past five years. These activities reflect the industry's consolidation and pursuit of economies of scale.
- Market Concentration: Moderately Fragmented
- Key Players: UAB Bioenergy, Symborg SL, Biomax Naturals, Ficosterra SL, Agrinos AS, Rizobacter Argentina S, Biocorrection AS, ASB Greenworld
- M&A Activity: Estimated €xx Million in the last 5 years.
Europe Biofertilizer Industry Market Dynamics & Trends
The European biofertilizer market is experiencing robust growth, driven by several factors. The rising awareness of sustainable agriculture, coupled with stringent environmental regulations, is pushing farmers towards eco-friendly alternatives to traditional chemical fertilizers. Technological advancements in biofertilizer production, particularly in carrier-enriched and liquid formulations, are also contributing to market expansion. The increasing adoption of precision agriculture and the growing demand for high-quality crops are further boosting market growth. The market is projected to exhibit a Compound Annual Growth Rate (CAGR) of xx% during the forecast period (2025-2033), with market penetration reaching xx% by 2033. Consumer preferences are shifting towards organically produced food, creating a substantial demand for biofertilizers. Competitive dynamics are characterized by innovation, strategic partnerships, and expansion into new geographic markets.
Dominant Regions & Segments in Europe Biofertilizer Industry
The European biofertilizer market exhibits significant regional variations. Western Europe, particularly Germany, France, and the UK, are leading markets due to high agricultural output, stringent environmental regulations, and increased awareness of sustainable agriculture. Key growth drivers in these regions include supportive government policies and well-developed agricultural infrastructure.
- Leading Regions: Western Europe (Germany, France, UK)
- Dominant Application: Soil Treatment
- High-Growth Crop Type: Grains and Cereals
- Preferred Technology: Liquid Biofertilizers
- Most Widely Used Microorganism: Rhizobium
Key Drivers:
- Government policies promoting sustainable agriculture: Subsidies and incentives for biofertilizer adoption.
- Well-established agricultural infrastructure: Efficient distribution networks and access to technology.
- High consumer demand for organic produce: Driving the adoption of biofertilizers by farmers.
Europe Biofertilizer Industry Product Innovations
Recent product innovations focus on developing more effective and targeted biofertilizers. This includes advancements in carrier-enriched biofertilizers to improve shelf life and application efficiency, and the development of liquid biofertilizers for easier application. The focus is also shifting towards developing biofertilizers tailored to specific crop types and soil conditions, maximizing their effectiveness. These innovations improve market fit by addressing specific farmer needs and providing superior performance compared to traditional methods.
Report Scope & Segmentation Analysis
This report segments the European biofertilizer market based on application (soil treatment, seed treatment, other applications), crop type (grains and cereals, pulses and oilseeds, commercial crops, fruits and vegetables, other crop types), technology (carrier-enriched biofertilizers, liquid biofertilizers, other technologies), and microorganism (Rhizobium, Azospirillum, Azotobacter, blue-green algae, phosphate solubilizing bacteria, mycorrhiza, other microorganisms). Each segment is analyzed for its market size, growth projections, and competitive dynamics. For instance, the soil treatment segment currently holds the largest market share, while the liquid biofertilizers technology segment exhibits the fastest growth.
Key Drivers of Europe Biofertilizer Industry Growth
Several factors are driving the growth of the European biofertilizer industry. Stringent environmental regulations limiting the use of chemical fertilizers are pushing farmers towards eco-friendly alternatives. Growing consumer demand for organic produce necessitates the use of biofertilizers in sustainable agriculture. Technological advancements resulting in more effective and efficient biofertilizers also play a crucial role. Government support through subsidies and incentives further boosts market expansion.
Challenges in the Europe Biofertilizer Industry Sector
The European biofertilizer industry faces several challenges. The high initial investment costs associated with adopting biofertilizers can be a barrier for some farmers. The inconsistent performance of biofertilizers under varying climatic conditions and soil types is another concern. Competition from established chemical fertilizer manufacturers poses a significant challenge. Furthermore, the lack of awareness among farmers about the benefits of biofertilizers hinders wider adoption. The estimated impact of these challenges on market growth is a reduction in the CAGR by approximately xx%.
Emerging Opportunities in Europe Biofertilizer Industry
The European biofertilizer industry presents several emerging opportunities. The growing demand for sustainable agriculture in developing regions offers significant potential for market expansion. Advancements in biotechnology are leading to the development of novel biofertilizers with enhanced efficacy. The increasing adoption of precision agriculture techniques provides opportunities to optimize biofertilizer application and maximize yields. The growing focus on carbon sequestration and soil health presents new market avenues for biofertilizers.
Leading Players in the Europe Biofertilizer Industry Market
- UAB Bioenergy
- Symborg SL
- Biomax Naturals
- Ficosterra SL
- Agrinos AS
- Rizobacter Argentina S
- Biocorrection AS
- ASB Greenworld
Key Developments in Europe Biofertilizer Industry Industry
- March 2021: Symborg Corporate SL opened a new manufacturing facility in Spain for sustainable agricultural products, including biofertilizers.
- July 2021: Symborg Corporate SL signed a distribution agreement with Corteva Agrisciences to distribute its BlueN biofertilizer products across the European Union.
- June 2022: Novozymes A/S and AgroFresh formed a partnership to develop biological solutions and improve post-harvest food quality.
Future Outlook for Europe Biofertilizer Industry Market
The future of the European biofertilizer market is promising. Continued growth is expected, driven by increasing environmental awareness, supportive government policies, and technological advancements. The market's future potential lies in the development of innovative biofertilizer formulations tailored to specific crop needs and soil conditions, enhanced distribution networks, and strategic partnerships to improve market access. The focus on sustainable agriculture and climate change mitigation will further propel market growth in the coming years. The estimated market value is projected to reach €xx Million by 2033.
Europe Biofertilizer Industry Segmentation
- 1. Production Analysis
- 2. Consumption Analysis
- 3. Import Market Analysis (Value & Volume)
- 4. Export Market Analysis (Value & Volume)
- 5. Price Trend Analysis
Europe Biofertilizer Industry Segmentation By Geography
-
1. Europe
- 1.1. United Kingdom
- 1.2. Germany
- 1.3. France
- 1.4. Italy
- 1.5. Spain
- 1.6. Netherlands
- 1.7. Belgium
- 1.8. Sweden
- 1.9. Norway
- 1.10. Poland
- 1.11. Denmark
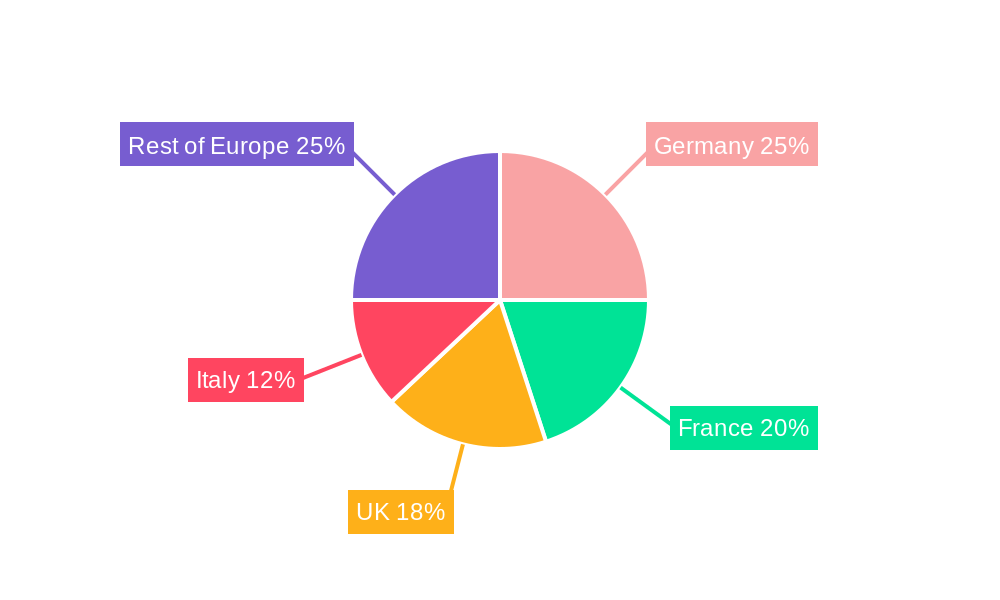
Europe Biofertilizer Industry Regional Market Share
Geographic Coverage of Europe Biofertilizer Industry
Europe Biofertilizer Industry REPORT HIGHLIGHTS
| Aspects | Details |
|---|---|
| Study Period | 2020-2034 |
| Base Year | 2025 |
| Estimated Year | 2026 |
| Forecast Period | 2026-2034 |
| Historical Period | 2020-2025 |
| Growth Rate | CAGR of 12.10% from 2020-2034 |
| Segmentation |
|
Table of Contents
- 1. Introduction
- 1.1. Research Scope
- 1.2. Market Segmentation
- 1.3. Research Objective
- 1.4. Definitions and Assumptions
- 2. Executive Summary
- 2.1. Market Snapshot
- 3. Market Dynamics
- 3.1. Market Drivers
- 3.2. Market Restrains
- 3.3. Market Trends
- 3.4. Market Opportunities
- 4. Market Factor Analysis
- 4.1. Porters Five Forces
- 4.1.1. Bargaining Power of Suppliers
- 4.1.2. Bargaining Power of Buyers
- 4.1.3. Threat of New Entrants
- 4.1.4. Threat of Substitutes
- 4.1.5. Competitive Rivalry
- 4.2. PESTEL analysis
- 4.3. BCG Analysis
- 4.3.1. Stars (High Growth, High Market Share)
- 4.3.2. Cash Cows (Low Growth, High Market Share)
- 4.3.3. Question Mark (High Growth, Low Market Share)
- 4.3.4. Dogs (Low Growth, Low Market Share)
- 4.4. Ansoff Matrix Analysis
- 4.5. Supply Chain Analysis
- 4.6. Regulatory Landscape
- 4.7. Current Market Potential and Opportunity Assessment (TAM–SAM–SOM Framework)
- 4.8. PRI Analyst Note
- 4.1. Porters Five Forces
- 5. Market Analysis, Insights and Forecast 2021-2033
- 5.1. Market Analysis, Insights and Forecast - by Production Analysis
- 5.2. Market Analysis, Insights and Forecast - by Consumption Analysis
- 5.3. Market Analysis, Insights and Forecast - by Import Market Analysis (Value & Volume)
- 5.4. Market Analysis, Insights and Forecast - by Export Market Analysis (Value & Volume)
- 5.5. Market Analysis, Insights and Forecast - by Price Trend Analysis
- 5.6. Market Analysis, Insights and Forecast - by Region
- 5.6.1. Europe
- 6. Europe Biofertilizer Industry Analysis, Insights and Forecast, 2021-2033
- 6.1. Market Analysis, Insights and Forecast - by Production Analysis
- 6.2. Market Analysis, Insights and Forecast - by Consumption Analysis
- 6.3. Market Analysis, Insights and Forecast - by Import Market Analysis (Value & Volume)
- 6.4. Market Analysis, Insights and Forecast - by Export Market Analysis (Value & Volume)
- 6.5. Market Analysis, Insights and Forecast - by Price Trend Analysis
- 7. Competitive Analysis
- 7.1. Company Profiles
- 7.1.1 UAB Bioenergy
- 7.1.1.1. Company Overview
- 7.1.1.2. Products
- 7.1.1.3. Company Financials
- 7.1.1.4. SWOT Analysis
- 7.1.2 Symborg SL
- 7.1.2.1. Company Overview
- 7.1.2.2. Products
- 7.1.2.3. Company Financials
- 7.1.2.4. SWOT Analysis
- 7.1.3 Biomax Naturals
- 7.1.3.1. Company Overview
- 7.1.3.2. Products
- 7.1.3.3. Company Financials
- 7.1.3.4. SWOT Analysis
- 7.1.4 Ficosterra SL
- 7.1.4.1. Company Overview
- 7.1.4.2. Products
- 7.1.4.3. Company Financials
- 7.1.4.4. SWOT Analysis
- 7.1.5 Agrinos AS
- 7.1.5.1. Company Overview
- 7.1.5.2. Products
- 7.1.5.3. Company Financials
- 7.1.5.4. SWOT Analysis
- 7.1.6 Rizobacter Argentina S
- 7.1.6.1. Company Overview
- 7.1.6.2. Products
- 7.1.6.3. Company Financials
- 7.1.6.4. SWOT Analysis
- 7.1.7 Biocorrection AS
- 7.1.7.1. Company Overview
- 7.1.7.2. Products
- 7.1.7.3. Company Financials
- 7.1.7.4. SWOT Analysis
- 7.1.8 ASB Greenworld
- 7.1.8.1. Company Overview
- 7.1.8.2. Products
- 7.1.8.3. Company Financials
- 7.1.8.4. SWOT Analysis
- 7.1.1 UAB Bioenergy
- 7.2. Market Entropy
- 7.2.1 Company's Key Areas Served
- 7.2.2 Recent Developments
- 7.3. Company Market Share Analysis 2025
- 7.3.1 Top 5 Companies Market Share Analysis
- 7.3.2 Top 3 Companies Market Share Analysis
- 7.4. List of Potential Customers
- 8. Research Methodology
List of Figures
- Figure 1: Europe Biofertilizer Industry Revenue Breakdown (Million, %) by Product 2025 & 2033
- Figure 2: Europe Biofertilizer Industry Share (%) by Company 2025
List of Tables
- Table 1: Europe Biofertilizer Industry Revenue Million Forecast, by Production Analysis 2020 & 2033
- Table 2: Europe Biofertilizer Industry Revenue Million Forecast, by Consumption Analysis 2020 & 2033
- Table 3: Europe Biofertilizer Industry Revenue Million Forecast, by Import Market Analysis (Value & Volume) 2020 & 2033
- Table 4: Europe Biofertilizer Industry Revenue Million Forecast, by Export Market Analysis (Value & Volume) 2020 & 2033
- Table 5: Europe Biofertilizer Industry Revenue Million Forecast, by Price Trend Analysis 2020 & 2033
- Table 6: Europe Biofertilizer Industry Revenue Million Forecast, by Region 2020 & 2033
- Table 7: Europe Biofertilizer Industry Revenue Million Forecast, by Production Analysis 2020 & 2033
- Table 8: Europe Biofertilizer Industry Revenue Million Forecast, by Consumption Analysis 2020 & 2033
- Table 9: Europe Biofertilizer Industry Revenue Million Forecast, by Import Market Analysis (Value & Volume) 2020 & 2033
- Table 10: Europe Biofertilizer Industry Revenue Million Forecast, by Export Market Analysis (Value & Volume) 2020 & 2033
- Table 11: Europe Biofertilizer Industry Revenue Million Forecast, by Price Trend Analysis 2020 & 2033
- Table 12: Europe Biofertilizer Industry Revenue Million Forecast, by Country 2020 & 2033
- Table 13: United Kingdom Europe Biofertilizer Industry Revenue (Million) Forecast, by Application 2020 & 2033
- Table 14: Germany Europe Biofertilizer Industry Revenue (Million) Forecast, by Application 2020 & 2033
- Table 15: France Europe Biofertilizer Industry Revenue (Million) Forecast, by Application 2020 & 2033
- Table 16: Italy Europe Biofertilizer Industry Revenue (Million) Forecast, by Application 2020 & 2033
- Table 17: Spain Europe Biofertilizer Industry Revenue (Million) Forecast, by Application 2020 & 2033
- Table 18: Netherlands Europe Biofertilizer Industry Revenue (Million) Forecast, by Application 2020 & 2033
- Table 19: Belgium Europe Biofertilizer Industry Revenue (Million) Forecast, by Application 2020 & 2033
- Table 20: Sweden Europe Biofertilizer Industry Revenue (Million) Forecast, by Application 2020 & 2033
- Table 21: Norway Europe Biofertilizer Industry Revenue (Million) Forecast, by Application 2020 & 2033
- Table 22: Poland Europe Biofertilizer Industry Revenue (Million) Forecast, by Application 2020 & 2033
- Table 23: Denmark Europe Biofertilizer Industry Revenue (Million) Forecast, by Application 2020 & 2033
Frequently Asked Questions
1. What is the projected Compound Annual Growth Rate (CAGR) of the Europe Biofertilizer Industry?
The projected CAGR is approximately 12.10%.
2. Which companies are prominent players in the Europe Biofertilizer Industry?
Key companies in the market include UAB Bioenergy, Symborg SL, Biomax Naturals, Ficosterra SL, Agrinos AS, Rizobacter Argentina S, Biocorrection AS, ASB Greenworld.
3. What are the main segments of the Europe Biofertilizer Industry?
The market segments include Production Analysis, Consumption Analysis, Import Market Analysis (Value & Volume), Export Market Analysis (Value & Volume), Price Trend Analysis.
4. Can you provide details about the market size?
The market size is estimated to be USD 0.65 Million as of 2022.
5. What are some drivers contributing to market growth?
Need for Custom Product Development; Use of CROs for Regulatory Services.
6. What are the notable trends driving market growth?
Adoption of Organic Farming Practice.
7. Are there any restraints impacting market growth?
Data and Cyber Security Concerns; Lack of Experts and Professionals in this Industry.
8. Can you provide examples of recent developments in the market?
June 2022: Novozymes A/S and AgroFresh form a partnership to develop biological solutions and improve post-harvest food quality.
9. What pricing options are available for accessing the report?
Pricing options include single-user, multi-user, and enterprise licenses priced at USD 4750, USD 5250, and USD 8750 respectively.
10. Is the market size provided in terms of value or volume?
The market size is provided in terms of value, measured in Million.
11. Are there any specific market keywords associated with the report?
Yes, the market keyword associated with the report is "Europe Biofertilizer Industry," which aids in identifying and referencing the specific market segment covered.
12. How do I determine which pricing option suits my needs best?
The pricing options vary based on user requirements and access needs. Individual users may opt for single-user licenses, while businesses requiring broader access may choose multi-user or enterprise licenses for cost-effective access to the report.
13. Are there any additional resources or data provided in the Europe Biofertilizer Industry report?
While the report offers comprehensive insights, it's advisable to review the specific contents or supplementary materials provided to ascertain if additional resources or data are available.
14. How can I stay updated on further developments or reports in the Europe Biofertilizer Industry?
To stay informed about further developments, trends, and reports in the Europe Biofertilizer Industry, consider subscribing to industry newsletters, following relevant companies and organizations, or regularly checking reputable industry news sources and publications.
Methodology
Step 1 - Identification of Relevant Samples Size from Population Database


Step 2 - Approaches for Defining Global Market Size (Value, Volume* & Price*)

Note*: In applicable scenarios
Step 3 - Data Sources
Primary Research
- Web Analytics
- Survey Reports
- Research Institute
- Latest Research Reports
- Opinion Leaders
Secondary Research
- Annual Reports
- White Paper
- Latest Press Release
- Industry Association
- Paid Database
- Investor Presentations

Step 4 - Data Triangulation
Involves using different sources of information in order to increase the validity of a study
These sources are likely to be stakeholders in a program - participants, other researchers, program staff, other community members, and so on.
Then we put all data in single framework & apply various statistical tools to find out the dynamic on the market.
During the analysis stage, feedback from the stakeholder groups would be compared to determine areas of agreement as well as areas of divergence