

Key Insights
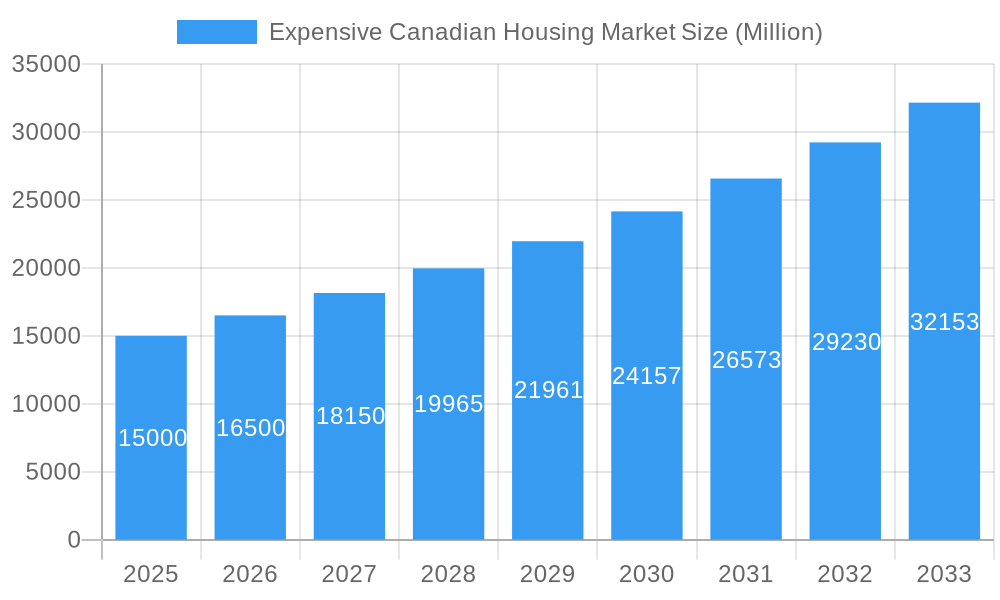
The Canadian luxury housing market, encompassing high-end apartments, condominiums, villas, and landed houses, is experiencing robust growth, with a Compound Annual Growth Rate (CAGR) exceeding 10% from 2019 to 2033. This expansion is driven by several key factors. Firstly, strong immigration continues to fuel demand, particularly in major metropolitan areas like Toronto, Vancouver, and Montreal. These cities attract affluent individuals seeking upscale properties and contribute significantly to market value. Secondly, low interest rates in previous years (though likely shifting now) stimulated investment in the luxury sector, encouraging both domestic and international buyers. Thirdly, a limited supply of luxury homes in desirable locations further propels price appreciation. The market is segmented geographically, with Toronto, Vancouver, and Montreal dominating, followed by Calgary and other significant urban centers. Key players like Onni Group, Concord Pacific, Minto Group, Mattamy Homes, and Westbank Corp are shaping the landscape, continuously developing and launching new luxury projects to meet persistent demand.
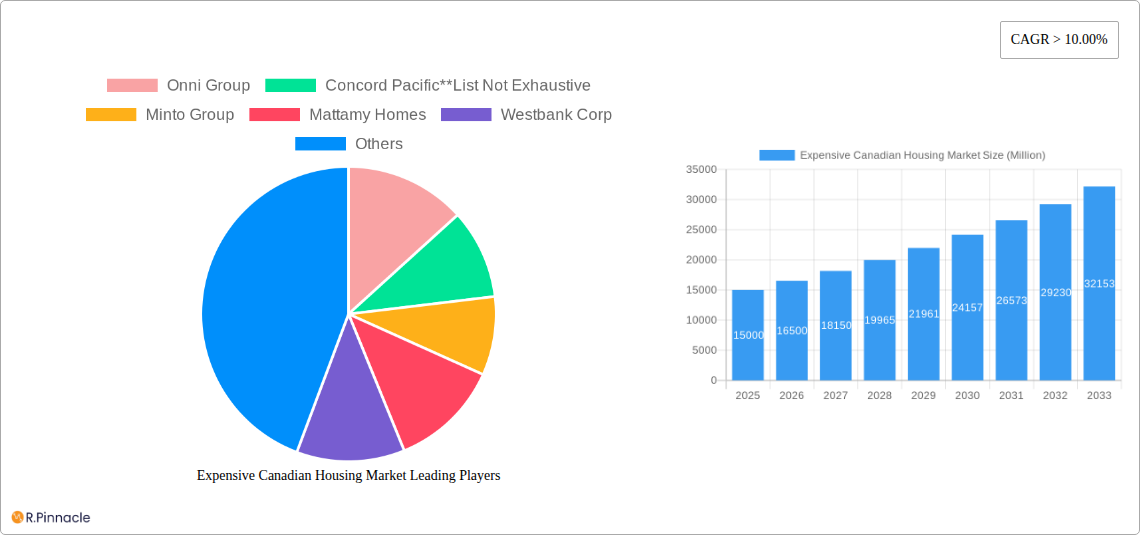
Expensive Canadian Housing Market Market Size (In Billion)
However, the market faces constraints. Rising interest rates, increasing construction costs, and potential government regulations aimed at curbing affordability concerns represent significant headwinds. The impact of economic downturns, both globally and domestically, poses a risk to investor confidence and consequently, demand. Furthermore, concerns about market bubbles and potential price corrections in specific regions necessitate careful market monitoring. Despite these challenges, the overall long-term forecast remains positive, fueled by a persistent demand for high-end properties in key Canadian cities. Analyzing the historical data from 2019-2024 coupled with current market trends allows for a comprehensive projection of continued, though potentially moderated, growth throughout the forecast period (2025-2033). Considering the limited supply and persistent strong demand, a sustained, though potentially slower growth in the coming years is projected.
Expensive Canadian Housing Market Company Market Share
Unlocking the Secrets of Canada's Expensive Housing Market: A Comprehensive Report (2019-2033)
This in-depth report provides a comprehensive analysis of Canada's high-value housing market, offering invaluable insights for industry professionals, investors, and policymakers. Covering the period from 2019 to 2033, with a focus on 2025, this report meticulously examines market dynamics, regional variations, and future trends across key segments. Expect detailed forecasts, market sizing, and actionable intelligence to navigate this complex and lucrative market.
Expensive Canadian Housing Market Market Structure & Innovation Trends
This section analyzes the Canadian luxury housing market's structure, focusing on market concentration, innovation drivers, regulatory influences, and competitive activity. We examine the interplay of established players and emerging disruptors, providing a granular view of the market landscape.
Market Concentration: The Canadian luxury housing market exhibits a moderately concentrated structure, with key players like Onni Group, Concord Pacific, Minto Group, Mattamy Homes, Westbank Corp, The Daniels Corporation, Valencia Residential, Amacon, Brookfield Residential, and Oxford Properties Group commanding significant market share. Precise market share figures for each company are unavailable and vary based on location and market segment, but it's estimated the top 10 players collectively account for over XX% of the market.
Innovation Drivers: Sustainability, smart home technology, and design innovation are key drivers. Demand for energy-efficient buildings and technologically advanced features is rising.
Regulatory Frameworks: Zoning regulations, building codes, and environmental policies significantly influence development costs and project timelines. Changes in these regulations often have a ripple effect on pricing and availability.
M&A Activity: The historical period (2019-2024) saw a moderate level of M&A activity, with deal values estimated to be in the range of XX Million to XX Million. Future activity is projected to be influenced by economic factors and regulatory changes.
Product Substitutes: While direct substitutes are limited, the availability of rental luxury apartments in prime locations and alternative investment options influence demand.
End-User Demographics: High-net-worth individuals, both domestic and foreign, constitute the primary end-user segment, with a strong focus on family-oriented buyers in certain areas and single professionals or couples in others.
Expensive Canadian Housing Market Market Dynamics & Trends
This section dives deep into the forces shaping the luxury housing market, considering growth drivers, technological advancements, evolving consumer preferences, and competitive landscapes.
The Canadian luxury housing market is experiencing dynamic shifts, driven by various factors. Market growth is projected to experience a Compound Annual Growth Rate (CAGR) of XX% between 2025 and 2033, exceeding previous estimates due to sustained demand for high-end properties. This trend is further reinforced by increased market penetration of environmentally friendly and smart home technologies. Consumer preferences are trending towards larger, more sustainable properties with state-of-the-art features; driving competition among developers to meet these demands. The interplay between high demand and limited supply contributes to price appreciation, leading to increased market values.
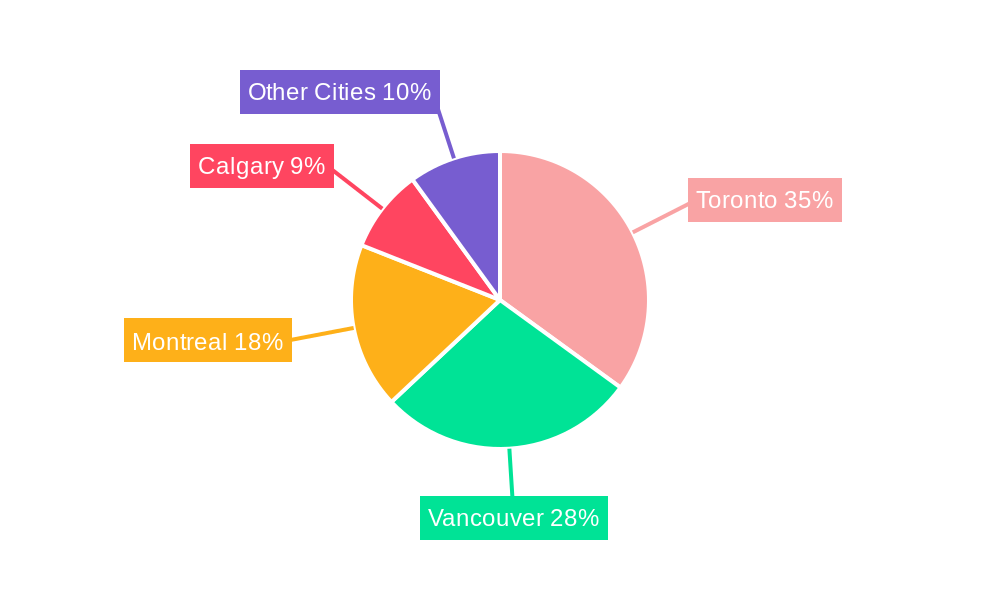
Dominant Regions & Segments in Expensive Canadian Housing Market
This section identifies the leading regions and segments within the Canadian luxury housing market.
By Cities:
Vancouver: Dominates due to its stunning natural beauty, strong economy, and limited land availability, leading to extremely high prices and strong demand. Key drivers include a robust economy, limited land supply, and high immigration rates.
Toronto: A significant contender, driven by strong economic activity, diverse population, and a large influx of immigrants, placing pressure on land resources and driving up prices.
Montreal: Presents a relatively more affordable luxury market compared to Vancouver and Toronto, but its strong cultural scene and growing economy are steadily increasing its attractiveness.
Calgary: While impacted by energy sector fluctuations, Calgary's luxury market remains resilient.
Other Cities: Smaller markets show niche luxury segments, often driven by regional economic drivers or specific amenities.
By Type:
Apartments and Condominiums: High demand due to their convenience in urban settings, contributing significantly to overall market size.
Villas and Landed Houses: High demand, especially in established neighborhoods. Larger properties, and land value drives high price points.
Expensive Canadian Housing Market Product Innovations
The Canadian luxury housing market showcases ongoing innovation in design, materials, and technology. Smart home integrations, sustainable building practices, and luxurious finishes are increasingly sought-after features. This trend is shaping competitive advantages and attracting environmentally conscious buyers. The integration of smart home technologies, particularly security, energy management, and automated systems, provides significant value propositions.
Report Scope & Segmentation Analysis
This report covers the Canadian luxury housing market from 2019-2033, with a specific focus on 2025. The market is segmented by city (Toronto, Montreal, Vancouver, Calgary, and Other Cities) and housing type (Apartments and Condominiums, Villas and Landed Houses). Each segment's market size, growth projections, and competitive dynamics are analyzed. For example, the apartment and condominium segment is estimated to be worth XX Million in 2025, with an expected growth of XX% by 2033. Villas and landed houses hold a comparable value and are predicted to show similar growth trends but face more challenges due to limited land availability.
Key Drivers of Expensive Canadian Housing Market Growth
Key growth drivers include: strong economic performance in major cities, limited land supply, increased immigration, rising disposable incomes among affluent buyers, and sustained demand for luxury properties. Government policies related to immigration and investment also play a significant role.
Challenges in the Expensive Canadian Housing Market Sector
Challenges include limited land availability, particularly in major cities, leading to supply constraints and higher prices. Regulatory hurdles, such as zoning restrictions and environmental regulations, can also impede development. Furthermore, economic downturns or interest rate increases can affect buyer demand, creating market volatility.
Emerging Opportunities in Expensive Canadian Housing Market
Emerging opportunities include the growing demand for sustainable and smart homes. Innovation in construction technologies and materials presents scope for improvement in efficiency and affordability. There is also an opportunity to expand luxury housing options into less saturated secondary and tertiary markets.
Leading Players in the Expensive Canadian Housing Market Market
- Onni Group
- Concord Pacific
- Minto Group
- Mattamy Homes
- Westbank Corp
- The Daniels Corporation
- Valencia Residential
- Amacon
- Brookfield Residential
- Oxford Properties Group
Key Developments in Expensive Canadian Housing Market Industry
- 2022 Q4: Increased interest rates impacted buyer sentiment and transaction volumes in the high-value sector.
- 2023 Q1: Several major developers announced new luxury projects in Toronto and Vancouver.
- 2023 Q3: Significant investment in sustainable building technologies was observed across the sector.
Future Outlook for Expensive Canadian Housing Market Market
The long-term outlook for the Canadian luxury housing market remains positive, though subject to economic and regulatory influences. The continued demand for luxury properties, coupled with limited land availability, suggests the market will see sustained growth despite price fluctuations. Strategic partnerships, innovative building techniques, and sustainability initiatives will be key to maintaining growth and market leadership.
Expensive Canadian Housing Market Segmentation
-
1. Type
- 1.1. Apartments and Condominiums
- 1.2. Villas and Landed Houses
-
2. Cities
- 2.1. Toronto
- 2.2. Montreal
- 2.3. Vancouver
- 2.4. Calgary
- 2.5. Other Cities
Expensive Canadian Housing Market Segmentation By Geography
-
1. North America
- 1.1. United States
- 1.2. Canada
- 1.3. Mexico
-
2. South America
- 2.1. Brazil
- 2.2. Argentina
- 2.3. Rest of South America
-
3. Europe
- 3.1. United Kingdom
- 3.2. Germany
- 3.3. France
- 3.4. Italy
- 3.5. Spain
- 3.6. Russia
- 3.7. Benelux
- 3.8. Nordics
- 3.9. Rest of Europe
-
4. Middle East & Africa
- 4.1. Turkey
- 4.2. Israel
- 4.3. GCC
- 4.4. North Africa
- 4.5. South Africa
- 4.6. Rest of Middle East & Africa
-
5. Asia Pacific
- 5.1. China
- 5.2. India
- 5.3. Japan
- 5.4. South Korea
- 5.5. ASEAN
- 5.6. Oceania
- 5.7. Rest of Asia Pacific
Expensive Canadian Housing Market Regional Market Share
Geographic Coverage of Expensive Canadian Housing Market
Expensive Canadian Housing Market REPORT HIGHLIGHTS
| Aspects | Details |
|---|---|
| Study Period | 2020-2034 |
| Base Year | 2025 |
| Estimated Year | 2026 |
| Forecast Period | 2026-2034 |
| Historical Period | 2020-2025 |
| Growth Rate | CAGR of > 10.00% from 2020-2034 |
| Segmentation |
|
Table of Contents
- 1. Introduction
- 1.1. Research Scope
- 1.2. Market Segmentation
- 1.3. Research Objective
- 1.4. Definitions and Assumptions
- 2. Executive Summary
- 2.1. Market Snapshot
- 3. Market Dynamics
- 3.1. Market Drivers
- 3.2. Market Restrains
- 3.3. Market Trends
- 3.4. Market Opportunities
- 4. Market Factor Analysis
- 4.1. Porters Five Forces
- 4.1.1. Bargaining Power of Suppliers
- 4.1.2. Bargaining Power of Buyers
- 4.1.3. Threat of New Entrants
- 4.1.4. Threat of Substitutes
- 4.1.5. Competitive Rivalry
- 4.2. PESTEL analysis
- 4.3. BCG Analysis
- 4.3.1. Stars (High Growth, High Market Share)
- 4.3.2. Cash Cows (Low Growth, High Market Share)
- 4.3.3. Question Mark (High Growth, Low Market Share)
- 4.3.4. Dogs (Low Growth, Low Market Share)
- 4.4. Ansoff Matrix Analysis
- 4.5. Supply Chain Analysis
- 4.6. Regulatory Landscape
- 4.7. Current Market Potential and Opportunity Assessment (TAM–SAM–SOM Framework)
- 4.8. PRI Analyst Note
- 4.1. Porters Five Forces
- 5. Market Analysis, Insights and Forecast 2021-2033
- 5.1. Market Analysis, Insights and Forecast - by Type
- 5.1.1. Apartments and Condominiums
- 5.1.2. Villas and Landed Houses
- 5.2. Market Analysis, Insights and Forecast - by Cities
- 5.2.1. Toronto
- 5.2.2. Montreal
- 5.2.3. Vancouver
- 5.2.4. Calgary
- 5.2.5. Other Cities
- 5.3. Market Analysis, Insights and Forecast - by Region
- 5.3.1. North America
- 5.3.2. South America
- 5.3.3. Europe
- 5.3.4. Middle East & Africa
- 5.3.5. Asia Pacific
- 5.1. Market Analysis, Insights and Forecast - by Type
- 6. Global Expensive Canadian Housing Market Analysis, Insights and Forecast, 2021-2033
- 6.1. Market Analysis, Insights and Forecast - by Type
- 6.1.1. Apartments and Condominiums
- 6.1.2. Villas and Landed Houses
- 6.2. Market Analysis, Insights and Forecast - by Cities
- 6.2.1. Toronto
- 6.2.2. Montreal
- 6.2.3. Vancouver
- 6.2.4. Calgary
- 6.2.5. Other Cities
- 6.1. Market Analysis, Insights and Forecast - by Type
- 7. North America Expensive Canadian Housing Market Analysis, Insights and Forecast, 2020-2032
- 7.1. Market Analysis, Insights and Forecast - by Type
- 7.1.1. Apartments and Condominiums
- 7.1.2. Villas and Landed Houses
- 7.2. Market Analysis, Insights and Forecast - by Cities
- 7.2.1. Toronto
- 7.2.2. Montreal
- 7.2.3. Vancouver
- 7.2.4. Calgary
- 7.2.5. Other Cities
- 7.1. Market Analysis, Insights and Forecast - by Type
- 8. South America Expensive Canadian Housing Market Analysis, Insights and Forecast, 2020-2032
- 8.1. Market Analysis, Insights and Forecast - by Type
- 8.1.1. Apartments and Condominiums
- 8.1.2. Villas and Landed Houses
- 8.2. Market Analysis, Insights and Forecast - by Cities
- 8.2.1. Toronto
- 8.2.2. Montreal
- 8.2.3. Vancouver
- 8.2.4. Calgary
- 8.2.5. Other Cities
- 8.1. Market Analysis, Insights and Forecast - by Type
- 9. Europe Expensive Canadian Housing Market Analysis, Insights and Forecast, 2020-2032
- 9.1. Market Analysis, Insights and Forecast - by Type
- 9.1.1. Apartments and Condominiums
- 9.1.2. Villas and Landed Houses
- 9.2. Market Analysis, Insights and Forecast - by Cities
- 9.2.1. Toronto
- 9.2.2. Montreal
- 9.2.3. Vancouver
- 9.2.4. Calgary
- 9.2.5. Other Cities
- 9.1. Market Analysis, Insights and Forecast - by Type
- 10. Middle East & Africa Expensive Canadian Housing Market Analysis, Insights and Forecast, 2020-2032
- 10.1. Market Analysis, Insights and Forecast - by Type
- 10.1.1. Apartments and Condominiums
- 10.1.2. Villas and Landed Houses
- 10.2. Market Analysis, Insights and Forecast - by Cities
- 10.2.1. Toronto
- 10.2.2. Montreal
- 10.2.3. Vancouver
- 10.2.4. Calgary
- 10.2.5. Other Cities
- 10.1. Market Analysis, Insights and Forecast - by Type
- 11. Asia Pacific Expensive Canadian Housing Market Analysis, Insights and Forecast, 2020-2032
- 11.1. Market Analysis, Insights and Forecast - by Type
- 11.1.1. Apartments and Condominiums
- 11.1.2. Villas and Landed Houses
- 11.2. Market Analysis, Insights and Forecast - by Cities
- 11.2.1. Toronto
- 11.2.2. Montreal
- 11.2.3. Vancouver
- 11.2.4. Calgary
- 11.2.5. Other Cities
- 11.1. Market Analysis, Insights and Forecast - by Type
- 12. Competitive Analysis
- 12.1. Company Profiles
- 12.1.1 Onni Group
- 12.1.1.1. Company Overview
- 12.1.1.2. Products
- 12.1.1.3. Company Financials
- 12.1.1.4. SWOT Analysis
- 12.1.2 Concord Pacific**List Not Exhaustive
- 12.1.2.1. Company Overview
- 12.1.2.2. Products
- 12.1.2.3. Company Financials
- 12.1.2.4. SWOT Analysis
- 12.1.3 Minto Group
- 12.1.3.1. Company Overview
- 12.1.3.2. Products
- 12.1.3.3. Company Financials
- 12.1.3.4. SWOT Analysis
- 12.1.4 Mattamy Homes
- 12.1.4.1. Company Overview
- 12.1.4.2. Products
- 12.1.4.3. Company Financials
- 12.1.4.4. SWOT Analysis
- 12.1.5 Westbank Corp
- 12.1.5.1. Company Overview
- 12.1.5.2. Products
- 12.1.5.3. Company Financials
- 12.1.5.4. SWOT Analysis
- 12.1.6 The Daniels Corporation
- 12.1.6.1. Company Overview
- 12.1.6.2. Products
- 12.1.6.3. Company Financials
- 12.1.6.4. SWOT Analysis
- 12.1.7 Valencia Residential
- 12.1.7.1. Company Overview
- 12.1.7.2. Products
- 12.1.7.3. Company Financials
- 12.1.7.4. SWOT Analysis
- 12.1.8 Amacon
- 12.1.8.1. Company Overview
- 12.1.8.2. Products
- 12.1.8.3. Company Financials
- 12.1.8.4. SWOT Analysis
- 12.1.9 Brookfield Residential
- 12.1.9.1. Company Overview
- 12.1.9.2. Products
- 12.1.9.3. Company Financials
- 12.1.9.4. SWOT Analysis
- 12.1.10 Oxford Properties Group
- 12.1.10.1. Company Overview
- 12.1.10.2. Products
- 12.1.10.3. Company Financials
- 12.1.10.4. SWOT Analysis
- 12.1.1 Onni Group
- 12.2. Market Entropy
- 12.2.1 Company's Key Areas Served
- 12.2.2 Recent Developments
- 12.3. Company Market Share Analysis 2025
- 12.3.1 Top 5 Companies Market Share Analysis
- 12.3.2 Top 3 Companies Market Share Analysis
- 12.4. List of Potential Customers
- 13. Research Methodology
List of Figures
- Figure 1: Global Expensive Canadian Housing Market Revenue Breakdown (Million, %) by Region 2025 & 2033
- Figure 2: North America Expensive Canadian Housing Market Revenue (Million), by Type 2025 & 2033
- Figure 3: North America Expensive Canadian Housing Market Revenue Share (%), by Type 2025 & 2033
- Figure 4: North America Expensive Canadian Housing Market Revenue (Million), by Cities 2025 & 2033
- Figure 5: North America Expensive Canadian Housing Market Revenue Share (%), by Cities 2025 & 2033
- Figure 6: North America Expensive Canadian Housing Market Revenue (Million), by Country 2025 & 2033
- Figure 7: North America Expensive Canadian Housing Market Revenue Share (%), by Country 2025 & 2033
- Figure 8: South America Expensive Canadian Housing Market Revenue (Million), by Type 2025 & 2033
- Figure 9: South America Expensive Canadian Housing Market Revenue Share (%), by Type 2025 & 2033
- Figure 10: South America Expensive Canadian Housing Market Revenue (Million), by Cities 2025 & 2033
- Figure 11: South America Expensive Canadian Housing Market Revenue Share (%), by Cities 2025 & 2033
- Figure 12: South America Expensive Canadian Housing Market Revenue (Million), by Country 2025 & 2033
- Figure 13: South America Expensive Canadian Housing Market Revenue Share (%), by Country 2025 & 2033
- Figure 14: Europe Expensive Canadian Housing Market Revenue (Million), by Type 2025 & 2033
- Figure 15: Europe Expensive Canadian Housing Market Revenue Share (%), by Type 2025 & 2033
- Figure 16: Europe Expensive Canadian Housing Market Revenue (Million), by Cities 2025 & 2033
- Figure 17: Europe Expensive Canadian Housing Market Revenue Share (%), by Cities 2025 & 2033
- Figure 18: Europe Expensive Canadian Housing Market Revenue (Million), by Country 2025 & 2033
- Figure 19: Europe Expensive Canadian Housing Market Revenue Share (%), by Country 2025 & 2033
- Figure 20: Middle East & Africa Expensive Canadian Housing Market Revenue (Million), by Type 2025 & 2033
- Figure 21: Middle East & Africa Expensive Canadian Housing Market Revenue Share (%), by Type 2025 & 2033
- Figure 22: Middle East & Africa Expensive Canadian Housing Market Revenue (Million), by Cities 2025 & 2033
- Figure 23: Middle East & Africa Expensive Canadian Housing Market Revenue Share (%), by Cities 2025 & 2033
- Figure 24: Middle East & Africa Expensive Canadian Housing Market Revenue (Million), by Country 2025 & 2033
- Figure 25: Middle East & Africa Expensive Canadian Housing Market Revenue Share (%), by Country 2025 & 2033
- Figure 26: Asia Pacific Expensive Canadian Housing Market Revenue (Million), by Type 2025 & 2033
- Figure 27: Asia Pacific Expensive Canadian Housing Market Revenue Share (%), by Type 2025 & 2033
- Figure 28: Asia Pacific Expensive Canadian Housing Market Revenue (Million), by Cities 2025 & 2033
- Figure 29: Asia Pacific Expensive Canadian Housing Market Revenue Share (%), by Cities 2025 & 2033
- Figure 30: Asia Pacific Expensive Canadian Housing Market Revenue (Million), by Country 2025 & 2033
- Figure 31: Asia Pacific Expensive Canadian Housing Market Revenue Share (%), by Country 2025 & 2033
List of Tables
- Table 1: Global Expensive Canadian Housing Market Revenue Million Forecast, by Type 2020 & 2033
- Table 2: Global Expensive Canadian Housing Market Revenue Million Forecast, by Cities 2020 & 2033
- Table 3: Global Expensive Canadian Housing Market Revenue Million Forecast, by Region 2020 & 2033
- Table 4: Global Expensive Canadian Housing Market Revenue Million Forecast, by Type 2020 & 2033
- Table 5: Global Expensive Canadian Housing Market Revenue Million Forecast, by Cities 2020 & 2033
- Table 6: Global Expensive Canadian Housing Market Revenue Million Forecast, by Country 2020 & 2033
- Table 7: United States Expensive Canadian Housing Market Revenue (Million) Forecast, by Application 2020 & 2033
- Table 8: Canada Expensive Canadian Housing Market Revenue (Million) Forecast, by Application 2020 & 2033
- Table 9: Mexico Expensive Canadian Housing Market Revenue (Million) Forecast, by Application 2020 & 2033
- Table 10: Global Expensive Canadian Housing Market Revenue Million Forecast, by Type 2020 & 2033
- Table 11: Global Expensive Canadian Housing Market Revenue Million Forecast, by Cities 2020 & 2033
- Table 12: Global Expensive Canadian Housing Market Revenue Million Forecast, by Country 2020 & 2033
- Table 13: Brazil Expensive Canadian Housing Market Revenue (Million) Forecast, by Application 2020 & 2033
- Table 14: Argentina Expensive Canadian Housing Market Revenue (Million) Forecast, by Application 2020 & 2033
- Table 15: Rest of South America Expensive Canadian Housing Market Revenue (Million) Forecast, by Application 2020 & 2033
- Table 16: Global Expensive Canadian Housing Market Revenue Million Forecast, by Type 2020 & 2033
- Table 17: Global Expensive Canadian Housing Market Revenue Million Forecast, by Cities 2020 & 2033
- Table 18: Global Expensive Canadian Housing Market Revenue Million Forecast, by Country 2020 & 2033
- Table 19: United Kingdom Expensive Canadian Housing Market Revenue (Million) Forecast, by Application 2020 & 2033
- Table 20: Germany Expensive Canadian Housing Market Revenue (Million) Forecast, by Application 2020 & 2033
- Table 21: France Expensive Canadian Housing Market Revenue (Million) Forecast, by Application 2020 & 2033
- Table 22: Italy Expensive Canadian Housing Market Revenue (Million) Forecast, by Application 2020 & 2033
- Table 23: Spain Expensive Canadian Housing Market Revenue (Million) Forecast, by Application 2020 & 2033
- Table 24: Russia Expensive Canadian Housing Market Revenue (Million) Forecast, by Application 2020 & 2033
- Table 25: Benelux Expensive Canadian Housing Market Revenue (Million) Forecast, by Application 2020 & 2033
- Table 26: Nordics Expensive Canadian Housing Market Revenue (Million) Forecast, by Application 2020 & 2033
- Table 27: Rest of Europe Expensive Canadian Housing Market Revenue (Million) Forecast, by Application 2020 & 2033
- Table 28: Global Expensive Canadian Housing Market Revenue Million Forecast, by Type 2020 & 2033
- Table 29: Global Expensive Canadian Housing Market Revenue Million Forecast, by Cities 2020 & 2033
- Table 30: Global Expensive Canadian Housing Market Revenue Million Forecast, by Country 2020 & 2033
- Table 31: Turkey Expensive Canadian Housing Market Revenue (Million) Forecast, by Application 2020 & 2033
- Table 32: Israel Expensive Canadian Housing Market Revenue (Million) Forecast, by Application 2020 & 2033
- Table 33: GCC Expensive Canadian Housing Market Revenue (Million) Forecast, by Application 2020 & 2033
- Table 34: North Africa Expensive Canadian Housing Market Revenue (Million) Forecast, by Application 2020 & 2033
- Table 35: South Africa Expensive Canadian Housing Market Revenue (Million) Forecast, by Application 2020 & 2033
- Table 36: Rest of Middle East & Africa Expensive Canadian Housing Market Revenue (Million) Forecast, by Application 2020 & 2033
- Table 37: Global Expensive Canadian Housing Market Revenue Million Forecast, by Type 2020 & 2033
- Table 38: Global Expensive Canadian Housing Market Revenue Million Forecast, by Cities 2020 & 2033
- Table 39: Global Expensive Canadian Housing Market Revenue Million Forecast, by Country 2020 & 2033
- Table 40: China Expensive Canadian Housing Market Revenue (Million) Forecast, by Application 2020 & 2033
- Table 41: India Expensive Canadian Housing Market Revenue (Million) Forecast, by Application 2020 & 2033
- Table 42: Japan Expensive Canadian Housing Market Revenue (Million) Forecast, by Application 2020 & 2033
- Table 43: South Korea Expensive Canadian Housing Market Revenue (Million) Forecast, by Application 2020 & 2033
- Table 44: ASEAN Expensive Canadian Housing Market Revenue (Million) Forecast, by Application 2020 & 2033
- Table 45: Oceania Expensive Canadian Housing Market Revenue (Million) Forecast, by Application 2020 & 2033
- Table 46: Rest of Asia Pacific Expensive Canadian Housing Market Revenue (Million) Forecast, by Application 2020 & 2033
Frequently Asked Questions
1. What is the projected Compound Annual Growth Rate (CAGR) of the Expensive Canadian Housing Market?
The projected CAGR is approximately > 10.00%.
2. Which companies are prominent players in the Expensive Canadian Housing Market?
Key companies in the market include Onni Group, Concord Pacific**List Not Exhaustive, Minto Group, Mattamy Homes, Westbank Corp, The Daniels Corporation, Valencia Residential, Amacon, Brookfield Residential, Oxford Properties Group.
3. What are the main segments of the Expensive Canadian Housing Market?
The market segments include Type, Cities.
4. Can you provide details about the market size?
The market size is estimated to be USD XX Million as of 2022.
5. What are some drivers contributing to market growth?
Increasing Adoption of Remote and Hybrid Work Model.
6. What are the notable trends driving market growth?
Pandemic Accelerated Luxury Home Sales in Major Canadian Markets.
7. Are there any restraints impacting market growth?
Lack of Privacy.
8. Can you provide examples of recent developments in the market?
N/A
9. What pricing options are available for accessing the report?
Pricing options include single-user, multi-user, and enterprise licenses priced at USD 3800, USD 4500, and USD 5800 respectively.
10. Is the market size provided in terms of value or volume?
The market size is provided in terms of value, measured in Million.
11. Are there any specific market keywords associated with the report?
Yes, the market keyword associated with the report is "Expensive Canadian Housing Market," which aids in identifying and referencing the specific market segment covered.
12. How do I determine which pricing option suits my needs best?
The pricing options vary based on user requirements and access needs. Individual users may opt for single-user licenses, while businesses requiring broader access may choose multi-user or enterprise licenses for cost-effective access to the report.
13. Are there any additional resources or data provided in the Expensive Canadian Housing Market report?
While the report offers comprehensive insights, it's advisable to review the specific contents or supplementary materials provided to ascertain if additional resources or data are available.
14. How can I stay updated on further developments or reports in the Expensive Canadian Housing Market?
To stay informed about further developments, trends, and reports in the Expensive Canadian Housing Market, consider subscribing to industry newsletters, following relevant companies and organizations, or regularly checking reputable industry news sources and publications.
Methodology
Step 1 - Identification of Relevant Samples Size from Population Database


Step 2 - Approaches for Defining Global Market Size (Value, Volume* & Price*)

Note*: In applicable scenarios
Step 3 - Data Sources
Primary Research
- Web Analytics
- Survey Reports
- Research Institute
- Latest Research Reports
- Opinion Leaders
Secondary Research
- Annual Reports
- White Paper
- Latest Press Release
- Industry Association
- Paid Database
- Investor Presentations

Step 4 - Data Triangulation
Involves using different sources of information in order to increase the validity of a study
These sources are likely to be stakeholders in a program - participants, other researchers, program staff, other community members, and so on.
Then we put all data in single framework & apply various statistical tools to find out the dynamic on the market.
During the analysis stage, feedback from the stakeholder groups would be compared to determine areas of agreement as well as areas of divergence