

Key Insights
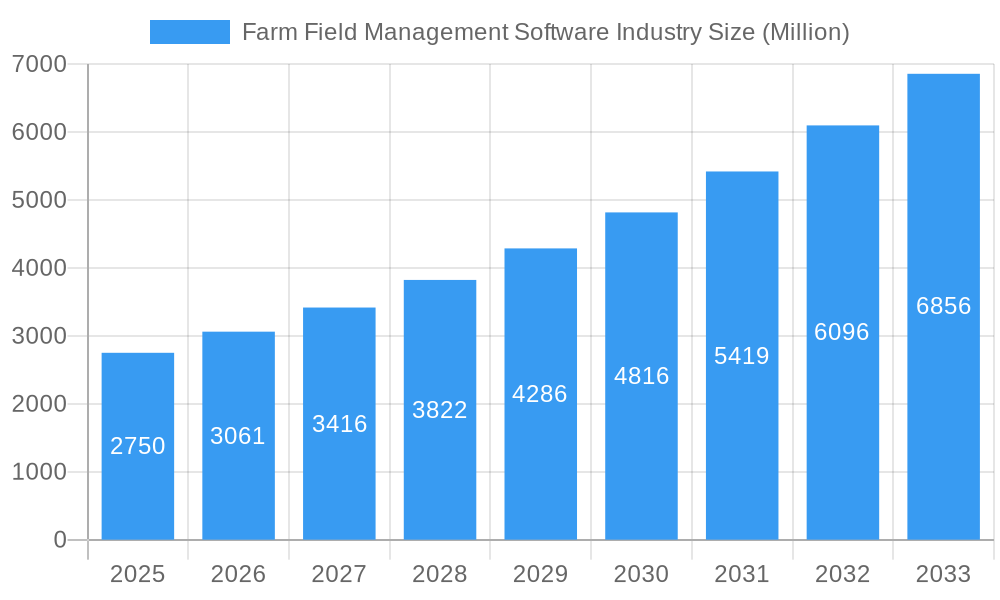
The Farm Field Management Software market is experiencing robust growth, projected to reach a value of $2.75 billion in 2025 and exhibiting a Compound Annual Growth Rate (CAGR) of 11.20% from 2025 to 2033. This expansion is driven by several key factors. Increasing adoption of precision agriculture techniques, coupled with the rising need for efficient resource management and improved crop yields, is a major catalyst. Farmers are increasingly recognizing the value of data-driven decision-making, leading to higher investment in software solutions that offer real-time insights into field conditions, weather patterns, and crop health. Furthermore, the integration of IoT devices and advanced analytics within these software platforms enhances their effectiveness and appeal, creating a positive feedback loop of innovation and adoption. Government initiatives promoting digital agriculture and the availability of affordable internet connectivity in rural areas are also contributing to market growth. The market is segmented by deployment type (local/web-based, cloud-based) and application (precision farming, livestock monitoring, smart greenhouse, aquaculture, and other applications). Cloud-based solutions are gaining traction due to their scalability and accessibility. Precision farming applications currently dominate the market, but growth is expected across all segments as technology advances and its benefits become more widely understood. While data security concerns and the need for reliable internet access present challenges, the overall market outlook remains highly positive.
Farm Field Management Software Industry Market Size (In Billion)
The competitive landscape is dynamic, featuring both established agricultural technology companies like Deere & Company and Trimble Inc., and emerging players like Cropio Group and CropIn Technology Solutions. These companies are focusing on developing user-friendly interfaces, integrating advanced analytics capabilities, and expanding their product portfolios to cater to diverse farming needs across different regions. North America and Europe currently hold significant market shares, reflecting a higher level of technology adoption in these regions. However, the Asia-Pacific region is anticipated to experience substantial growth in the coming years driven by increasing agricultural activity and rising demand for efficient farming practices. Strategic partnerships, mergers and acquisitions, and continuous product innovation are expected to shape the competitive dynamics in the years ahead. The market's future success hinges on addressing the challenges related to data privacy, ensuring interoperability between different software platforms, and providing accessible and affordable solutions for smallholder farmers in developing countries.
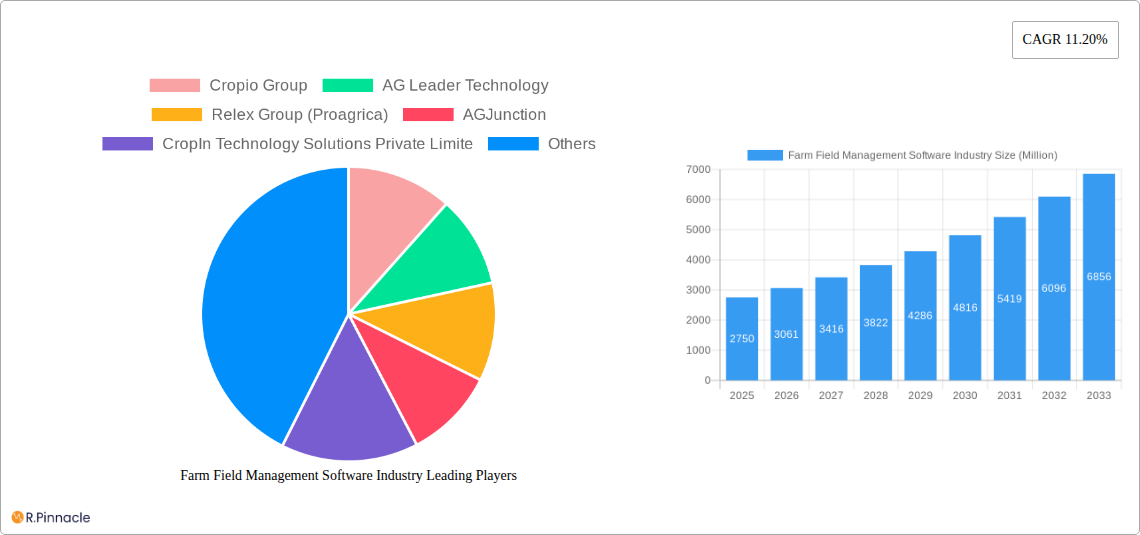
Farm Field Management Software Industry Company Market Share
This comprehensive report provides an in-depth analysis of the Farm Field Management Software industry, offering invaluable insights for industry professionals, investors, and strategic decision-makers. With a study period spanning 2019-2033, a base year of 2025, and a forecast period of 2025-2033, this report unveils the market's current state and future trajectory, supported by robust data and insightful analysis. The market size in 2025 is estimated at $XX Million.
Farm Field Management Software Industry Market Structure & Innovation Trends
The Farm Field Management Software market exhibits a moderately concentrated structure, with key players such as Deere & Company, Trimble Inc., and AGCO Corporation holding significant market share. However, the landscape is dynamic, with a growing number of specialized players offering niche solutions. Innovation is driven by the need for increased efficiency, precision, and sustainability in agriculture. Regulatory frameworks, varying by region, influence market access and data privacy. Product substitutes include traditional manual methods and less sophisticated software solutions, but the increasing adoption of precision farming techniques is favoring the market. End-user demographics comprise a mix of large-scale commercial farms and smaller, family-owned operations. M&A activities, including notable acquisitions such as AGCO's purchase of JCA Industries in May 2022, indicate a drive toward consolidation and technological expansion. These deals are estimated to be worth $XX Million cumulatively in the period 2019-2024.
- Market Concentration: Moderately Concentrated
- Key Players: Deere & Company, Trimble Inc., AGCO Corporation, others
- Innovation Drivers: Precision farming, sustainability, data analytics
- M&A Activity: Significant, with deals focused on technology enhancement and market expansion (e.g., AGCO's acquisition of JCA Industries).
Farm Field Management Software Industry Market Dynamics & Trends
The Farm Field Management Software market is experiencing robust growth, driven by factors such as increasing adoption of precision agriculture techniques, the rising demand for efficient resource management, and growing government support for technological advancements in agriculture. Technological disruptions, such as the proliferation of IoT devices and AI-powered analytics, are transforming operations and enhancing data insights. Consumer preferences are increasingly focused on sustainable and efficient farming practices, driving demand for software solutions that support these goals. Competitive dynamics are characterized by both intense competition among established players and the emergence of innovative startups. The Compound Annual Growth Rate (CAGR) for the period 2025-2033 is projected at xx%, with market penetration steadily increasing among farmers globally. Overall, the industry is poised for significant expansion over the forecast period.
Dominant Regions & Segments in Farm Field Management Software Industry
North America currently holds the leading position in the Farm Field Management Software market, driven by high technological adoption, a well-established agricultural sector, and supportive government policies. However, regions like Europe and Asia-Pacific are also witnessing rapid growth.
Key Drivers of Regional Dominance:
- North America: High technology adoption, robust agricultural sector, favorable regulatory environment.
- Europe: Focus on sustainable agriculture, strong government support for innovation.
- Asia-Pacific: Rapid agricultural modernization, rising investment in agri-tech.
Segment Dominance:
- Type: Cloud-based solutions dominate due to scalability and accessibility.
- Application: Precision farming is currently the largest segment, but livestock monitoring and smart greenhouse applications are experiencing rapid growth.
Farm Field Management Software Industry Product Innovations
Recent product innovations focus on integrating AI and machine learning for predictive analytics, enhanced data visualization, and improved decision-making tools. Integration with IoT sensors and drones allows for real-time monitoring and data collection across vast farmlands. These advancements provide farmers with precise insights, enabling them to optimize resource allocation and enhance yields while reducing costs. The market emphasizes user-friendly interfaces and seamless integration with existing farm management systems to maximize adoption and effectiveness.
Report Scope & Segmentation Analysis
This report segments the Farm Field Management Software market by type (Local/Web-based, Cloud-based) and application (Precision Farming, Livestock Monitoring, Smart Greenhouse, Aquaculture, Other Applications). Each segment's growth projections, market size, and competitive dynamics are analyzed in detail. Cloud-based solutions are expected to show the highest growth due to their scalability and accessibility. Precision farming remains the dominant application segment, but other segments, particularly livestock monitoring and smart greenhouse management, are experiencing notable growth driven by technological advancements and increasing demand for efficient resource management.
Key Drivers of Farm Field Management Software Industry Growth
Several factors fuel the growth of the Farm Field Management Software industry. Technological advancements, such as AI and IoT, provide superior data-driven decision making. Favorable government policies and initiatives promoting digital agriculture accelerate adoption. Increased demand for sustainable and efficient farming practices drives the need for optimized resource management solutions. Economies of scale achieved through software implementation positively impact profitability for farms of all sizes.
Challenges in the Farm Field Management Software Industry Sector
The Farm Field Management Software industry faces challenges such as high initial investment costs for software and hardware, concerns around data security and privacy, and the need for reliable internet connectivity in rural areas. Competition among established players and emerging startups can be intense. The complexity of integrating different software and hardware systems can hinder seamless operation. Lack of digital literacy among some farmers can limit adoption rates. These factors collectively present obstacles to market expansion, resulting in slower adoption rates for certain segments.
Emerging Opportunities in Farm Field Management Software Industry
Emerging opportunities lie in the development of AI-powered predictive analytics for disease prevention and yield optimization, the integration of blockchain technology for supply chain transparency, and the expansion into new markets in developing economies. Growth in the livestock monitoring and smart greenhouse segments presents significant potential. The increasing demand for sustainable farming practices presents a key growth avenue for software solutions focusing on carbon footprint reduction and environmental monitoring.
Leading Players in the Farm Field Management Software Industry Market
- Cropio Group
- AG Leader Technology
- Relex Group (Proagrica)
- AGJunction
- CropIn Technology Solutions Private Limited
- Deere & Company
- Trimble Inc
- Topcon Corporation
- Raven Industries Inc
- Bayer Crop Science (The Climate Corporation)
- Agrivi
- AGCO Corporation
Key Developments in Farm Field Management Software Industry
- April 2021: Cropin Technology Solutions Private Limited opened its first international office in Amsterdam, expanding its market reach.
- April 2022: Deere & Company and GUSS Automation formed a joint venture for semi-autonomous sprayers.
- May 2022: AGCO acquired JCA Industries to boost its engineering and software development capabilities.
Future Outlook for Farm Field Management Software Industry Market
The Farm Field Management Software market is poised for continued expansion driven by technological advancements, increasing demand for data-driven decision making, and the growing adoption of precision agriculture practices globally. Strategic opportunities exist in developing innovative solutions focused on sustainability, integrating with emerging technologies such as blockchain, and expanding into untapped markets in developing economies. The market's future is bright, with significant growth potential over the next decade.
Farm Field Management Software Industry Segmentation
- 1. Production Analysis
- 2. Consumption Analysis
- 3. Import Market Analysis (Value & Volume)
- 4. Export Market Analysis (Value & Volume)
- 5. Price Trend Analysis
Farm Field Management Software Industry Segmentation By Geography
-
1. North America
- 1.1. United States
- 1.2. Canada
- 1.3. Mexico
-
2. South America
- 2.1. Brazil
- 2.2. Argentina
- 2.3. Rest of South America
-
3. Europe
- 3.1. United Kingdom
- 3.2. Germany
- 3.3. France
- 3.4. Italy
- 3.5. Spain
- 3.6. Russia
- 3.7. Benelux
- 3.8. Nordics
- 3.9. Rest of Europe
-
4. Middle East & Africa
- 4.1. Turkey
- 4.2. Israel
- 4.3. GCC
- 4.4. North Africa
- 4.5. South Africa
- 4.6. Rest of Middle East & Africa
-
5. Asia Pacific
- 5.1. China
- 5.2. India
- 5.3. Japan
- 5.4. South Korea
- 5.5. ASEAN
- 5.6. Oceania
- 5.7. Rest of Asia Pacific
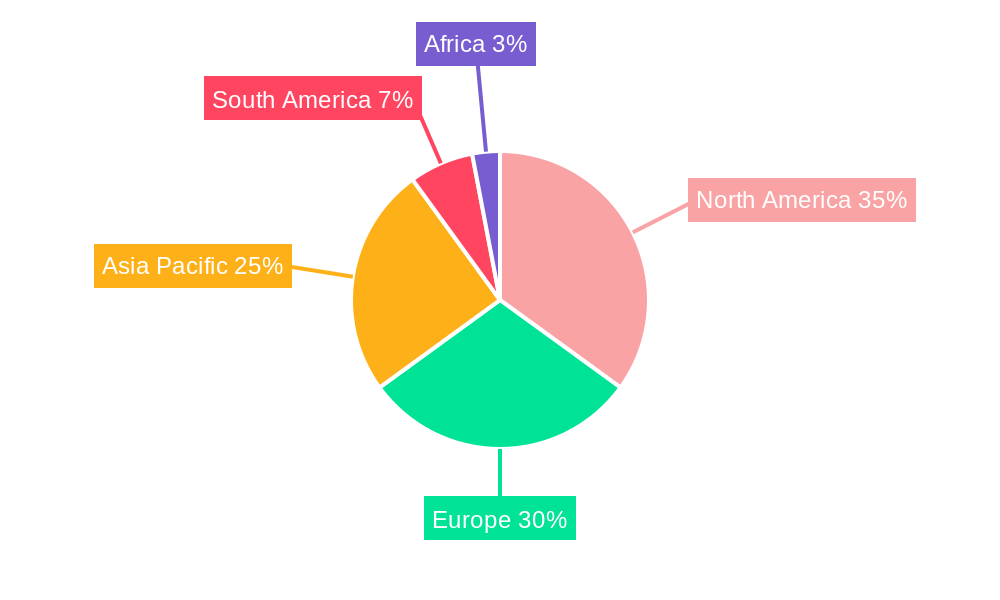
Farm Field Management Software Industry Regional Market Share
Geographic Coverage of Farm Field Management Software Industry
Farm Field Management Software Industry REPORT HIGHLIGHTS
| Aspects | Details |
|---|---|
| Study Period | 2020-2034 |
| Base Year | 2025 |
| Estimated Year | 2026 |
| Forecast Period | 2026-2034 |
| Historical Period | 2020-2025 |
| Growth Rate | CAGR of 11.20% from 2020-2034 |
| Segmentation |
|
Table of Contents
- 1. Introduction
- 1.1. Research Scope
- 1.2. Market Segmentation
- 1.3. Research Objective
- 1.4. Definitions and Assumptions
- 2. Executive Summary
- 2.1. Market Snapshot
- 3. Market Dynamics
- 3.1. Market Drivers
- 3.2. Market Restrains
- 3.3. Market Trends
- 3.4. Market Opportunities
- 4. Market Factor Analysis
- 4.1. Porters Five Forces
- 4.1.1. Bargaining Power of Suppliers
- 4.1.2. Bargaining Power of Buyers
- 4.1.3. Threat of New Entrants
- 4.1.4. Threat of Substitutes
- 4.1.5. Competitive Rivalry
- 4.2. PESTEL analysis
- 4.3. BCG Analysis
- 4.3.1. Stars (High Growth, High Market Share)
- 4.3.2. Cash Cows (Low Growth, High Market Share)
- 4.3.3. Question Mark (High Growth, Low Market Share)
- 4.3.4. Dogs (Low Growth, Low Market Share)
- 4.4. Ansoff Matrix Analysis
- 4.5. Supply Chain Analysis
- 4.6. Regulatory Landscape
- 4.7. Current Market Potential and Opportunity Assessment (TAM–SAM–SOM Framework)
- 4.8. PRI Analyst Note
- 4.1. Porters Five Forces
- 5. Market Analysis, Insights and Forecast 2021-2033
- 5.1. Market Analysis, Insights and Forecast - by Production Analysis
- 5.2. Market Analysis, Insights and Forecast - by Consumption Analysis
- 5.3. Market Analysis, Insights and Forecast - by Import Market Analysis (Value & Volume)
- 5.4. Market Analysis, Insights and Forecast - by Export Market Analysis (Value & Volume)
- 5.5. Market Analysis, Insights and Forecast - by Price Trend Analysis
- 5.6. Market Analysis, Insights and Forecast - by Region
- 5.6.1. North America
- 5.6.2. South America
- 5.6.3. Europe
- 5.6.4. Middle East & Africa
- 5.6.5. Asia Pacific
- 6. Global Farm Field Management Software Industry Analysis, Insights and Forecast, 2021-2033
- 6.1. Market Analysis, Insights and Forecast - by Production Analysis
- 6.2. Market Analysis, Insights and Forecast - by Consumption Analysis
- 6.3. Market Analysis, Insights and Forecast - by Import Market Analysis (Value & Volume)
- 6.4. Market Analysis, Insights and Forecast - by Export Market Analysis (Value & Volume)
- 6.5. Market Analysis, Insights and Forecast - by Price Trend Analysis
- 7. North America Farm Field Management Software Industry Analysis, Insights and Forecast, 2020-2032
- 7.1. Market Analysis, Insights and Forecast - by Production Analysis
- 7.2. Market Analysis, Insights and Forecast - by Consumption Analysis
- 7.3. Market Analysis, Insights and Forecast - by Import Market Analysis (Value & Volume)
- 7.4. Market Analysis, Insights and Forecast - by Export Market Analysis (Value & Volume)
- 7.5. Market Analysis, Insights and Forecast - by Price Trend Analysis
- 8. South America Farm Field Management Software Industry Analysis, Insights and Forecast, 2020-2032
- 8.1. Market Analysis, Insights and Forecast - by Production Analysis
- 8.2. Market Analysis, Insights and Forecast - by Consumption Analysis
- 8.3. Market Analysis, Insights and Forecast - by Import Market Analysis (Value & Volume)
- 8.4. Market Analysis, Insights and Forecast - by Export Market Analysis (Value & Volume)
- 8.5. Market Analysis, Insights and Forecast - by Price Trend Analysis
- 9. Europe Farm Field Management Software Industry Analysis, Insights and Forecast, 2020-2032
- 9.1. Market Analysis, Insights and Forecast - by Production Analysis
- 9.2. Market Analysis, Insights and Forecast - by Consumption Analysis
- 9.3. Market Analysis, Insights and Forecast - by Import Market Analysis (Value & Volume)
- 9.4. Market Analysis, Insights and Forecast - by Export Market Analysis (Value & Volume)
- 9.5. Market Analysis, Insights and Forecast - by Price Trend Analysis
- 10. Middle East & Africa Farm Field Management Software Industry Analysis, Insights and Forecast, 2020-2032
- 10.1. Market Analysis, Insights and Forecast - by Production Analysis
- 10.2. Market Analysis, Insights and Forecast - by Consumption Analysis
- 10.3. Market Analysis, Insights and Forecast - by Import Market Analysis (Value & Volume)
- 10.4. Market Analysis, Insights and Forecast - by Export Market Analysis (Value & Volume)
- 10.5. Market Analysis, Insights and Forecast - by Price Trend Analysis
- 11. Asia Pacific Farm Field Management Software Industry Analysis, Insights and Forecast, 2020-2032
- 11.1. Market Analysis, Insights and Forecast - by Production Analysis
- 11.2. Market Analysis, Insights and Forecast - by Consumption Analysis
- 11.3. Market Analysis, Insights and Forecast - by Import Market Analysis (Value & Volume)
- 11.4. Market Analysis, Insights and Forecast - by Export Market Analysis (Value & Volume)
- 11.5. Market Analysis, Insights and Forecast - by Price Trend Analysis
- 12. Competitive Analysis
- 12.1. Company Profiles
- 12.1.1 Cropio Group
- 12.1.1.1. Company Overview
- 12.1.1.2. Products
- 12.1.1.3. Company Financials
- 12.1.1.4. SWOT Analysis
- 12.1.2 AG Leader Technology
- 12.1.2.1. Company Overview
- 12.1.2.2. Products
- 12.1.2.3. Company Financials
- 12.1.2.4. SWOT Analysis
- 12.1.3 Relex Group (Proagrica)
- 12.1.3.1. Company Overview
- 12.1.3.2. Products
- 12.1.3.3. Company Financials
- 12.1.3.4. SWOT Analysis
- 12.1.4 AGJunction
- 12.1.4.1. Company Overview
- 12.1.4.2. Products
- 12.1.4.3. Company Financials
- 12.1.4.4. SWOT Analysis
- 12.1.5 CropIn Technology Solutions Private Limite
- 12.1.5.1. Company Overview
- 12.1.5.2. Products
- 12.1.5.3. Company Financials
- 12.1.5.4. SWOT Analysis
- 12.1.6 Deere & Company
- 12.1.6.1. Company Overview
- 12.1.6.2. Products
- 12.1.6.3. Company Financials
- 12.1.6.4. SWOT Analysis
- 12.1.7 Trimble Inc
- 12.1.7.1. Company Overview
- 12.1.7.2. Products
- 12.1.7.3. Company Financials
- 12.1.7.4. SWOT Analysis
- 12.1.8 Topcon Corporation
- 12.1.8.1. Company Overview
- 12.1.8.2. Products
- 12.1.8.3. Company Financials
- 12.1.8.4. SWOT Analysis
- 12.1.9 Raven Industries Inc
- 12.1.9.1. Company Overview
- 12.1.9.2. Products
- 12.1.9.3. Company Financials
- 12.1.9.4. SWOT Analysis
- 12.1.10 Bayer Crop Science (The Climate Corporation)
- 12.1.10.1. Company Overview
- 12.1.10.2. Products
- 12.1.10.3. Company Financials
- 12.1.10.4. SWOT Analysis
- 12.1.11 Agrivi
- 12.1.11.1. Company Overview
- 12.1.11.2. Products
- 12.1.11.3. Company Financials
- 12.1.11.4. SWOT Analysis
- 12.1.12 AGCO Corporation
- 12.1.12.1. Company Overview
- 12.1.12.2. Products
- 12.1.12.3. Company Financials
- 12.1.12.4. SWOT Analysis
- 12.1.1 Cropio Group
- 12.2. Market Entropy
- 12.2.1 Company's Key Areas Served
- 12.2.2 Recent Developments
- 12.3. Company Market Share Analysis 2025
- 12.3.1 Top 5 Companies Market Share Analysis
- 12.3.2 Top 3 Companies Market Share Analysis
- 12.4. List of Potential Customers
- 13. Research Methodology
List of Figures
- Figure 1: Global Farm Field Management Software Industry Revenue Breakdown (Million, %) by Region 2025 & 2033
- Figure 2: North America Farm Field Management Software Industry Revenue (Million), by Production Analysis 2025 & 2033
- Figure 3: North America Farm Field Management Software Industry Revenue Share (%), by Production Analysis 2025 & 2033
- Figure 4: North America Farm Field Management Software Industry Revenue (Million), by Consumption Analysis 2025 & 2033
- Figure 5: North America Farm Field Management Software Industry Revenue Share (%), by Consumption Analysis 2025 & 2033
- Figure 6: North America Farm Field Management Software Industry Revenue (Million), by Import Market Analysis (Value & Volume) 2025 & 2033
- Figure 7: North America Farm Field Management Software Industry Revenue Share (%), by Import Market Analysis (Value & Volume) 2025 & 2033
- Figure 8: North America Farm Field Management Software Industry Revenue (Million), by Export Market Analysis (Value & Volume) 2025 & 2033
- Figure 9: North America Farm Field Management Software Industry Revenue Share (%), by Export Market Analysis (Value & Volume) 2025 & 2033
- Figure 10: North America Farm Field Management Software Industry Revenue (Million), by Price Trend Analysis 2025 & 2033
- Figure 11: North America Farm Field Management Software Industry Revenue Share (%), by Price Trend Analysis 2025 & 2033
- Figure 12: North America Farm Field Management Software Industry Revenue (Million), by Country 2025 & 2033
- Figure 13: North America Farm Field Management Software Industry Revenue Share (%), by Country 2025 & 2033
- Figure 14: South America Farm Field Management Software Industry Revenue (Million), by Production Analysis 2025 & 2033
- Figure 15: South America Farm Field Management Software Industry Revenue Share (%), by Production Analysis 2025 & 2033
- Figure 16: South America Farm Field Management Software Industry Revenue (Million), by Consumption Analysis 2025 & 2033
- Figure 17: South America Farm Field Management Software Industry Revenue Share (%), by Consumption Analysis 2025 & 2033
- Figure 18: South America Farm Field Management Software Industry Revenue (Million), by Import Market Analysis (Value & Volume) 2025 & 2033
- Figure 19: South America Farm Field Management Software Industry Revenue Share (%), by Import Market Analysis (Value & Volume) 2025 & 2033
- Figure 20: South America Farm Field Management Software Industry Revenue (Million), by Export Market Analysis (Value & Volume) 2025 & 2033
- Figure 21: South America Farm Field Management Software Industry Revenue Share (%), by Export Market Analysis (Value & Volume) 2025 & 2033
- Figure 22: South America Farm Field Management Software Industry Revenue (Million), by Price Trend Analysis 2025 & 2033
- Figure 23: South America Farm Field Management Software Industry Revenue Share (%), by Price Trend Analysis 2025 & 2033
- Figure 24: South America Farm Field Management Software Industry Revenue (Million), by Country 2025 & 2033
- Figure 25: South America Farm Field Management Software Industry Revenue Share (%), by Country 2025 & 2033
- Figure 26: Europe Farm Field Management Software Industry Revenue (Million), by Production Analysis 2025 & 2033
- Figure 27: Europe Farm Field Management Software Industry Revenue Share (%), by Production Analysis 2025 & 2033
- Figure 28: Europe Farm Field Management Software Industry Revenue (Million), by Consumption Analysis 2025 & 2033
- Figure 29: Europe Farm Field Management Software Industry Revenue Share (%), by Consumption Analysis 2025 & 2033
- Figure 30: Europe Farm Field Management Software Industry Revenue (Million), by Import Market Analysis (Value & Volume) 2025 & 2033
- Figure 31: Europe Farm Field Management Software Industry Revenue Share (%), by Import Market Analysis (Value & Volume) 2025 & 2033
- Figure 32: Europe Farm Field Management Software Industry Revenue (Million), by Export Market Analysis (Value & Volume) 2025 & 2033
- Figure 33: Europe Farm Field Management Software Industry Revenue Share (%), by Export Market Analysis (Value & Volume) 2025 & 2033
- Figure 34: Europe Farm Field Management Software Industry Revenue (Million), by Price Trend Analysis 2025 & 2033
- Figure 35: Europe Farm Field Management Software Industry Revenue Share (%), by Price Trend Analysis 2025 & 2033
- Figure 36: Europe Farm Field Management Software Industry Revenue (Million), by Country 2025 & 2033
- Figure 37: Europe Farm Field Management Software Industry Revenue Share (%), by Country 2025 & 2033
- Figure 38: Middle East & Africa Farm Field Management Software Industry Revenue (Million), by Production Analysis 2025 & 2033
- Figure 39: Middle East & Africa Farm Field Management Software Industry Revenue Share (%), by Production Analysis 2025 & 2033
- Figure 40: Middle East & Africa Farm Field Management Software Industry Revenue (Million), by Consumption Analysis 2025 & 2033
- Figure 41: Middle East & Africa Farm Field Management Software Industry Revenue Share (%), by Consumption Analysis 2025 & 2033
- Figure 42: Middle East & Africa Farm Field Management Software Industry Revenue (Million), by Import Market Analysis (Value & Volume) 2025 & 2033
- Figure 43: Middle East & Africa Farm Field Management Software Industry Revenue Share (%), by Import Market Analysis (Value & Volume) 2025 & 2033
- Figure 44: Middle East & Africa Farm Field Management Software Industry Revenue (Million), by Export Market Analysis (Value & Volume) 2025 & 2033
- Figure 45: Middle East & Africa Farm Field Management Software Industry Revenue Share (%), by Export Market Analysis (Value & Volume) 2025 & 2033
- Figure 46: Middle East & Africa Farm Field Management Software Industry Revenue (Million), by Price Trend Analysis 2025 & 2033
- Figure 47: Middle East & Africa Farm Field Management Software Industry Revenue Share (%), by Price Trend Analysis 2025 & 2033
- Figure 48: Middle East & Africa Farm Field Management Software Industry Revenue (Million), by Country 2025 & 2033
- Figure 49: Middle East & Africa Farm Field Management Software Industry Revenue Share (%), by Country 2025 & 2033
- Figure 50: Asia Pacific Farm Field Management Software Industry Revenue (Million), by Production Analysis 2025 & 2033
- Figure 51: Asia Pacific Farm Field Management Software Industry Revenue Share (%), by Production Analysis 2025 & 2033
- Figure 52: Asia Pacific Farm Field Management Software Industry Revenue (Million), by Consumption Analysis 2025 & 2033
- Figure 53: Asia Pacific Farm Field Management Software Industry Revenue Share (%), by Consumption Analysis 2025 & 2033
- Figure 54: Asia Pacific Farm Field Management Software Industry Revenue (Million), by Import Market Analysis (Value & Volume) 2025 & 2033
- Figure 55: Asia Pacific Farm Field Management Software Industry Revenue Share (%), by Import Market Analysis (Value & Volume) 2025 & 2033
- Figure 56: Asia Pacific Farm Field Management Software Industry Revenue (Million), by Export Market Analysis (Value & Volume) 2025 & 2033
- Figure 57: Asia Pacific Farm Field Management Software Industry Revenue Share (%), by Export Market Analysis (Value & Volume) 2025 & 2033
- Figure 58: Asia Pacific Farm Field Management Software Industry Revenue (Million), by Price Trend Analysis 2025 & 2033
- Figure 59: Asia Pacific Farm Field Management Software Industry Revenue Share (%), by Price Trend Analysis 2025 & 2033
- Figure 60: Asia Pacific Farm Field Management Software Industry Revenue (Million), by Country 2025 & 2033
- Figure 61: Asia Pacific Farm Field Management Software Industry Revenue Share (%), by Country 2025 & 2033
List of Tables
- Table 1: Global Farm Field Management Software Industry Revenue Million Forecast, by Production Analysis 2020 & 2033
- Table 2: Global Farm Field Management Software Industry Revenue Million Forecast, by Consumption Analysis 2020 & 2033
- Table 3: Global Farm Field Management Software Industry Revenue Million Forecast, by Import Market Analysis (Value & Volume) 2020 & 2033
- Table 4: Global Farm Field Management Software Industry Revenue Million Forecast, by Export Market Analysis (Value & Volume) 2020 & 2033
- Table 5: Global Farm Field Management Software Industry Revenue Million Forecast, by Price Trend Analysis 2020 & 2033
- Table 6: Global Farm Field Management Software Industry Revenue Million Forecast, by Region 2020 & 2033
- Table 7: Global Farm Field Management Software Industry Revenue Million Forecast, by Production Analysis 2020 & 2033
- Table 8: Global Farm Field Management Software Industry Revenue Million Forecast, by Consumption Analysis 2020 & 2033
- Table 9: Global Farm Field Management Software Industry Revenue Million Forecast, by Import Market Analysis (Value & Volume) 2020 & 2033
- Table 10: Global Farm Field Management Software Industry Revenue Million Forecast, by Export Market Analysis (Value & Volume) 2020 & 2033
- Table 11: Global Farm Field Management Software Industry Revenue Million Forecast, by Price Trend Analysis 2020 & 2033
- Table 12: Global Farm Field Management Software Industry Revenue Million Forecast, by Country 2020 & 2033
- Table 13: United States Farm Field Management Software Industry Revenue (Million) Forecast, by Application 2020 & 2033
- Table 14: Canada Farm Field Management Software Industry Revenue (Million) Forecast, by Application 2020 & 2033
- Table 15: Mexico Farm Field Management Software Industry Revenue (Million) Forecast, by Application 2020 & 2033
- Table 16: Global Farm Field Management Software Industry Revenue Million Forecast, by Production Analysis 2020 & 2033
- Table 17: Global Farm Field Management Software Industry Revenue Million Forecast, by Consumption Analysis 2020 & 2033
- Table 18: Global Farm Field Management Software Industry Revenue Million Forecast, by Import Market Analysis (Value & Volume) 2020 & 2033
- Table 19: Global Farm Field Management Software Industry Revenue Million Forecast, by Export Market Analysis (Value & Volume) 2020 & 2033
- Table 20: Global Farm Field Management Software Industry Revenue Million Forecast, by Price Trend Analysis 2020 & 2033
- Table 21: Global Farm Field Management Software Industry Revenue Million Forecast, by Country 2020 & 2033
- Table 22: Brazil Farm Field Management Software Industry Revenue (Million) Forecast, by Application 2020 & 2033
- Table 23: Argentina Farm Field Management Software Industry Revenue (Million) Forecast, by Application 2020 & 2033
- Table 24: Rest of South America Farm Field Management Software Industry Revenue (Million) Forecast, by Application 2020 & 2033
- Table 25: Global Farm Field Management Software Industry Revenue Million Forecast, by Production Analysis 2020 & 2033
- Table 26: Global Farm Field Management Software Industry Revenue Million Forecast, by Consumption Analysis 2020 & 2033
- Table 27: Global Farm Field Management Software Industry Revenue Million Forecast, by Import Market Analysis (Value & Volume) 2020 & 2033
- Table 28: Global Farm Field Management Software Industry Revenue Million Forecast, by Export Market Analysis (Value & Volume) 2020 & 2033
- Table 29: Global Farm Field Management Software Industry Revenue Million Forecast, by Price Trend Analysis 2020 & 2033
- Table 30: Global Farm Field Management Software Industry Revenue Million Forecast, by Country 2020 & 2033
- Table 31: United Kingdom Farm Field Management Software Industry Revenue (Million) Forecast, by Application 2020 & 2033
- Table 32: Germany Farm Field Management Software Industry Revenue (Million) Forecast, by Application 2020 & 2033
- Table 33: France Farm Field Management Software Industry Revenue (Million) Forecast, by Application 2020 & 2033
- Table 34: Italy Farm Field Management Software Industry Revenue (Million) Forecast, by Application 2020 & 2033
- Table 35: Spain Farm Field Management Software Industry Revenue (Million) Forecast, by Application 2020 & 2033
- Table 36: Russia Farm Field Management Software Industry Revenue (Million) Forecast, by Application 2020 & 2033
- Table 37: Benelux Farm Field Management Software Industry Revenue (Million) Forecast, by Application 2020 & 2033
- Table 38: Nordics Farm Field Management Software Industry Revenue (Million) Forecast, by Application 2020 & 2033
- Table 39: Rest of Europe Farm Field Management Software Industry Revenue (Million) Forecast, by Application 2020 & 2033
- Table 40: Global Farm Field Management Software Industry Revenue Million Forecast, by Production Analysis 2020 & 2033
- Table 41: Global Farm Field Management Software Industry Revenue Million Forecast, by Consumption Analysis 2020 & 2033
- Table 42: Global Farm Field Management Software Industry Revenue Million Forecast, by Import Market Analysis (Value & Volume) 2020 & 2033
- Table 43: Global Farm Field Management Software Industry Revenue Million Forecast, by Export Market Analysis (Value & Volume) 2020 & 2033
- Table 44: Global Farm Field Management Software Industry Revenue Million Forecast, by Price Trend Analysis 2020 & 2033
- Table 45: Global Farm Field Management Software Industry Revenue Million Forecast, by Country 2020 & 2033
- Table 46: Turkey Farm Field Management Software Industry Revenue (Million) Forecast, by Application 2020 & 2033
- Table 47: Israel Farm Field Management Software Industry Revenue (Million) Forecast, by Application 2020 & 2033
- Table 48: GCC Farm Field Management Software Industry Revenue (Million) Forecast, by Application 2020 & 2033
- Table 49: North Africa Farm Field Management Software Industry Revenue (Million) Forecast, by Application 2020 & 2033
- Table 50: South Africa Farm Field Management Software Industry Revenue (Million) Forecast, by Application 2020 & 2033
- Table 51: Rest of Middle East & Africa Farm Field Management Software Industry Revenue (Million) Forecast, by Application 2020 & 2033
- Table 52: Global Farm Field Management Software Industry Revenue Million Forecast, by Production Analysis 2020 & 2033
- Table 53: Global Farm Field Management Software Industry Revenue Million Forecast, by Consumption Analysis 2020 & 2033
- Table 54: Global Farm Field Management Software Industry Revenue Million Forecast, by Import Market Analysis (Value & Volume) 2020 & 2033
- Table 55: Global Farm Field Management Software Industry Revenue Million Forecast, by Export Market Analysis (Value & Volume) 2020 & 2033
- Table 56: Global Farm Field Management Software Industry Revenue Million Forecast, by Price Trend Analysis 2020 & 2033
- Table 57: Global Farm Field Management Software Industry Revenue Million Forecast, by Country 2020 & 2033
- Table 58: China Farm Field Management Software Industry Revenue (Million) Forecast, by Application 2020 & 2033
- Table 59: India Farm Field Management Software Industry Revenue (Million) Forecast, by Application 2020 & 2033
- Table 60: Japan Farm Field Management Software Industry Revenue (Million) Forecast, by Application 2020 & 2033
- Table 61: South Korea Farm Field Management Software Industry Revenue (Million) Forecast, by Application 2020 & 2033
- Table 62: ASEAN Farm Field Management Software Industry Revenue (Million) Forecast, by Application 2020 & 2033
- Table 63: Oceania Farm Field Management Software Industry Revenue (Million) Forecast, by Application 2020 & 2033
- Table 64: Rest of Asia Pacific Farm Field Management Software Industry Revenue (Million) Forecast, by Application 2020 & 2033
Frequently Asked Questions
1. What is the projected Compound Annual Growth Rate (CAGR) of the Farm Field Management Software Industry?
The projected CAGR is approximately 11.20%.
2. Which companies are prominent players in the Farm Field Management Software Industry?
Key companies in the market include Cropio Group, AG Leader Technology, Relex Group (Proagrica), AGJunction, CropIn Technology Solutions Private Limite, Deere & Company, Trimble Inc, Topcon Corporation, Raven Industries Inc, Bayer Crop Science (The Climate Corporation), Agrivi, AGCO Corporation.
3. What are the main segments of the Farm Field Management Software Industry?
The market segments include Production Analysis, Consumption Analysis, Import Market Analysis (Value & Volume), Export Market Analysis (Value & Volume), Price Trend Analysis.
4. Can you provide details about the market size?
The market size is estimated to be USD 2.75 Million as of 2022.
5. What are some drivers contributing to market growth?
Low Availability of Skilled Labor; Technological Advancements.
6. What are the notable trends driving market growth?
Farm Labor Shortage and Decreasing Arable Land.
7. Are there any restraints impacting market growth?
Increasing Farm Expenditure; Security Concerns in Modern Farming Machinery.
8. Can you provide examples of recent developments in the market?
May 2022: AGCO acquired JCA Industries to increase engineering and software development capabilities and to accelerate the development of highly automated and autonomous machines.
9. What pricing options are available for accessing the report?
Pricing options include single-user, multi-user, and enterprise licenses priced at USD 4750, USD 5250, and USD 8750 respectively.
10. Is the market size provided in terms of value or volume?
The market size is provided in terms of value, measured in Million.
11. Are there any specific market keywords associated with the report?
Yes, the market keyword associated with the report is "Farm Field Management Software Industry," which aids in identifying and referencing the specific market segment covered.
12. How do I determine which pricing option suits my needs best?
The pricing options vary based on user requirements and access needs. Individual users may opt for single-user licenses, while businesses requiring broader access may choose multi-user or enterprise licenses for cost-effective access to the report.
13. Are there any additional resources or data provided in the Farm Field Management Software Industry report?
While the report offers comprehensive insights, it's advisable to review the specific contents or supplementary materials provided to ascertain if additional resources or data are available.
14. How can I stay updated on further developments or reports in the Farm Field Management Software Industry?
To stay informed about further developments, trends, and reports in the Farm Field Management Software Industry, consider subscribing to industry newsletters, following relevant companies and organizations, or regularly checking reputable industry news sources and publications.
Methodology
Step 1 - Identification of Relevant Samples Size from Population Database


Step 2 - Approaches for Defining Global Market Size (Value, Volume* & Price*)

Note*: In applicable scenarios
Step 3 - Data Sources
Primary Research
- Web Analytics
- Survey Reports
- Research Institute
- Latest Research Reports
- Opinion Leaders
Secondary Research
- Annual Reports
- White Paper
- Latest Press Release
- Industry Association
- Paid Database
- Investor Presentations

Step 4 - Data Triangulation
Involves using different sources of information in order to increase the validity of a study
These sources are likely to be stakeholders in a program - participants, other researchers, program staff, other community members, and so on.
Then we put all data in single framework & apply various statistical tools to find out the dynamic on the market.
During the analysis stage, feedback from the stakeholder groups would be compared to determine areas of agreement as well as areas of divergence