Strategizing Growth: Feed Testing Market Market’s Decade Ahead 2025-2033

Feed Testing Market by Production Analysis, by Consumption Analysis, by Import Market Analysis (Value & Volume), by Export Market Analysis (Value & Volume), by Price Trend Analysis, by North America (United States, Canada, Mexico), by South America (Brazil, Argentina, Rest of South America), by Europe (United Kingdom, Germany, France, Italy, Spain, Russia, Benelux, Nordics, Rest of Europe), by Middle East & Africa (Turkey, Israel, GCC, North Africa, South Africa, Rest of Middle East & Africa), by Asia Pacific (China, India, Japan, South Korea, ASEAN, Oceania, Rest of Asia Pacific) Forecast 2025-2033

Jun 30 2025
Base Year: 2024

180 Pages
Main Logo

Strategizing Growth: Feed Testing Market Market’s Decade Ahead 2025-2033


Home
Industries
Agriculture
sponsor image

Tailored for you

  • In-depth Analysis Tailored to Specified Regions or Segments
  • Company Profiles Customized to User Preferences
  • Comprehensive Insights Focused on Specific Segments or Regions
  • Customized Evaluation of Competitive Landscape to Meet Your Needs
  • Tailored Customization to Address Other Specific Requirements
Ask for customization


Key Insights

The global feed testing market, valued at $2.54 billion in 2025, is projected to experience robust growth, driven by increasing consumer demand for safe and high-quality animal products. Stringent government regulations regarding food safety and the rising prevalence of foodborne illnesses are key catalysts. The market is segmented by testing type (pathogen testing, pesticide residue analysis, nutritional labeling analysis, fats and oils analysis, mycotoxin testing, and others) and feed type (ruminant, poultry, swine, aquaculture, and pet food). Pathogen testing currently holds the largest segment share due to concerns over zoonotic diseases and the potential for contamination throughout the supply chain. The growing aquaculture and pet food sectors are also significantly contributing to market expansion, fueling demand for specialized testing services. Geographically, North America and Europe currently dominate the market, but the Asia-Pacific region is poised for significant growth due to expanding livestock farming and rising disposable incomes. Technological advancements, such as the development of rapid and accurate testing methods, are further driving market expansion. However, factors like high testing costs and a lack of awareness in certain regions could pose challenges to market growth in the near term.
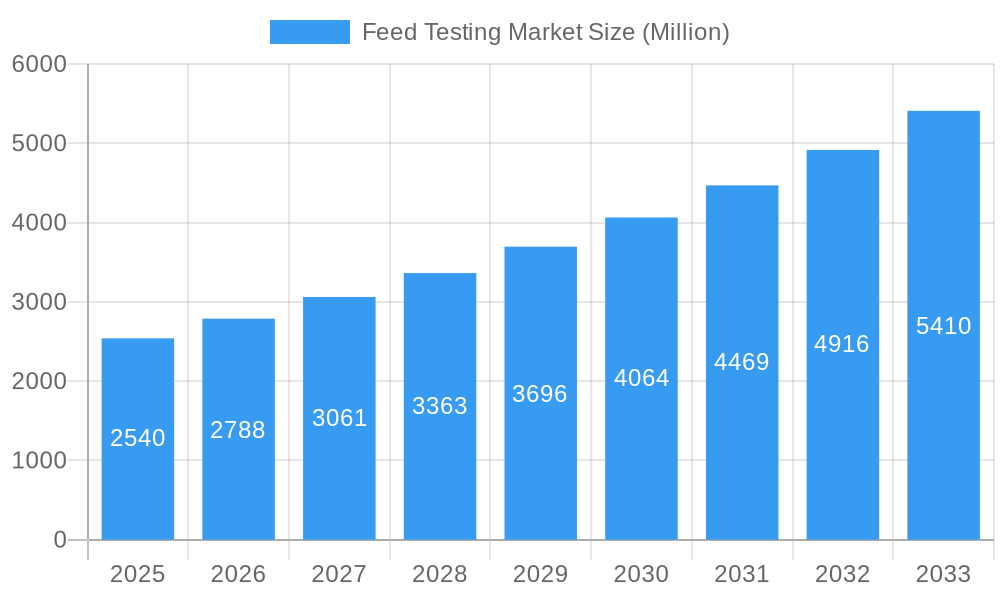
The projected Compound Annual Growth Rate (CAGR) of 9.80% from 2025 to 2033 suggests a significant market expansion. This growth is expected to be fueled by continuous improvements in testing technologies, leading to faster, more accurate, and cost-effective solutions. The increasing adoption of advanced analytical techniques, such as PCR and ELISA, is driving efficiency and accuracy in pathogen detection. Moreover, the rising awareness of mycotoxin contamination and its detrimental effects on animal health is boosting demand for mycotoxin testing services. The competitive landscape is characterized by a mix of large multinational companies offering comprehensive testing solutions and smaller, specialized labs catering to niche markets. Strategic partnerships, acquisitions, and technological innovations are expected to shape the competitive dynamics in the coming years.
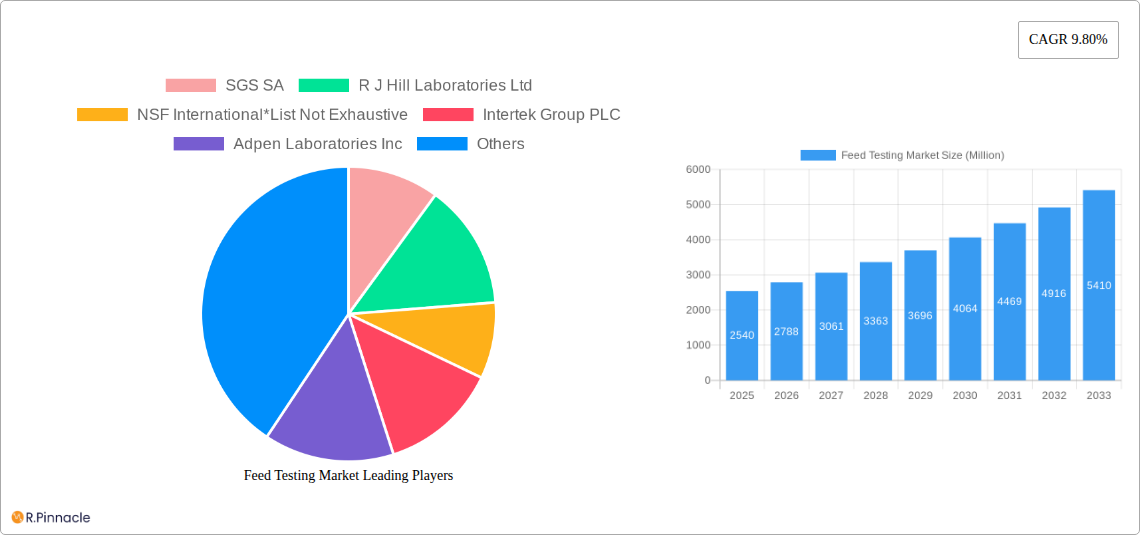
Feed Testing Market Research Report - Market Size, Growth & Forecast

Feed Testing Market: A Comprehensive Report (2019-2033)

This comprehensive report provides an in-depth analysis of the global Feed Testing Market, offering invaluable insights for industry professionals, investors, and stakeholders. Covering the period from 2019 to 2033, with a focus on the 2025-2033 forecast period, this report unveils the market's structure, dynamics, dominant segments, and key players, enabling informed decision-making and strategic planning. The market is projected to reach xx Million by 2033, exhibiting a CAGR of xx% during the forecast period.

Feed Testing Market Market Structure & Innovation Trends

The Feed Testing market demonstrates a moderately concentrated structure, with key players such as SGS SA, R J Hill Laboratories Ltd, NSF International, Intertek Group PLC, Adpen Laboratories Inc, Bruker Biosciences Corporation, Genetic ID NA Inc, Genon Laboratories Ltd, Eurofins Scientific, and Invisible Sentinel Inc. holding significant market share. While precise market share figures are proprietary to the full report, SGS SA and Eurofins Scientific are estimated to command a combined market share exceeding xx%. The market is characterized by ongoing M&A activity, with deal values reaching xx Million in recent years, driving consolidation and expansion. Innovation is fueled by stringent regulatory frameworks, demanding increasingly sensitive and rapid testing methods for pathogens, mycotoxins, and pesticide residues. Product substitution is limited due to the specialized nature of the tests, with a focus on accuracy and regulatory compliance. End-user demographics primarily comprise feed manufacturers, agricultural producers, and regulatory bodies.

Feed Testing Market Growth

Feed Testing Market Market Dynamics & Trends

The Feed Testing market is experiencing robust growth, driven by increasing consumer awareness of food safety and quality, coupled with stricter regulatory compliance requirements globally. Technological advancements, including advancements in PCR, ELISA, and LC-MS/MS techniques are enhancing testing speed, accuracy, and efficiency. The market penetration of advanced testing technologies is progressively increasing, particularly within developed regions. Consumer preferences for sustainably produced, high-quality feed are also driving market expansion. Competitive dynamics are intense, with companies focusing on innovation, service diversification, and global expansion. The market growth is largely attributed to the rising demand for animal protein and the need for ensuring feed safety and quality. The CAGR for the forecast period (2025-2033) is estimated at xx%, highlighting a positive and steady growth trajectory.

Feed Testing Market Growth

Dominant Regions & Segments in Feed Testing Market
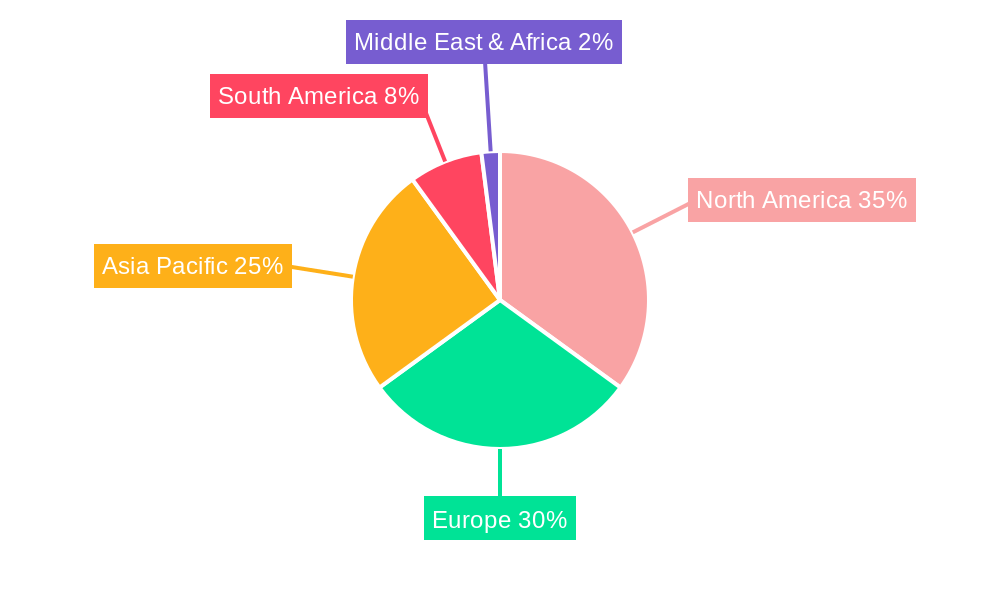
The Feed Testing market is geographically diverse, with [Region Name] currently holding the largest market share. This dominance is attributed to a combination of factors including robust livestock production, stringent regulatory frameworks, and a well-developed infrastructure for testing facilities. Key growth drivers in this region include:

  • Economic Policies: Supportive government policies encouraging livestock farming and food safety standards.
  • Infrastructure: Extensive network of testing laboratories and efficient supply chains.

Within the segment analysis, Pathogen Testing and Pesticide Residue Analysis currently dominate the "By Type" segment, driven by concerns about foodborne illnesses and environmental regulations. In the "By Feed Type" segment, Ruminant Feed and Poultry Feed represent the largest markets due to the substantial volume of these feeds produced globally. Other segments, including Swine Feed, Aquaculture Feed, and Pet Food, are exhibiting considerable growth potential.

Feed Testing Market Product Innovations

Recent product innovations focus on rapid, high-throughput testing methods, portable testing devices, and the development of more sensitive and specific assays. These advancements enhance testing efficiency, reduce costs, and enable on-site testing, significantly benefiting feed producers and regulatory agencies. Technological trends lean towards automation and the integration of artificial intelligence for improved data analysis and faster results. The market fit is strong due to the increasing demand for faster turnaround times and the need for cost-effective solutions.

Report Scope & Segmentation Analysis

This report meticulously segments the Feed Testing market by:

By Type: Pathogen Testing, Pesticide Residue Analysis, Nutritional Labeling Analysis, Fats and Oils Analysis, Mycotoxin Testing, Other Types. Each type exhibits unique growth trajectories and competitive landscapes, influenced by factors such as regulatory pressures and technological advancements.

By Feed Type: Ruminant Feed, Poultry Feed, Swine Feed, Aquaculture Feed, Pet Food. The market size and growth projections for each feed type are analyzed, considering factors like feed consumption patterns and regional variations.

Key Drivers of Feed Testing Market Growth

The Feed Testing market is propelled by several key factors: stringent government regulations ensuring feed safety, the increasing prevalence of foodborne illnesses, rising consumer demand for safe and high-quality food products, and continuous technological innovations leading to improved and more efficient testing methods. These factors create a strong impetus for growth within this sector.

Challenges in the Feed Testing Market Sector

The Feed Testing market faces challenges such as high testing costs, complex regulatory frameworks, and the need for skilled professionals, hindering market penetration in certain regions. Supply chain disruptions, especially concerning reagents and consumables, can affect testing efficiency and cost. Moreover, intense competition among testing laboratories presents an additional hurdle.

Emerging Opportunities in Feed Testing Market

Emerging opportunities lie in developing rapid and point-of-care testing devices, expanding testing services to emerging markets, and focusing on the analysis of emerging contaminants and antibiotic residues in feed. The integration of advanced technologies such as artificial intelligence and big data analytics also presents promising avenues for growth.

Leading Players in the Feed Testing Market Market

  • SGS SA
  • R J Hill Laboratories Ltd
  • NSF International
  • Intertek Group PLC
  • Adpen Laboratories Inc
  • Bruker Biosciences Corporation
  • Genetic ID NA Inc
  • Genon Laboratories Ltd
  • Eurofins Scientific
  • Invisible Sentinel Inc

Key Developments in Feed Testing Market Industry

  • 2022-Q4: Eurofins Scientific launched a new rapid mycotoxin testing kit.
  • 2023-Q1: SGS SA acquired a smaller feed testing laboratory in [Region].
  • 2023-Q2: NSF International announced a new partnership to expand its testing capabilities in [Region]. (Further developments will be detailed in the full report)

Future Outlook for Feed Testing Market Market

The Feed Testing market is poised for significant growth in the coming years, driven by continuous technological advancements, stringent regulations, and a heightened focus on food safety and quality. Strategic partnerships, acquisitions, and the expansion into new markets will further shape the industry's landscape, presenting substantial opportunities for established and emerging players.

Feed Testing Market Segmentation

  • 1. Production Analysis
  • 2. Consumption Analysis
  • 3. Import Market Analysis (Value & Volume)
  • 4. Export Market Analysis (Value & Volume)
  • 5. Price Trend Analysis

Feed Testing Market Segmentation By Geography

  • 1. North America
    • 1.1. United States
    • 1.2. Canada
    • 1.3. Mexico
  • 2. South America
    • 2.1. Brazil
    • 2.2. Argentina
    • 2.3. Rest of South America
  • 3. Europe
    • 3.1. United Kingdom
    • 3.2. Germany
    • 3.3. France
    • 3.4. Italy
    • 3.5. Spain
    • 3.6. Russia
    • 3.7. Benelux
    • 3.8. Nordics
    • 3.9. Rest of Europe
  • 4. Middle East & Africa
    • 4.1. Turkey
    • 4.2. Israel
    • 4.3. GCC
    • 4.4. North Africa
    • 4.5. South Africa
    • 4.6. Rest of Middle East & Africa
  • 5. Asia Pacific
    • 5.1. China
    • 5.2. India
    • 5.3. Japan
    • 5.4. South Korea
    • 5.5. ASEAN
    • 5.6. Oceania
    • 5.7. Rest of Asia Pacific
Feed Testing Market Regional Share


Feed Testing Market REPORT HIGHLIGHTS

AspectsDetails
Study Period 2019-2033
Base Year 2024
Estimated Year 2025
Forecast Period2025-2033
Historical Period2019-2024
Growth RateCAGR of 9.80% from 2019-2033
Segmentation
    • By Production Analysis
    • By Consumption Analysis
    • By Import Market Analysis (Value & Volume)
    • By Export Market Analysis (Value & Volume)
    • By Price Trend Analysis
  • By Geography
    • North America
      • United States
      • Canada
      • Mexico
    • South America
      • Brazil
      • Argentina
      • Rest of South America
    • Europe
      • United Kingdom
      • Germany
      • France
      • Italy
      • Spain
      • Russia
      • Benelux
      • Nordics
      • Rest of Europe
    • Middle East & Africa
      • Turkey
      • Israel
      • GCC
      • North Africa
      • South Africa
      • Rest of Middle East & Africa
    • Asia Pacific
      • China
      • India
      • Japan
      • South Korea
      • ASEAN
      • Oceania
      • Rest of Asia Pacific


Table of Contents

  1. 1. Introduction
    • 1.1. Research Scope
    • 1.2. Market Segmentation
    • 1.3. Research Methodology
    • 1.4. Definitions and Assumptions
  2. 2. Executive Summary
    • 2.1. Introduction
  3. 3. Market Dynamics
    • 3.1. Introduction
      • 3.2. Market Drivers
        • 3.2.1. Decreasing Per Capita Arable Land; Increased Demand for Food
      • 3.3. Market Restrains
        • 3.3.1. High Initial Investments; Requirement of Precision Agriculture
      • 3.4. Market Trends
        • 3.4.1. Increasing Government Regulations Driving Growth of Pet Food Testing Market
  4. 4. Market Factor Analysis
    • 4.1. Porters Five Forces
    • 4.2. Supply/Value Chain
    • 4.3. PESTEL analysis
    • 4.4. Market Entropy
    • 4.5. Patent/Trademark Analysis
  5. 5. Global Feed Testing Market Analysis, Insights and Forecast, 2019-2031
    • 5.1. Market Analysis, Insights and Forecast - by Production Analysis
      • 5.2. Market Analysis, Insights and Forecast - by Consumption Analysis
        • 5.3. Market Analysis, Insights and Forecast - by Import Market Analysis (Value & Volume)
          • 5.4. Market Analysis, Insights and Forecast - by Export Market Analysis (Value & Volume)
            • 5.5. Market Analysis, Insights and Forecast - by Price Trend Analysis
              • 5.6. Market Analysis, Insights and Forecast - by Region
                • 5.6.1. North America
                • 5.6.2. South America
                • 5.6.3. Europe
                • 5.6.4. Middle East & Africa
                • 5.6.5. Asia Pacific
            • 6. North America Feed Testing Market Analysis, Insights and Forecast, 2019-2031
              • 6.1. Market Analysis, Insights and Forecast - by Production Analysis
                • 6.2. Market Analysis, Insights and Forecast - by Consumption Analysis
                  • 6.3. Market Analysis, Insights and Forecast - by Import Market Analysis (Value & Volume)
                    • 6.4. Market Analysis, Insights and Forecast - by Export Market Analysis (Value & Volume)
                      • 6.5. Market Analysis, Insights and Forecast - by Price Trend Analysis
                      • 7. South America Feed Testing Market Analysis, Insights and Forecast, 2019-2031
                        • 7.1. Market Analysis, Insights and Forecast - by Production Analysis
                          • 7.2. Market Analysis, Insights and Forecast - by Consumption Analysis
                            • 7.3. Market Analysis, Insights and Forecast - by Import Market Analysis (Value & Volume)
                              • 7.4. Market Analysis, Insights and Forecast - by Export Market Analysis (Value & Volume)
                                • 7.5. Market Analysis, Insights and Forecast - by Price Trend Analysis
                                • 8. Europe Feed Testing Market Analysis, Insights and Forecast, 2019-2031
                                  • 8.1. Market Analysis, Insights and Forecast - by Production Analysis
                                    • 8.2. Market Analysis, Insights and Forecast - by Consumption Analysis
                                      • 8.3. Market Analysis, Insights and Forecast - by Import Market Analysis (Value & Volume)
                                        • 8.4. Market Analysis, Insights and Forecast - by Export Market Analysis (Value & Volume)
                                          • 8.5. Market Analysis, Insights and Forecast - by Price Trend Analysis
                                          • 9. Middle East & Africa Feed Testing Market Analysis, Insights and Forecast, 2019-2031
                                            • 9.1. Market Analysis, Insights and Forecast - by Production Analysis
                                              • 9.2. Market Analysis, Insights and Forecast - by Consumption Analysis
                                                • 9.3. Market Analysis, Insights and Forecast - by Import Market Analysis (Value & Volume)
                                                  • 9.4. Market Analysis, Insights and Forecast - by Export Market Analysis (Value & Volume)
                                                    • 9.5. Market Analysis, Insights and Forecast - by Price Trend Analysis
                                                    • 10. Asia Pacific Feed Testing Market Analysis, Insights and Forecast, 2019-2031
                                                      • 10.1. Market Analysis, Insights and Forecast - by Production Analysis
                                                        • 10.2. Market Analysis, Insights and Forecast - by Consumption Analysis
                                                          • 10.3. Market Analysis, Insights and Forecast - by Import Market Analysis (Value & Volume)
                                                            • 10.4. Market Analysis, Insights and Forecast - by Export Market Analysis (Value & Volume)
                                                              • 10.5. Market Analysis, Insights and Forecast - by Price Trend Analysis
                                                              • 11. North America Feed Testing Market Analysis, Insights and Forecast, 2019-2031
                                                                  • 11.1. Market Analysis, Insights and Forecast - By Country/Sub-region
                                                                    • 11.1.1 United States
                                                                    • 11.1.2 Canada
                                                                    • 11.1.3 Mexico
                                                                    • 11.1.4 Rest of North America
                                                              • 12. Europe Feed Testing Market Analysis, Insights and Forecast, 2019-2031
                                                                  • 12.1. Market Analysis, Insights and Forecast - By Country/Sub-region
                                                                    • 12.1.1 Germany
                                                                    • 12.1.2 United Kingdom
                                                                    • 12.1.3 France
                                                                    • 12.1.4 Spain
                                                                    • 12.1.5 Russia
                                                                    • 12.1.6 Italy
                                                                    • 12.1.7 Rest of Europe
                                                              • 13. Asia Pacific Feed Testing Market Analysis, Insights and Forecast, 2019-2031
                                                                  • 13.1. Market Analysis, Insights and Forecast - By Country/Sub-region
                                                                    • 13.1.1 China
                                                                    • 13.1.2 India
                                                                    • 13.1.3 Japan
                                                                    • 13.1.4 Australia
                                                                    • 13.1.5 Rest of Asia Pacific
                                                              • 14. South America Feed Testing Market Analysis, Insights and Forecast, 2019-2031
                                                                  • 14.1. Market Analysis, Insights and Forecast - By Country/Sub-region
                                                                    • 14.1.1 Brazil
                                                                    • 14.1.2 Argentina
                                                                    • 14.1.3 Rest of South America
                                                              • 15. Middle East Feed Testing Market Analysis, Insights and Forecast, 2019-2031
                                                                  • 15.1. Market Analysis, Insights and Forecast - By Country/Sub-region
                                                                    • 15.1.1.
                                                              • 16. Saudi Arabia Feed Testing Market Analysis, Insights and Forecast, 2019-2031
                                                                  • 16.1. Market Analysis, Insights and Forecast - By Country/Sub-region
                                                                    • 16.1.1 South Africa
                                                                    • 16.1.2 Rest of Middle East
                                                              • 17. Competitive Analysis
                                                                • 17.1. Global Market Share Analysis 2024
                                                                  • 17.2. Company Profiles
                                                                    • 17.2.1 SGS SA
                                                                      • 17.2.1.1. Overview
                                                                      • 17.2.1.2. Products
                                                                      • 17.2.1.3. SWOT Analysis
                                                                      • 17.2.1.4. Recent Developments
                                                                      • 17.2.1.5. Financials (Based on Availability)
                                                                    • 17.2.2 R J Hill Laboratories Ltd
                                                                      • 17.2.2.1. Overview
                                                                      • 17.2.2.2. Products
                                                                      • 17.2.2.3. SWOT Analysis
                                                                      • 17.2.2.4. Recent Developments
                                                                      • 17.2.2.5. Financials (Based on Availability)
                                                                    • 17.2.3 NSF International*List Not Exhaustive
                                                                      • 17.2.3.1. Overview
                                                                      • 17.2.3.2. Products
                                                                      • 17.2.3.3. SWOT Analysis
                                                                      • 17.2.3.4. Recent Developments
                                                                      • 17.2.3.5. Financials (Based on Availability)
                                                                    • 17.2.4 Intertek Group PLC
                                                                      • 17.2.4.1. Overview
                                                                      • 17.2.4.2. Products
                                                                      • 17.2.4.3. SWOT Analysis
                                                                      • 17.2.4.4. Recent Developments
                                                                      • 17.2.4.5. Financials (Based on Availability)
                                                                    • 17.2.5 Adpen Laboratories Inc
                                                                      • 17.2.5.1. Overview
                                                                      • 17.2.5.2. Products
                                                                      • 17.2.5.3. SWOT Analysis
                                                                      • 17.2.5.4. Recent Developments
                                                                      • 17.2.5.5. Financials (Based on Availability)
                                                                    • 17.2.6 Bruker Biosciences Corporation
                                                                      • 17.2.6.1. Overview
                                                                      • 17.2.6.2. Products
                                                                      • 17.2.6.3. SWOT Analysis
                                                                      • 17.2.6.4. Recent Developments
                                                                      • 17.2.6.5. Financials (Based on Availability)
                                                                    • 17.2.7 Genetic ID NA Inc
                                                                      • 17.2.7.1. Overview
                                                                      • 17.2.7.2. Products
                                                                      • 17.2.7.3. SWOT Analysis
                                                                      • 17.2.7.4. Recent Developments
                                                                      • 17.2.7.5. Financials (Based on Availability)
                                                                    • 17.2.8 Genon Laboratories Ltd
                                                                      • 17.2.8.1. Overview
                                                                      • 17.2.8.2. Products
                                                                      • 17.2.8.3. SWOT Analysis
                                                                      • 17.2.8.4. Recent Developments
                                                                      • 17.2.8.5. Financials (Based on Availability)
                                                                    • 17.2.9 Eurofins Scientific
                                                                      • 17.2.9.1. Overview
                                                                      • 17.2.9.2. Products
                                                                      • 17.2.9.3. SWOT Analysis
                                                                      • 17.2.9.4. Recent Developments
                                                                      • 17.2.9.5. Financials (Based on Availability)
                                                                    • 17.2.10 Invisible Sentinel Inc
                                                                      • 17.2.10.1. Overview
                                                                      • 17.2.10.2. Products
                                                                      • 17.2.10.3. SWOT Analysis
                                                                      • 17.2.10.4. Recent Developments
                                                                      • 17.2.10.5. Financials (Based on Availability)

                                                              List of Figures

                                                              1. Figure 1: Global Feed Testing Market Revenue Breakdown (Million, %) by Region 2024 & 2032
                                                              2. Figure 2: Global Feed Testing Market Volume Breakdown (Kiloton, %) by Region 2024 & 2032
                                                              3. Figure 3: North America Feed Testing Market Revenue (Million), by Country 2024 & 2032
                                                              4. Figure 4: North America Feed Testing Market Volume (Kiloton), by Country 2024 & 2032
                                                              5. Figure 5: North America Feed Testing Market Revenue Share (%), by Country 2024 & 2032
                                                              6. Figure 6: North America Feed Testing Market Volume Share (%), by Country 2024 & 2032
                                                              7. Figure 7: Europe Feed Testing Market Revenue (Million), by Country 2024 & 2032
                                                              8. Figure 8: Europe Feed Testing Market Volume (Kiloton), by Country 2024 & 2032
                                                              9. Figure 9: Europe Feed Testing Market Revenue Share (%), by Country 2024 & 2032
                                                              10. Figure 10: Europe Feed Testing Market Volume Share (%), by Country 2024 & 2032
                                                              11. Figure 11: Asia Pacific Feed Testing Market Revenue (Million), by Country 2024 & 2032
                                                              12. Figure 12: Asia Pacific Feed Testing Market Volume (Kiloton), by Country 2024 & 2032
                                                              13. Figure 13: Asia Pacific Feed Testing Market Revenue Share (%), by Country 2024 & 2032
                                                              14. Figure 14: Asia Pacific Feed Testing Market Volume Share (%), by Country 2024 & 2032
                                                              15. Figure 15: South America Feed Testing Market Revenue (Million), by Country 2024 & 2032
                                                              16. Figure 16: South America Feed Testing Market Volume (Kiloton), by Country 2024 & 2032
                                                              17. Figure 17: South America Feed Testing Market Revenue Share (%), by Country 2024 & 2032
                                                              18. Figure 18: South America Feed Testing Market Volume Share (%), by Country 2024 & 2032
                                                              19. Figure 19: Middle East Feed Testing Market Revenue (Million), by Country 2024 & 2032
                                                              20. Figure 20: Middle East Feed Testing Market Volume (Kiloton), by Country 2024 & 2032
                                                              21. Figure 21: Middle East Feed Testing Market Revenue Share (%), by Country 2024 & 2032
                                                              22. Figure 22: Middle East Feed Testing Market Volume Share (%), by Country 2024 & 2032
                                                              23. Figure 23: Saudi Arabia Feed Testing Market Revenue (Million), by Country 2024 & 2032
                                                              24. Figure 24: Saudi Arabia Feed Testing Market Volume (Kiloton), by Country 2024 & 2032
                                                              25. Figure 25: Saudi Arabia Feed Testing Market Revenue Share (%), by Country 2024 & 2032
                                                              26. Figure 26: Saudi Arabia Feed Testing Market Volume Share (%), by Country 2024 & 2032
                                                              27. Figure 27: North America Feed Testing Market Revenue (Million), by Production Analysis 2024 & 2032
                                                              28. Figure 28: North America Feed Testing Market Volume (Kiloton), by Production Analysis 2024 & 2032
                                                              29. Figure 29: North America Feed Testing Market Revenue Share (%), by Production Analysis 2024 & 2032
                                                              30. Figure 30: North America Feed Testing Market Volume Share (%), by Production Analysis 2024 & 2032
                                                              31. Figure 31: North America Feed Testing Market Revenue (Million), by Consumption Analysis 2024 & 2032
                                                              32. Figure 32: North America Feed Testing Market Volume (Kiloton), by Consumption Analysis 2024 & 2032
                                                              33. Figure 33: North America Feed Testing Market Revenue Share (%), by Consumption Analysis 2024 & 2032
                                                              34. Figure 34: North America Feed Testing Market Volume Share (%), by Consumption Analysis 2024 & 2032
                                                              35. Figure 35: North America Feed Testing Market Revenue (Million), by Import Market Analysis (Value & Volume) 2024 & 2032
                                                              36. Figure 36: North America Feed Testing Market Volume (Kiloton), by Import Market Analysis (Value & Volume) 2024 & 2032
                                                              37. Figure 37: North America Feed Testing Market Revenue Share (%), by Import Market Analysis (Value & Volume) 2024 & 2032
                                                              38. Figure 38: North America Feed Testing Market Volume Share (%), by Import Market Analysis (Value & Volume) 2024 & 2032
                                                              39. Figure 39: North America Feed Testing Market Revenue (Million), by Export Market Analysis (Value & Volume) 2024 & 2032
                                                              40. Figure 40: North America Feed Testing Market Volume (Kiloton), by Export Market Analysis (Value & Volume) 2024 & 2032
                                                              41. Figure 41: North America Feed Testing Market Revenue Share (%), by Export Market Analysis (Value & Volume) 2024 & 2032
                                                              42. Figure 42: North America Feed Testing Market Volume Share (%), by Export Market Analysis (Value & Volume) 2024 & 2032
                                                              43. Figure 43: North America Feed Testing Market Revenue (Million), by Price Trend Analysis 2024 & 2032
                                                              44. Figure 44: North America Feed Testing Market Volume (Kiloton), by Price Trend Analysis 2024 & 2032
                                                              45. Figure 45: North America Feed Testing Market Revenue Share (%), by Price Trend Analysis 2024 & 2032
                                                              46. Figure 46: North America Feed Testing Market Volume Share (%), by Price Trend Analysis 2024 & 2032
                                                              47. Figure 47: North America Feed Testing Market Revenue (Million), by Country 2024 & 2032
                                                              48. Figure 48: North America Feed Testing Market Volume (Kiloton), by Country 2024 & 2032
                                                              49. Figure 49: North America Feed Testing Market Revenue Share (%), by Country 2024 & 2032
                                                              50. Figure 50: North America Feed Testing Market Volume Share (%), by Country 2024 & 2032
                                                              51. Figure 51: South America Feed Testing Market Revenue (Million), by Production Analysis 2024 & 2032
                                                              52. Figure 52: South America Feed Testing Market Volume (Kiloton), by Production Analysis 2024 & 2032
                                                              53. Figure 53: South America Feed Testing Market Revenue Share (%), by Production Analysis 2024 & 2032
                                                              54. Figure 54: South America Feed Testing Market Volume Share (%), by Production Analysis 2024 & 2032
                                                              55. Figure 55: South America Feed Testing Market Revenue (Million), by Consumption Analysis 2024 & 2032
                                                              56. Figure 56: South America Feed Testing Market Volume (Kiloton), by Consumption Analysis 2024 & 2032
                                                              57. Figure 57: South America Feed Testing Market Revenue Share (%), by Consumption Analysis 2024 & 2032
                                                              58. Figure 58: South America Feed Testing Market Volume Share (%), by Consumption Analysis 2024 & 2032
                                                              59. Figure 59: South America Feed Testing Market Revenue (Million), by Import Market Analysis (Value & Volume) 2024 & 2032
                                                              60. Figure 60: South America Feed Testing Market Volume (Kiloton), by Import Market Analysis (Value & Volume) 2024 & 2032
                                                              61. Figure 61: South America Feed Testing Market Revenue Share (%), by Import Market Analysis (Value & Volume) 2024 & 2032
                                                              62. Figure 62: South America Feed Testing Market Volume Share (%), by Import Market Analysis (Value & Volume) 2024 & 2032
                                                              63. Figure 63: South America Feed Testing Market Revenue (Million), by Export Market Analysis (Value & Volume) 2024 & 2032
                                                              64. Figure 64: South America Feed Testing Market Volume (Kiloton), by Export Market Analysis (Value & Volume) 2024 & 2032
                                                              65. Figure 65: South America Feed Testing Market Revenue Share (%), by Export Market Analysis (Value & Volume) 2024 & 2032
                                                              66. Figure 66: South America Feed Testing Market Volume Share (%), by Export Market Analysis (Value & Volume) 2024 & 2032
                                                              67. Figure 67: South America Feed Testing Market Revenue (Million), by Price Trend Analysis 2024 & 2032
                                                              68. Figure 68: South America Feed Testing Market Volume (Kiloton), by Price Trend Analysis 2024 & 2032
                                                              69. Figure 69: South America Feed Testing Market Revenue Share (%), by Price Trend Analysis 2024 & 2032
                                                              70. Figure 70: South America Feed Testing Market Volume Share (%), by Price Trend Analysis 2024 & 2032
                                                              71. Figure 71: South America Feed Testing Market Revenue (Million), by Country 2024 & 2032
                                                              72. Figure 72: South America Feed Testing Market Volume (Kiloton), by Country 2024 & 2032
                                                              73. Figure 73: South America Feed Testing Market Revenue Share (%), by Country 2024 & 2032
                                                              74. Figure 74: South America Feed Testing Market Volume Share (%), by Country 2024 & 2032
                                                              75. Figure 75: Europe Feed Testing Market Revenue (Million), by Production Analysis 2024 & 2032
                                                              76. Figure 76: Europe Feed Testing Market Volume (Kiloton), by Production Analysis 2024 & 2032
                                                              77. Figure 77: Europe Feed Testing Market Revenue Share (%), by Production Analysis 2024 & 2032
                                                              78. Figure 78: Europe Feed Testing Market Volume Share (%), by Production Analysis 2024 & 2032
                                                              79. Figure 79: Europe Feed Testing Market Revenue (Million), by Consumption Analysis 2024 & 2032
                                                              80. Figure 80: Europe Feed Testing Market Volume (Kiloton), by Consumption Analysis 2024 & 2032
                                                              81. Figure 81: Europe Feed Testing Market Revenue Share (%), by Consumption Analysis 2024 & 2032
                                                              82. Figure 82: Europe Feed Testing Market Volume Share (%), by Consumption Analysis 2024 & 2032
                                                              83. Figure 83: Europe Feed Testing Market Revenue (Million), by Import Market Analysis (Value & Volume) 2024 & 2032
                                                              84. Figure 84: Europe Feed Testing Market Volume (Kiloton), by Import Market Analysis (Value & Volume) 2024 & 2032
                                                              85. Figure 85: Europe Feed Testing Market Revenue Share (%), by Import Market Analysis (Value & Volume) 2024 & 2032
                                                              86. Figure 86: Europe Feed Testing Market Volume Share (%), by Import Market Analysis (Value & Volume) 2024 & 2032
                                                              87. Figure 87: Europe Feed Testing Market Revenue (Million), by Export Market Analysis (Value & Volume) 2024 & 2032
                                                              88. Figure 88: Europe Feed Testing Market Volume (Kiloton), by Export Market Analysis (Value & Volume) 2024 & 2032
                                                              89. Figure 89: Europe Feed Testing Market Revenue Share (%), by Export Market Analysis (Value & Volume) 2024 & 2032
                                                              90. Figure 90: Europe Feed Testing Market Volume Share (%), by Export Market Analysis (Value & Volume) 2024 & 2032
                                                              91. Figure 91: Europe Feed Testing Market Revenue (Million), by Price Trend Analysis 2024 & 2032
                                                              92. Figure 92: Europe Feed Testing Market Volume (Kiloton), by Price Trend Analysis 2024 & 2032
                                                              93. Figure 93: Europe Feed Testing Market Revenue Share (%), by Price Trend Analysis 2024 & 2032
                                                              94. Figure 94: Europe Feed Testing Market Volume Share (%), by Price Trend Analysis 2024 & 2032
                                                              95. Figure 95: Europe Feed Testing Market Revenue (Million), by Country 2024 & 2032
                                                              96. Figure 96: Europe Feed Testing Market Volume (Kiloton), by Country 2024 & 2032
                                                              97. Figure 97: Europe Feed Testing Market Revenue Share (%), by Country 2024 & 2032
                                                              98. Figure 98: Europe Feed Testing Market Volume Share (%), by Country 2024 & 2032
                                                              99. Figure 99: Middle East & Africa Feed Testing Market Revenue (Million), by Production Analysis 2024 & 2032
                                                              100. Figure 100: Middle East & Africa Feed Testing Market Volume (Kiloton), by Production Analysis 2024 & 2032
                                                              101. Figure 101: Middle East & Africa Feed Testing Market Revenue Share (%), by Production Analysis 2024 & 2032
                                                              102. Figure 102: Middle East & Africa Feed Testing Market Volume Share (%), by Production Analysis 2024 & 2032
                                                              103. Figure 103: Middle East & Africa Feed Testing Market Revenue (Million), by Consumption Analysis 2024 & 2032
                                                              104. Figure 104: Middle East & Africa Feed Testing Market Volume (Kiloton), by Consumption Analysis 2024 & 2032
                                                              105. Figure 105: Middle East & Africa Feed Testing Market Revenue Share (%), by Consumption Analysis 2024 & 2032
                                                              106. Figure 106: Middle East & Africa Feed Testing Market Volume Share (%), by Consumption Analysis 2024 & 2032
                                                              107. Figure 107: Middle East & Africa Feed Testing Market Revenue (Million), by Import Market Analysis (Value & Volume) 2024 & 2032
                                                              108. Figure 108: Middle East & Africa Feed Testing Market Volume (Kiloton), by Import Market Analysis (Value & Volume) 2024 & 2032
                                                              109. Figure 109: Middle East & Africa Feed Testing Market Revenue Share (%), by Import Market Analysis (Value & Volume) 2024 & 2032
                                                              110. Figure 110: Middle East & Africa Feed Testing Market Volume Share (%), by Import Market Analysis (Value & Volume) 2024 & 2032
                                                              111. Figure 111: Middle East & Africa Feed Testing Market Revenue (Million), by Export Market Analysis (Value & Volume) 2024 & 2032
                                                              112. Figure 112: Middle East & Africa Feed Testing Market Volume (Kiloton), by Export Market Analysis (Value & Volume) 2024 & 2032
                                                              113. Figure 113: Middle East & Africa Feed Testing Market Revenue Share (%), by Export Market Analysis (Value & Volume) 2024 & 2032
                                                              114. Figure 114: Middle East & Africa Feed Testing Market Volume Share (%), by Export Market Analysis (Value & Volume) 2024 & 2032
                                                              115. Figure 115: Middle East & Africa Feed Testing Market Revenue (Million), by Price Trend Analysis 2024 & 2032
                                                              116. Figure 116: Middle East & Africa Feed Testing Market Volume (Kiloton), by Price Trend Analysis 2024 & 2032
                                                              117. Figure 117: Middle East & Africa Feed Testing Market Revenue Share (%), by Price Trend Analysis 2024 & 2032
                                                              118. Figure 118: Middle East & Africa Feed Testing Market Volume Share (%), by Price Trend Analysis 2024 & 2032
                                                              119. Figure 119: Middle East & Africa Feed Testing Market Revenue (Million), by Country 2024 & 2032
                                                              120. Figure 120: Middle East & Africa Feed Testing Market Volume (Kiloton), by Country 2024 & 2032
                                                              121. Figure 121: Middle East & Africa Feed Testing Market Revenue Share (%), by Country 2024 & 2032
                                                              122. Figure 122: Middle East & Africa Feed Testing Market Volume Share (%), by Country 2024 & 2032
                                                              123. Figure 123: Asia Pacific Feed Testing Market Revenue (Million), by Production Analysis 2024 & 2032
                                                              124. Figure 124: Asia Pacific Feed Testing Market Volume (Kiloton), by Production Analysis 2024 & 2032
                                                              125. Figure 125: Asia Pacific Feed Testing Market Revenue Share (%), by Production Analysis 2024 & 2032
                                                              126. Figure 126: Asia Pacific Feed Testing Market Volume Share (%), by Production Analysis 2024 & 2032
                                                              127. Figure 127: Asia Pacific Feed Testing Market Revenue (Million), by Consumption Analysis 2024 & 2032
                                                              128. Figure 128: Asia Pacific Feed Testing Market Volume (Kiloton), by Consumption Analysis 2024 & 2032
                                                              129. Figure 129: Asia Pacific Feed Testing Market Revenue Share (%), by Consumption Analysis 2024 & 2032
                                                              130. Figure 130: Asia Pacific Feed Testing Market Volume Share (%), by Consumption Analysis 2024 & 2032
                                                              131. Figure 131: Asia Pacific Feed Testing Market Revenue (Million), by Import Market Analysis (Value & Volume) 2024 & 2032
                                                              132. Figure 132: Asia Pacific Feed Testing Market Volume (Kiloton), by Import Market Analysis (Value & Volume) 2024 & 2032
                                                              133. Figure 133: Asia Pacific Feed Testing Market Revenue Share (%), by Import Market Analysis (Value & Volume) 2024 & 2032
                                                              134. Figure 134: Asia Pacific Feed Testing Market Volume Share (%), by Import Market Analysis (Value & Volume) 2024 & 2032
                                                              135. Figure 135: Asia Pacific Feed Testing Market Revenue (Million), by Export Market Analysis (Value & Volume) 2024 & 2032
                                                              136. Figure 136: Asia Pacific Feed Testing Market Volume (Kiloton), by Export Market Analysis (Value & Volume) 2024 & 2032
                                                              137. Figure 137: Asia Pacific Feed Testing Market Revenue Share (%), by Export Market Analysis (Value & Volume) 2024 & 2032
                                                              138. Figure 138: Asia Pacific Feed Testing Market Volume Share (%), by Export Market Analysis (Value & Volume) 2024 & 2032
                                                              139. Figure 139: Asia Pacific Feed Testing Market Revenue (Million), by Price Trend Analysis 2024 & 2032
                                                              140. Figure 140: Asia Pacific Feed Testing Market Volume (Kiloton), by Price Trend Analysis 2024 & 2032
                                                              141. Figure 141: Asia Pacific Feed Testing Market Revenue Share (%), by Price Trend Analysis 2024 & 2032
                                                              142. Figure 142: Asia Pacific Feed Testing Market Volume Share (%), by Price Trend Analysis 2024 & 2032
                                                              143. Figure 143: Asia Pacific Feed Testing Market Revenue (Million), by Country 2024 & 2032
                                                              144. Figure 144: Asia Pacific Feed Testing Market Volume (Kiloton), by Country 2024 & 2032
                                                              145. Figure 145: Asia Pacific Feed Testing Market Revenue Share (%), by Country 2024 & 2032
                                                              146. Figure 146: Asia Pacific Feed Testing Market Volume Share (%), by Country 2024 & 2032

                                                              List of Tables

                                                              1. Table 1: Global Feed Testing Market Revenue Million Forecast, by Region 2019 & 2032
                                                              2. Table 2: Global Feed Testing Market Volume Kiloton Forecast, by Region 2019 & 2032
                                                              3. Table 3: Global Feed Testing Market Revenue Million Forecast, by Production Analysis 2019 & 2032
                                                              4. Table 4: Global Feed Testing Market Volume Kiloton Forecast, by Production Analysis 2019 & 2032
                                                              5. Table 5: Global Feed Testing Market Revenue Million Forecast, by Consumption Analysis 2019 & 2032
                                                              6. Table 6: Global Feed Testing Market Volume Kiloton Forecast, by Consumption Analysis 2019 & 2032
                                                              7. Table 7: Global Feed Testing Market Revenue Million Forecast, by Import Market Analysis (Value & Volume) 2019 & 2032
                                                              8. Table 8: Global Feed Testing Market Volume Kiloton Forecast, by Import Market Analysis (Value & Volume) 2019 & 2032
                                                              9. Table 9: Global Feed Testing Market Revenue Million Forecast, by Export Market Analysis (Value & Volume) 2019 & 2032
                                                              10. Table 10: Global Feed Testing Market Volume Kiloton Forecast, by Export Market Analysis (Value & Volume) 2019 & 2032
                                                              11. Table 11: Global Feed Testing Market Revenue Million Forecast, by Price Trend Analysis 2019 & 2032
                                                              12. Table 12: Global Feed Testing Market Volume Kiloton Forecast, by Price Trend Analysis 2019 & 2032
                                                              13. Table 13: Global Feed Testing Market Revenue Million Forecast, by Region 2019 & 2032
                                                              14. Table 14: Global Feed Testing Market Volume Kiloton Forecast, by Region 2019 & 2032
                                                              15. Table 15: Global Feed Testing Market Revenue Million Forecast, by Country 2019 & 2032
                                                              16. Table 16: Global Feed Testing Market Volume Kiloton Forecast, by Country 2019 & 2032
                                                              17. Table 17: United States Feed Testing Market Revenue (Million) Forecast, by Application 2019 & 2032
                                                              18. Table 18: United States Feed Testing Market Volume (Kiloton) Forecast, by Application 2019 & 2032
                                                              19. Table 19: Canada Feed Testing Market Revenue (Million) Forecast, by Application 2019 & 2032
                                                              20. Table 20: Canada Feed Testing Market Volume (Kiloton) Forecast, by Application 2019 & 2032
                                                              21. Table 21: Mexico Feed Testing Market Revenue (Million) Forecast, by Application 2019 & 2032
                                                              22. Table 22: Mexico Feed Testing Market Volume (Kiloton) Forecast, by Application 2019 & 2032
                                                              23. Table 23: Rest of North America Feed Testing Market Revenue (Million) Forecast, by Application 2019 & 2032
                                                              24. Table 24: Rest of North America Feed Testing Market Volume (Kiloton) Forecast, by Application 2019 & 2032
                                                              25. Table 25: Global Feed Testing Market Revenue Million Forecast, by Country 2019 & 2032
                                                              26. Table 26: Global Feed Testing Market Volume Kiloton Forecast, by Country 2019 & 2032
                                                              27. Table 27: Germany Feed Testing Market Revenue (Million) Forecast, by Application 2019 & 2032
                                                              28. Table 28: Germany Feed Testing Market Volume (Kiloton) Forecast, by Application 2019 & 2032
                                                              29. Table 29: United Kingdom Feed Testing Market Revenue (Million) Forecast, by Application 2019 & 2032
                                                              30. Table 30: United Kingdom Feed Testing Market Volume (Kiloton) Forecast, by Application 2019 & 2032
                                                              31. Table 31: France Feed Testing Market Revenue (Million) Forecast, by Application 2019 & 2032
                                                              32. Table 32: France Feed Testing Market Volume (Kiloton) Forecast, by Application 2019 & 2032
                                                              33. Table 33: Spain Feed Testing Market Revenue (Million) Forecast, by Application 2019 & 2032
                                                              34. Table 34: Spain Feed Testing Market Volume (Kiloton) Forecast, by Application 2019 & 2032
                                                              35. Table 35: Russia Feed Testing Market Revenue (Million) Forecast, by Application 2019 & 2032
                                                              36. Table 36: Russia Feed Testing Market Volume (Kiloton) Forecast, by Application 2019 & 2032
                                                              37. Table 37: Italy Feed Testing Market Revenue (Million) Forecast, by Application 2019 & 2032
                                                              38. Table 38: Italy Feed Testing Market Volume (Kiloton) Forecast, by Application 2019 & 2032
                                                              39. Table 39: Rest of Europe Feed Testing Market Revenue (Million) Forecast, by Application 2019 & 2032
                                                              40. Table 40: Rest of Europe Feed Testing Market Volume (Kiloton) Forecast, by Application 2019 & 2032
                                                              41. Table 41: Global Feed Testing Market Revenue Million Forecast, by Country 2019 & 2032
                                                              42. Table 42: Global Feed Testing Market Volume Kiloton Forecast, by Country 2019 & 2032
                                                              43. Table 43: China Feed Testing Market Revenue (Million) Forecast, by Application 2019 & 2032
                                                              44. Table 44: China Feed Testing Market Volume (Kiloton) Forecast, by Application 2019 & 2032
                                                              45. Table 45: India Feed Testing Market Revenue (Million) Forecast, by Application 2019 & 2032
                                                              46. Table 46: India Feed Testing Market Volume (Kiloton) Forecast, by Application 2019 & 2032
                                                              47. Table 47: Japan Feed Testing Market Revenue (Million) Forecast, by Application 2019 & 2032
                                                              48. Table 48: Japan Feed Testing Market Volume (Kiloton) Forecast, by Application 2019 & 2032
                                                              49. Table 49: Australia Feed Testing Market Revenue (Million) Forecast, by Application 2019 & 2032
                                                              50. Table 50: Australia Feed Testing Market Volume (Kiloton) Forecast, by Application 2019 & 2032
                                                              51. Table 51: Rest of Asia Pacific Feed Testing Market Revenue (Million) Forecast, by Application 2019 & 2032
                                                              52. Table 52: Rest of Asia Pacific Feed Testing Market Volume (Kiloton) Forecast, by Application 2019 & 2032
                                                              53. Table 53: Global Feed Testing Market Revenue Million Forecast, by Country 2019 & 2032
                                                              54. Table 54: Global Feed Testing Market Volume Kiloton Forecast, by Country 2019 & 2032
                                                              55. Table 55: Brazil Feed Testing Market Revenue (Million) Forecast, by Application 2019 & 2032
                                                              56. Table 56: Brazil Feed Testing Market Volume (Kiloton) Forecast, by Application 2019 & 2032
                                                              57. Table 57: Argentina Feed Testing Market Revenue (Million) Forecast, by Application 2019 & 2032
                                                              58. Table 58: Argentina Feed Testing Market Volume (Kiloton) Forecast, by Application 2019 & 2032
                                                              59. Table 59: Rest of South America Feed Testing Market Revenue (Million) Forecast, by Application 2019 & 2032
                                                              60. Table 60: Rest of South America Feed Testing Market Volume (Kiloton) Forecast, by Application 2019 & 2032
                                                              61. Table 61: Global Feed Testing Market Revenue Million Forecast, by Country 2019 & 2032
                                                              62. Table 62: Global Feed Testing Market Volume Kiloton Forecast, by Country 2019 & 2032
                                                              63. Table 63: Feed Testing Market Revenue (Million) Forecast, by Application 2019 & 2032
                                                              64. Table 64: Feed Testing Market Volume (Kiloton) Forecast, by Application 2019 & 2032
                                                              65. Table 65: Global Feed Testing Market Revenue Million Forecast, by Country 2019 & 2032
                                                              66. Table 66: Global Feed Testing Market Volume Kiloton Forecast, by Country 2019 & 2032
                                                              67. Table 67: South Africa Feed Testing Market Revenue (Million) Forecast, by Application 2019 & 2032
                                                              68. Table 68: South Africa Feed Testing Market Volume (Kiloton) Forecast, by Application 2019 & 2032
                                                              69. Table 69: Rest of Middle East Feed Testing Market Revenue (Million) Forecast, by Application 2019 & 2032
                                                              70. Table 70: Rest of Middle East Feed Testing Market Volume (Kiloton) Forecast, by Application 2019 & 2032
                                                              71. Table 71: Global Feed Testing Market Revenue Million Forecast, by Production Analysis 2019 & 2032
                                                              72. Table 72: Global Feed Testing Market Volume Kiloton Forecast, by Production Analysis 2019 & 2032
                                                              73. Table 73: Global Feed Testing Market Revenue Million Forecast, by Consumption Analysis 2019 & 2032
                                                              74. Table 74: Global Feed Testing Market Volume Kiloton Forecast, by Consumption Analysis 2019 & 2032
                                                              75. Table 75: Global Feed Testing Market Revenue Million Forecast, by Import Market Analysis (Value & Volume) 2019 & 2032
                                                              76. Table 76: Global Feed Testing Market Volume Kiloton Forecast, by Import Market Analysis (Value & Volume) 2019 & 2032
                                                              77. Table 77: Global Feed Testing Market Revenue Million Forecast, by Export Market Analysis (Value & Volume) 2019 & 2032
                                                              78. Table 78: Global Feed Testing Market Volume Kiloton Forecast, by Export Market Analysis (Value & Volume) 2019 & 2032
                                                              79. Table 79: Global Feed Testing Market Revenue Million Forecast, by Price Trend Analysis 2019 & 2032
                                                              80. Table 80: Global Feed Testing Market Volume Kiloton Forecast, by Price Trend Analysis 2019 & 2032
                                                              81. Table 81: Global Feed Testing Market Revenue Million Forecast, by Country 2019 & 2032
                                                              82. Table 82: Global Feed Testing Market Volume Kiloton Forecast, by Country 2019 & 2032
                                                              83. Table 83: United States Feed Testing Market Revenue (Million) Forecast, by Application 2019 & 2032
                                                              84. Table 84: United States Feed Testing Market Volume (Kiloton) Forecast, by Application 2019 & 2032
                                                              85. Table 85: Canada Feed Testing Market Revenue (Million) Forecast, by Application 2019 & 2032
                                                              86. Table 86: Canada Feed Testing Market Volume (Kiloton) Forecast, by Application 2019 & 2032
                                                              87. Table 87: Mexico Feed Testing Market Revenue (Million) Forecast, by Application 2019 & 2032
                                                              88. Table 88: Mexico Feed Testing Market Volume (Kiloton) Forecast, by Application 2019 & 2032
                                                              89. Table 89: Global Feed Testing Market Revenue Million Forecast, by Production Analysis 2019 & 2032
                                                              90. Table 90: Global Feed Testing Market Volume Kiloton Forecast, by Production Analysis 2019 & 2032
                                                              91. Table 91: Global Feed Testing Market Revenue Million Forecast, by Consumption Analysis 2019 & 2032
                                                              92. Table 92: Global Feed Testing Market Volume Kiloton Forecast, by Consumption Analysis 2019 & 2032
                                                              93. Table 93: Global Feed Testing Market Revenue Million Forecast, by Import Market Analysis (Value & Volume) 2019 & 2032
                                                              94. Table 94: Global Feed Testing Market Volume Kiloton Forecast, by Import Market Analysis (Value & Volume) 2019 & 2032
                                                              95. Table 95: Global Feed Testing Market Revenue Million Forecast, by Export Market Analysis (Value & Volume) 2019 & 2032
                                                              96. Table 96: Global Feed Testing Market Volume Kiloton Forecast, by Export Market Analysis (Value & Volume) 2019 & 2032
                                                              97. Table 97: Global Feed Testing Market Revenue Million Forecast, by Price Trend Analysis 2019 & 2032
                                                              98. Table 98: Global Feed Testing Market Volume Kiloton Forecast, by Price Trend Analysis 2019 & 2032
                                                              99. Table 99: Global Feed Testing Market Revenue Million Forecast, by Country 2019 & 2032
                                                              100. Table 100: Global Feed Testing Market Volume Kiloton Forecast, by Country 2019 & 2032
                                                              101. Table 101: Brazil Feed Testing Market Revenue (Million) Forecast, by Application 2019 & 2032
                                                              102. Table 102: Brazil Feed Testing Market Volume (Kiloton) Forecast, by Application 2019 & 2032
                                                              103. Table 103: Argentina Feed Testing Market Revenue (Million) Forecast, by Application 2019 & 2032
                                                              104. Table 104: Argentina Feed Testing Market Volume (Kiloton) Forecast, by Application 2019 & 2032
                                                              105. Table 105: Rest of South America Feed Testing Market Revenue (Million) Forecast, by Application 2019 & 2032
                                                              106. Table 106: Rest of South America Feed Testing Market Volume (Kiloton) Forecast, by Application 2019 & 2032
                                                              107. Table 107: Global Feed Testing Market Revenue Million Forecast, by Production Analysis 2019 & 2032
                                                              108. Table 108: Global Feed Testing Market Volume Kiloton Forecast, by Production Analysis 2019 & 2032
                                                              109. Table 109: Global Feed Testing Market Revenue Million Forecast, by Consumption Analysis 2019 & 2032
                                                              110. Table 110: Global Feed Testing Market Volume Kiloton Forecast, by Consumption Analysis 2019 & 2032
                                                              111. Table 111: Global Feed Testing Market Revenue Million Forecast, by Import Market Analysis (Value & Volume) 2019 & 2032
                                                              112. Table 112: Global Feed Testing Market Volume Kiloton Forecast, by Import Market Analysis (Value & Volume) 2019 & 2032
                                                              113. Table 113: Global Feed Testing Market Revenue Million Forecast, by Export Market Analysis (Value & Volume) 2019 & 2032
                                                              114. Table 114: Global Feed Testing Market Volume Kiloton Forecast, by Export Market Analysis (Value & Volume) 2019 & 2032
                                                              115. Table 115: Global Feed Testing Market Revenue Million Forecast, by Price Trend Analysis 2019 & 2032
                                                              116. Table 116: Global Feed Testing Market Volume Kiloton Forecast, by Price Trend Analysis 2019 & 2032
                                                              117. Table 117: Global Feed Testing Market Revenue Million Forecast, by Country 2019 & 2032
                                                              118. Table 118: Global Feed Testing Market Volume Kiloton Forecast, by Country 2019 & 2032
                                                              119. Table 119: United Kingdom Feed Testing Market Revenue (Million) Forecast, by Application 2019 & 2032
                                                              120. Table 120: United Kingdom Feed Testing Market Volume (Kiloton) Forecast, by Application 2019 & 2032
                                                              121. Table 121: Germany Feed Testing Market Revenue (Million) Forecast, by Application 2019 & 2032
                                                              122. Table 122: Germany Feed Testing Market Volume (Kiloton) Forecast, by Application 2019 & 2032
                                                              123. Table 123: France Feed Testing Market Revenue (Million) Forecast, by Application 2019 & 2032
                                                              124. Table 124: France Feed Testing Market Volume (Kiloton) Forecast, by Application 2019 & 2032
                                                              125. Table 125: Italy Feed Testing Market Revenue (Million) Forecast, by Application 2019 & 2032
                                                              126. Table 126: Italy Feed Testing Market Volume (Kiloton) Forecast, by Application 2019 & 2032
                                                              127. Table 127: Spain Feed Testing Market Revenue (Million) Forecast, by Application 2019 & 2032
                                                              128. Table 128: Spain Feed Testing Market Volume (Kiloton) Forecast, by Application 2019 & 2032
                                                              129. Table 129: Russia Feed Testing Market Revenue (Million) Forecast, by Application 2019 & 2032
                                                              130. Table 130: Russia Feed Testing Market Volume (Kiloton) Forecast, by Application 2019 & 2032
                                                              131. Table 131: Benelux Feed Testing Market Revenue (Million) Forecast, by Application 2019 & 2032
                                                              132. Table 132: Benelux Feed Testing Market Volume (Kiloton) Forecast, by Application 2019 & 2032
                                                              133. Table 133: Nordics Feed Testing Market Revenue (Million) Forecast, by Application 2019 & 2032
                                                              134. Table 134: Nordics Feed Testing Market Volume (Kiloton) Forecast, by Application 2019 & 2032
                                                              135. Table 135: Rest of Europe Feed Testing Market Revenue (Million) Forecast, by Application 2019 & 2032
                                                              136. Table 136: Rest of Europe Feed Testing Market Volume (Kiloton) Forecast, by Application 2019 & 2032
                                                              137. Table 137: Global Feed Testing Market Revenue Million Forecast, by Production Analysis 2019 & 2032
                                                              138. Table 138: Global Feed Testing Market Volume Kiloton Forecast, by Production Analysis 2019 & 2032
                                                              139. Table 139: Global Feed Testing Market Revenue Million Forecast, by Consumption Analysis 2019 & 2032
                                                              140. Table 140: Global Feed Testing Market Volume Kiloton Forecast, by Consumption Analysis 2019 & 2032
                                                              141. Table 141: Global Feed Testing Market Revenue Million Forecast, by Import Market Analysis (Value & Volume) 2019 & 2032
                                                              142. Table 142: Global Feed Testing Market Volume Kiloton Forecast, by Import Market Analysis (Value & Volume) 2019 & 2032
                                                              143. Table 143: Global Feed Testing Market Revenue Million Forecast, by Export Market Analysis (Value & Volume) 2019 & 2032
                                                              144. Table 144: Global Feed Testing Market Volume Kiloton Forecast, by Export Market Analysis (Value & Volume) 2019 & 2032
                                                              145. Table 145: Global Feed Testing Market Revenue Million Forecast, by Price Trend Analysis 2019 & 2032
                                                              146. Table 146: Global Feed Testing Market Volume Kiloton Forecast, by Price Trend Analysis 2019 & 2032
                                                              147. Table 147: Global Feed Testing Market Revenue Million Forecast, by Country 2019 & 2032
                                                              148. Table 148: Global Feed Testing Market Volume Kiloton Forecast, by Country 2019 & 2032
                                                              149. Table 149: Turkey Feed Testing Market Revenue (Million) Forecast, by Application 2019 & 2032
                                                              150. Table 150: Turkey Feed Testing Market Volume (Kiloton) Forecast, by Application 2019 & 2032
                                                              151. Table 151: Israel Feed Testing Market Revenue (Million) Forecast, by Application 2019 & 2032
                                                              152. Table 152: Israel Feed Testing Market Volume (Kiloton) Forecast, by Application 2019 & 2032
                                                              153. Table 153: GCC Feed Testing Market Revenue (Million) Forecast, by Application 2019 & 2032
                                                              154. Table 154: GCC Feed Testing Market Volume (Kiloton) Forecast, by Application 2019 & 2032
                                                              155. Table 155: North Africa Feed Testing Market Revenue (Million) Forecast, by Application 2019 & 2032
                                                              156. Table 156: North Africa Feed Testing Market Volume (Kiloton) Forecast, by Application 2019 & 2032
                                                              157. Table 157: South Africa Feed Testing Market Revenue (Million) Forecast, by Application 2019 & 2032
                                                              158. Table 158: South Africa Feed Testing Market Volume (Kiloton) Forecast, by Application 2019 & 2032
                                                              159. Table 159: Rest of Middle East & Africa Feed Testing Market Revenue (Million) Forecast, by Application 2019 & 2032
                                                              160. Table 160: Rest of Middle East & Africa Feed Testing Market Volume (Kiloton) Forecast, by Application 2019 & 2032
                                                              161. Table 161: Global Feed Testing Market Revenue Million Forecast, by Production Analysis 2019 & 2032
                                                              162. Table 162: Global Feed Testing Market Volume Kiloton Forecast, by Production Analysis 2019 & 2032
                                                              163. Table 163: Global Feed Testing Market Revenue Million Forecast, by Consumption Analysis 2019 & 2032
                                                              164. Table 164: Global Feed Testing Market Volume Kiloton Forecast, by Consumption Analysis 2019 & 2032
                                                              165. Table 165: Global Feed Testing Market Revenue Million Forecast, by Import Market Analysis (Value & Volume) 2019 & 2032
                                                              166. Table 166: Global Feed Testing Market Volume Kiloton Forecast, by Import Market Analysis (Value & Volume) 2019 & 2032
                                                              167. Table 167: Global Feed Testing Market Revenue Million Forecast, by Export Market Analysis (Value & Volume) 2019 & 2032
                                                              168. Table 168: Global Feed Testing Market Volume Kiloton Forecast, by Export Market Analysis (Value & Volume) 2019 & 2032
                                                              169. Table 169: Global Feed Testing Market Revenue Million Forecast, by Price Trend Analysis 2019 & 2032
                                                              170. Table 170: Global Feed Testing Market Volume Kiloton Forecast, by Price Trend Analysis 2019 & 2032
                                                              171. Table 171: Global Feed Testing Market Revenue Million Forecast, by Country 2019 & 2032
                                                              172. Table 172: Global Feed Testing Market Volume Kiloton Forecast, by Country 2019 & 2032
                                                              173. Table 173: China Feed Testing Market Revenue (Million) Forecast, by Application 2019 & 2032
                                                              174. Table 174: China Feed Testing Market Volume (Kiloton) Forecast, by Application 2019 & 2032
                                                              175. Table 175: India Feed Testing Market Revenue (Million) Forecast, by Application 2019 & 2032
                                                              176. Table 176: India Feed Testing Market Volume (Kiloton) Forecast, by Application 2019 & 2032
                                                              177. Table 177: Japan Feed Testing Market Revenue (Million) Forecast, by Application 2019 & 2032
                                                              178. Table 178: Japan Feed Testing Market Volume (Kiloton) Forecast, by Application 2019 & 2032
                                                              179. Table 179: South Korea Feed Testing Market Revenue (Million) Forecast, by Application 2019 & 2032
                                                              180. Table 180: South Korea Feed Testing Market Volume (Kiloton) Forecast, by Application 2019 & 2032
                                                              181. Table 181: ASEAN Feed Testing Market Revenue (Million) Forecast, by Application 2019 & 2032
                                                              182. Table 182: ASEAN Feed Testing Market Volume (Kiloton) Forecast, by Application 2019 & 2032
                                                              183. Table 183: Oceania Feed Testing Market Revenue (Million) Forecast, by Application 2019 & 2032
                                                              184. Table 184: Oceania Feed Testing Market Volume (Kiloton) Forecast, by Application 2019 & 2032
                                                              185. Table 185: Rest of Asia Pacific Feed Testing Market Revenue (Million) Forecast, by Application 2019 & 2032
                                                              186. Table 186: Rest of Asia Pacific Feed Testing Market Volume (Kiloton) Forecast, by Application 2019 & 2032


                                                              Frequently Asked Questions

                                                              1. What is the projected Compound Annual Growth Rate (CAGR) of the Feed Testing Market?

                                                              The projected CAGR is approximately 9.80%.

                                                              2. Which companies are prominent players in the Feed Testing Market?

                                                              Key companies in the market include SGS SA, R J Hill Laboratories Ltd, NSF International*List Not Exhaustive, Intertek Group PLC, Adpen Laboratories Inc, Bruker Biosciences Corporation, Genetic ID NA Inc, Genon Laboratories Ltd, Eurofins Scientific, Invisible Sentinel Inc.

                                                              3. What are the main segments of the Feed Testing Market?

                                                              The market segments include Production Analysis, Consumption Analysis, Import Market Analysis (Value & Volume), Export Market Analysis (Value & Volume), Price Trend Analysis.

                                                              4. Can you provide details about the market size?

                                                              The market size is estimated to be USD 2.54 Million as of 2022.

                                                              5. What are some drivers contributing to market growth?

                                                              Decreasing Per Capita Arable Land; Increased Demand for Food.

                                                              6. What are the notable trends driving market growth?

                                                              Increasing Government Regulations Driving Growth of Pet Food Testing Market.

                                                              7. Are there any restraints impacting market growth?

                                                              High Initial Investments; Requirement of Precision Agriculture.

                                                              8. Can you provide examples of recent developments in the market?

                                                              N/A

                                                              9. What pricing options are available for accessing the report?

                                                              Pricing options include single-user, multi-user, and enterprise licenses priced at USD 4750, USD 5250, and USD 8750 respectively.

                                                              10. Is the market size provided in terms of value or volume?

                                                              The market size is provided in terms of value, measured in Million and volume, measured in Kiloton.

                                                              11. Are there any specific market keywords associated with the report?

                                                              Yes, the market keyword associated with the report is "Feed Testing Market," which aids in identifying and referencing the specific market segment covered.

                                                              12. How do I determine which pricing option suits my needs best?

                                                              The pricing options vary based on user requirements and access needs. Individual users may opt for single-user licenses, while businesses requiring broader access may choose multi-user or enterprise licenses for cost-effective access to the report.

                                                              13. Are there any additional resources or data provided in the Feed Testing Market report?

                                                              While the report offers comprehensive insights, it's advisable to review the specific contents or supplementary materials provided to ascertain if additional resources or data are available.

                                                              14. How can I stay updated on further developments or reports in the Feed Testing Market?

                                                              To stay informed about further developments, trends, and reports in the Feed Testing Market, consider subscribing to industry newsletters, following relevant companies and organizations, or regularly checking reputable industry news sources and publications.


                                                              Methodology

                                                              Step 1 - Identification of Relevant Samples Size from Population Database

                                                              Step Chart
                                                              Bar Chart
                                                              Method Chart

                                                              Step 2 - Approaches for Defining Global Market Size (Value, Volume* & Price*)

                                                              Approach Chart
                                                              Top-down and bottom-up approaches are used to validate the global market size and estimate the market size for manufactures, regional segments, product, and application.

                                                              Note*: In applicable scenarios

                                                              Step 3 - Data Sources

                                                              Primary Research

                                                              • Web Analytics
                                                              • Survey Reports
                                                              • Research Institute
                                                              • Latest Research Reports
                                                              • Opinion Leaders

                                                              Secondary Research

                                                              • Annual Reports
                                                              • White Paper
                                                              • Latest Press Release
                                                              • Industry Association
                                                              • Paid Database
                                                              • Investor Presentations
                                                              Analyst Chart

                                                              Step 4 - Data Triangulation

                                                              Involves using different sources of information in order to increase the validity of a study

                                                              These sources are likely to be stakeholders in a program - participants, other researchers, program staff, other community members, and so on.

                                                              Then we put all data in single framework & apply various statistical tools to find out the dynamic on the market.

                                                              During the analysis stage, feedback from the stakeholder groups would be compared to determine areas of agreement as well as areas of divergence

                                                              Additionally, after gathering mixed and scattered data from a wide range of sources, data is triangulated and correlated to come up with estimated figures which are further validated through primary mediums or industry experts, opinion leaders.

                                                              About Report Pinnacle

                                                              Report Pinnacle provides top-tier market research, industry intelligence, and actionable insights for finance, technology, healthcare, and consumer sectors. Our reports empower you to make informed decisions and achieve business success.

                                                              Our expert team combines primary research, data analytics, and industry knowledge to deliver insights you can trust. We offer syndicated reports, custom research, and consulting services tailored to your unique business needs.

                                                              At Report Pinnacle, we are committed to quality, transparency, and client satisfaction. Every report is rigorously validated to ensure accuracy and relevance. Our global perspective and local expertise help you understand both broad trends and detailed market shifts.

                                                              Stay ahead with Report Pinnacle. Subscribe to our newsletter for the latest insights and research highlights, and follow us on social media for real-time updates.

                                                              Report Pinnacle – Your Partner for Reaching the Top in Market Intelligence.

                                                              artwork spiralartwork spiralRelated Reports
                                                              artwork underline

                                                              Navigating Vietnam Specialty Fertilizer Market Market Trends: Competitor Analysis and Growth 2025-2033

                                                              Discover the booming Vietnam specialty fertilizer market! This comprehensive analysis reveals a CAGR of 6.70%, driven by rising demand for high-yield agriculture and sustainable farming practices. Explore market size, key segments (CRF, liquid, SRF, water-soluble), leading companies, and future growth projections until 2033.

                                                              June 2025
                                                              Base Year: 2024
                                                              No Of Pages: 150
                                                              Price: $3800

                                                              Cotton Seed Market Market Expansion Strategies

                                                              Discover the booming cotton seed market! Explore a comprehensive analysis revealing a 5.20% CAGR, key drivers, regional trends (North America, Europe, Asia-Pacific), leading companies (Bayer, Nuseed, UPL), and future growth projections through 2033. Get insights into market size, segmentation, and price trends impacting this vital agricultural sector.

                                                              June 2025
                                                              Base Year: 2024
                                                              No Of Pages: 180
                                                              Price: $4750

                                                              Overcoming Challenges in APAC Agricultural Machinery Market Market: Strategic Insights 2025-2033

                                                              Discover the booming APAC agricultural machinery market! This comprehensive analysis reveals a CAGR of 6.10%, driven by rising food demands and technological advancements. Explore market trends, key players (Iseki, Escorts, Deere), and regional breakdowns (India, China) for tractors, harvesting, and irrigation equipment. Project your strategy with our 2025-2033 forecast.

                                                              June 2025
                                                              Base Year: 2024
                                                              No Of Pages: 150
                                                              Price: $4750

                                                              North America Orange Industry Market Report: Trends and Growth

                                                              Discover the thriving North American orange industry's market trends, with insights into CAGR, key players (Syngenta, Sunkist Growers), and segment analysis (fresh, processed oranges). Explore market size projections, regional distribution, and growth drivers for 2025-2033.

                                                              June 2025
                                                              Base Year: 2024
                                                              No Of Pages: 180
                                                              Price: $4750

                                                              Farm Equipment Market Trends and Forecasts: Comprehensive Insights

                                                              The global farm equipment market is booming, projected to reach [estimated 2033 value based on CAGR] by 2033, driven by technological advancements, population growth, and government initiatives. Learn about key trends, leading companies, and regional variations in this comprehensive market analysis.

                                                              June 2025
                                                              Base Year: 2024
                                                              No Of Pages: 150
                                                              Price: $3800

                                                              Challenges to Overcome in Africa Chia Seeds Industry Market Growth: Analysis 2025-2033

                                                              Discover the booming Africa chia seeds market! This comprehensive analysis reveals a $13.87 million market in 2025, projecting steady growth driven by health-conscious consumers and diverse applications in food, beverages, and supplements. Learn about key players, regional trends (UAE, South Africa), and future market potential.

                                                              June 2025
                                                              Base Year: 2024
                                                              No Of Pages: 180
                                                              Price: $4750

                                                              Europe Organic Fertilizer Market Unlocking Growth Potential: 2025-2033 Analysis and Forecasts

                                                              Discover the booming European organic fertilizer market! This comprehensive analysis reveals key trends, growth drivers, and leading companies shaping the future of sustainable agriculture. Learn about market size, CAGR, and regional insights for 2025-2033.

                                                              June 2025
                                                              Base Year: 2024
                                                              No Of Pages: 180
                                                              Price: $3800

                                                              Navigating Organic Banana Market Market Trends: Competitor Analysis and Growth 2025-2033

                                                              Discover the booming organic banana market! Explore its $1.61 billion valuation, 11.04% CAGR, key drivers, regional trends (North America, Europe, Asia-Pacific), and leading companies like Dole & Chiquita. Learn about market segmentation and future growth projections in our comprehensive analysis.

                                                              June 2025
                                                              Base Year: 2024
                                                              No Of Pages: 234
                                                              Price: $4750

                                                              Strategizing Growth: Feed Testing Market Market’s Decade Ahead 2025-2033

                                                              The global feed testing market is booming, reaching $2.54B in 2025 and projected to grow at a CAGR of 9.80% until 2033. Driven by food safety regulations and consumer demand, this market encompasses pathogen testing, pesticide residue analysis, and more. Discover key trends, segments, and leading companies shaping this dynamic industry.

                                                              June 2025
                                                              Base Year: 2024
                                                              No Of Pages: 180
                                                              Price: $4750

                                                              US Insecticide Market Drivers of Growth: Opportunities to 2033

                                                              Discover the booming US Insecticide Market! Our comprehensive analysis reveals a $5.5B market in 2025, projected for strong growth driven by crop protection and disease prevention. Explore market trends, segmentation (by application & crop type), key players, and regional insights to 2033.

                                                              June 2025
                                                              Base Year: 2024
                                                              No Of Pages: 180
                                                              Price: $3800

                                                              Soil Treatments Market CAGR Trends: Growth Outlook 2025-2033

                                                              The global soil treatments market is booming, projected to reach $XX million by 2033 with a CAGR of 6.30%. Discover key market trends, leading companies (FMC, Bayer, Syngenta), and regional insights for fungicides, herbicides, and more. Learn how sustainable agriculture and food security are driving this growth.

                                                              June 2025
                                                              Base Year: 2024
                                                              No Of Pages: 150
                                                              Price: $3800

                                                              Exploring Growth Avenues in Asia-Pacific Biofertilizer Market Market

                                                              Discover the booming Asia-Pacific biofertilizer market! This comprehensive analysis reveals a 15% CAGR, driven by sustainable farming trends and high crop yield demands. Explore market size, key players (Gujarat State Fertilizers, Suståne, etc.), and regional growth projections (China, India, Indonesia) through 2033. Learn how biofertilizers like Azospirillum and Rhizobium are transforming agriculture.

                                                              June 2025
                                                              Base Year: 2024
                                                              No Of Pages: 150
                                                              Price: $3800

                                                              Consumer-Centric Trends in Fruits and Vegetables in Cameroon Market Industry

                                                              Discover the booming Cameroonian fruits and vegetables market! This comprehensive analysis reveals a $2.48 billion market in 2025, expanding at a 6.42% CAGR. Explore market drivers, trends, restraints, key players (Seed Co, Bayer, Pioneer, Syngenta), and regional breakdowns for informed investment decisions. Get the data-driven insights you need!

                                                              June 2025
                                                              Base Year: 2024
                                                              No Of Pages: 150
                                                              Price: $3800

                                                              Germany Seed Treatment Market Market Size and Trends 2025-2033: Comprehensive Outlook

                                                              Discover the booming Germany seed treatment market! This comprehensive analysis reveals a €424.10 million market in 2025, projected to grow at a 4.70% CAGR until 2033. Learn about key drivers, trends, restraints, and leading companies shaping this vital sector. Explore regional insights and future growth projections.

                                                              June 2025
                                                              Base Year: 2024
                                                              No Of Pages: 150
                                                              Price: $3800

                                                              Rapeseeds Market Insightful Analysis: Trends, Competitor Dynamics, and Opportunities 2025-2033

                                                              Discover the booming rapeseed market projected to reach $2.85 billion by 2033, fueled by biofuel demand and healthy eating trends. Explore market segments, key players (Bayer, Corteva, BASF), and regional insights. Learn more about CAGR, drivers, and restraints.

                                                              June 2025
                                                              Base Year: 2024
                                                              No Of Pages: 234
                                                              Price: $4750

                                                              Unveiling Brazil Agriculture Industry Growth Patterns: CAGR Analysis and Forecasts 2025-2033

                                                              Discover the booming Brazilian agriculture industry, projected to reach $174.44 billion by 2033 with a 3.80% CAGR. This in-depth analysis explores market drivers, trends, restraints, and segment performance (vegetables, food crops/cereals, fruits), offering valuable insights for investors and stakeholders.

                                                              June 2025
                                                              Base Year: 2024
                                                              No Of Pages: 197
                                                              Price: $3800

                                                              Round Wood Market’s Role in Shaping Industry Trends 2025-2033

                                                              Discover the latest trends and insights into the booming round wood market, projected to reach $350 billion by 2033. This comprehensive analysis covers market size, CAGR, regional breakdowns (North America, Europe, Asia-Pacific), key players (Weyerhaeuser, International Paper), and growth drivers. Learn about opportunities and challenges in softwood, hardwood, and pulpwood segments across construction, furniture, and energy applications.

                                                              June 2025
                                                              Base Year: 2024
                                                              No Of Pages: 234
                                                              Price: $4750

                                                              Market Deep Dive: Exploring China Specialty Fertilizer Market Trends 2025-2033

                                                              Discover the booming China specialty fertilizer market! This in-depth analysis reveals a CAGR of 6.70% (2025-2033), driven by rising demand for higher crop yields and sustainable agriculture. Explore market segments, key players (Yara, Haifa, etc.), and regional trends. Learn how CRF, water-soluble, and liquid fertilizers are shaping the future of Chinese agriculture.

                                                              June 2025
                                                              Base Year: 2024
                                                              No Of Pages: 150
                                                              Price: $3800

                                                              Precision Farming Software Industry Market Overview: Growth and Insights

                                                              Boost your farm's efficiency and profitability with precision farming software. Discover market trends, growth projections (CAGR 14%), leading companies, and regional insights in this comprehensive analysis of the precision agriculture software market, projected to reach [estimated final market size] by 2033. Explore key applications like crop management, financial management, and weather forecasting.

                                                              June 2025
                                                              Base Year: 2024
                                                              No Of Pages: 234
                                                              Price: $4750

                                                              Qatar Agriculture Market Market Trends and Strategic Roadmap

                                                              Discover the booming Qatar agriculture market! This in-depth analysis reveals a $170.95 million market with a 5.47% CAGR (2025-2033), driven by food security initiatives and rising demand. Explore key players, trends, and segment-wise growth projections for fresh produce, dairy, poultry, and fish.

                                                              June 2025
                                                              Base Year: 2024
                                                              No Of Pages: 150
                                                              Price: $3800
                                                              • Home
                                                              • About Us
                                                              • Industries
                                                                • Aerospace & Defense
                                                                • Agriculture
                                                                • Animal Nutrition & Wellness
                                                                • Automotive
                                                                • Chemicals & Materials
                                                                • Consumer Goods and Services
                                                                • Energy & Power
                                                                • Financial Services and Investment Intelligence
                                                                • Food & Beverage
                                                                • Home and Property Improvement
                                                                • Hospitality and Tourism
                                                                • Logistics
                                                                • Manufacturing Products and Services
                                                                • Packaging
                                                                • Professional and Commercial Services
                                                                • Real Estate and Construction
                                                                • Retail
                                                                • Technology, Media and Telecom
                                                                • Healthcare
                                                              • Services
                                                              • Contact
                                                              Main Logo
                                                              • Home
                                                              • About Us
                                                              • Industries
                                                                • Aerospace & Defense
                                                                • Agriculture
                                                                • Animal Nutrition & Wellness
                                                                • Automotive
                                                                • Chemicals & Materials
                                                                • Consumer Goods and Services
                                                                • Energy & Power
                                                                • Financial Services and Investment Intelligence
                                                                • Food & Beverage
                                                                • Home and Property Improvement
                                                                • Hospitality and Tourism
                                                                • Logistics
                                                                • Manufacturing Products and Services
                                                                • Packaging
                                                                • Professional and Commercial Services
                                                                • Real Estate and Construction
                                                                • Retail
                                                                • Technology, Media and Telecom
                                                                • Healthcare
                                                              • Services
                                                              • Contact
                                                              +17162654855
                                                              [email protected]

                                                              +17162654855

                                                              [email protected]

                                                              Business Address

                                                              Head Office

                                                              Office no. A 5010, fifth floor, Solitaire Business Hub, Near Phoenix mall, Pune, Maharashtra 411014

                                                              Contact Information

                                                              Craig Francis

                                                              Business Development Head

                                                              +17162654855

                                                              [email protected]

                                                              Connect With Us

                                                              Secure Payment Partners

                                                              payment image
                                                              RetailLogisticsPackagingAutomotiveHealthcareAgricultureEnergy & PowerFood & BeverageAerospace & DefenseChemicals & MaterialsHospitality and TourismAnimal Nutrition & WellnessConsumer Goods and ServicesReal Estate and ConstructionHome and Property ImprovementTechnology, Media and TelecomManufacturing Products and ServicesFinancial Services and Investment Intelligence

                                                              © 2025 All rights reserved


                                                              Privacy Policy
                                                              Terms and Conditions
                                                              FAQ