

Key Insights
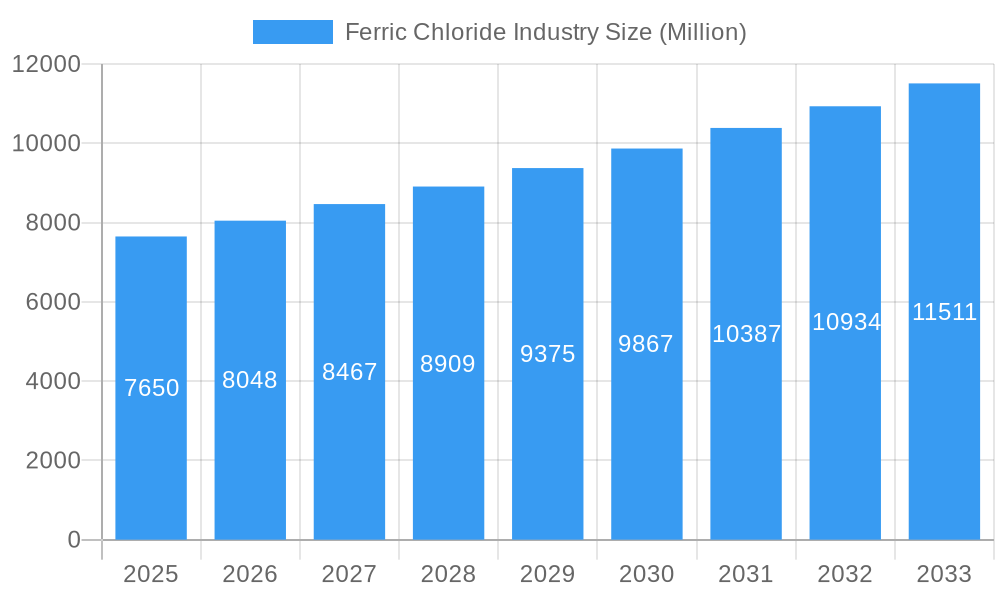
The global Ferric Chloride market is poised for robust growth, projected to reach an estimated $7.65 billion in 2025. This expansion is driven by a Compound Annual Growth Rate (CAGR) of 5.24% throughout the forecast period, indicating a healthy and sustained upward trajectory. A primary impetus for this growth is the escalating global demand for effective water and wastewater treatment solutions. As regulatory frameworks become more stringent and awareness of water scarcity increases, industries and municipalities are increasingly relying on ferric chloride as a highly efficient coagulant and flocculant to remove impurities, reduce pollutant loads, and ensure compliance with environmental standards. Beyond its critical role in water purification, the expanding electronics sector, particularly the production of Printed Circuit Boards (PCBs), contributes significantly to market demand. Ferric chloride's application in etching PCBs is indispensable, and the continuous innovation and growth in consumer electronics, telecommunications, and automotive industries fuel this segment. Furthermore, its use in pigment manufacturing for vibrant and durable colors in paints, inks, and plastics, alongside its niche applications in animal nutrient supplements and asphalt blowing, collectively contribute to the market's diversified revenue streams.
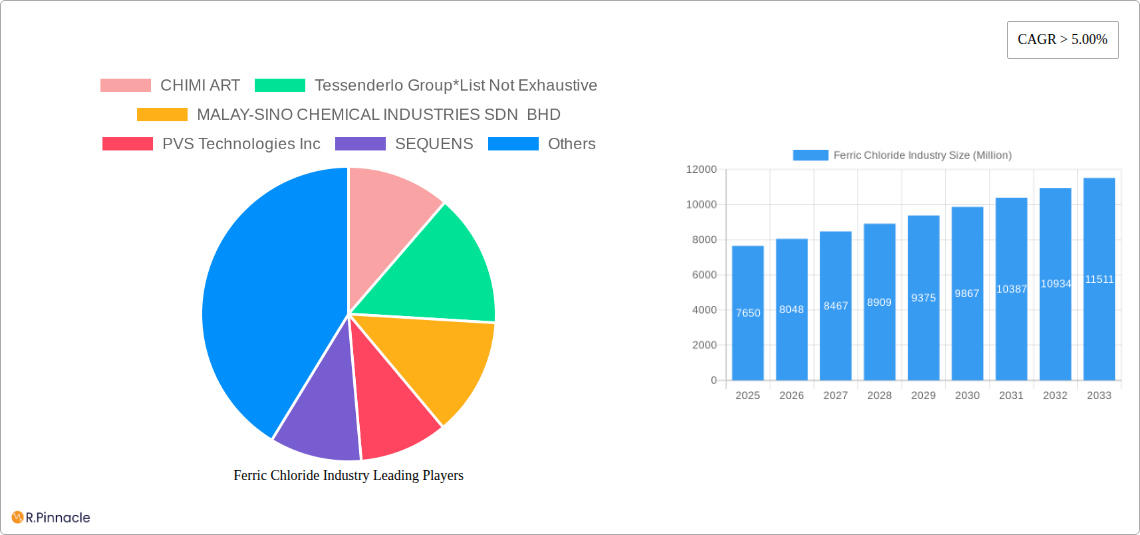
Ferric Chloride Industry Market Size (In Billion)
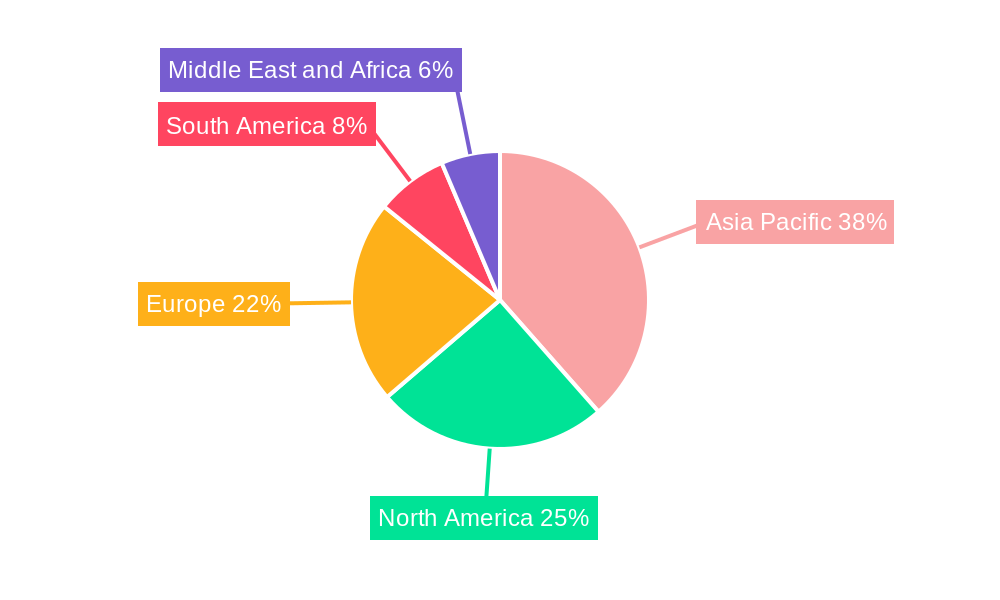
The market is expected to witness dynamic shifts influenced by evolving technological advancements and a growing emphasis on sustainable chemical production. Key players are focusing on optimizing production processes to enhance efficiency and reduce environmental impact, thereby addressing potential market restraints. While the inherent cost-effectiveness and proven efficacy of ferric chloride position it favorably, the development of alternative treatment chemicals and the potential volatility of raw material prices could present challenges. Geographically, the Asia Pacific region, led by China and India, is anticipated to be a dominant force due to rapid industrialization, increasing urbanization, and substantial investments in infrastructure, particularly in water treatment facilities. North America and Europe, with their established industrial bases and stringent environmental regulations, will continue to be significant markets. The Middle East and Africa also presents emerging opportunities, driven by the growing need for advanced water management solutions in arid regions and developing economies. Emerging trends in green chemistry and the circular economy may also shape future market dynamics, encouraging innovations in ferric chloride production and recycling.
Ferric Chloride Industry Company Market Share
This in-depth report delivers a detailed analysis of the global Ferric Chloride industry, providing critical insights for stakeholders seeking to understand market dynamics, growth drivers, and future opportunities. Spanning a study period from 2019 to 2033, with a base year of 2025 and a forecast period from 2025 to 2033, this report offers an unparalleled look at a market projected to reach billions in value. We meticulously examine key applications, leading companies, and transformative industry developments, offering actionable intelligence for strategic decision-making in this vital chemical sector.
Ferric Chloride Industry Market Structure & Innovation Trends
The Ferric Chloride industry exhibits a moderately concentrated market structure, with a few key players holding significant market share, estimated at over 70 billion. Innovation is primarily driven by advancements in production efficiency, development of higher-purity grades for specialized applications like electronics, and a growing emphasis on sustainable manufacturing processes. Regulatory frameworks, particularly concerning environmental impact and waste management, play a crucial role in shaping market entry and operational strategies, with compliance costs estimated to be in the billions. Product substitutes, such as aluminum sulfate and other coagulants, present a competitive challenge, particularly in water treatment, though ferric chloride's superior performance in certain conditions maintains its market penetration, estimated at over 60%. End-user demographics are increasingly influenced by stringent environmental regulations and the growing demand for clean water globally. Mergers and acquisition (M&A) activities, while sporadic, have been significant, with recent deals valued in the hundreds of millions of dollars, aimed at consolidating market presence and expanding product portfolios. The total M&A deal value is projected to reach over 5 billion by the end of the forecast period.
Ferric Chloride Industry Market Dynamics & Trends
The Ferric Chloride industry is experiencing robust growth, driven by a confluence of factors including increasing global demand for clean water, rapid industrialization in emerging economies, and the expanding use of ferric chloride in diverse applications. The market is projected to grow at a Compound Annual Growth Rate (CAGR) of approximately 5.5 billion, reaching a market size estimated to exceed 150 billion by 2033. Technological disruptions are primarily focused on optimizing production processes for higher yields and reduced energy consumption. Innovations in electrolysis and advanced oxidation processes are also gaining traction. Consumer preferences, while less direct for industrial chemicals, are indirectly shaped by the demand for environmentally friendly and efficient solutions. Companies are investing heavily in research and development to enhance product performance and explore novel applications. Competitive dynamics are characterized by intense price competition, a focus on product quality, and the strategic importance of securing reliable feedstock supplies. Market penetration for ferric chloride in key sectors like water treatment is already high, estimated at over 80%, with growth primarily coming from increased volume and the development of new niche markets. The industry is also witnessing a trend towards vertical integration, with companies aiming to control more of the supply chain, from raw material sourcing to final product distribution. Supply chain resilience has become a critical focus, with companies diversifying their sourcing strategies and investing in advanced logistics to mitigate potential disruptions. The economic impact of these dynamics is substantial, with the industry contributing billions to the global economy annually through its extensive supply chains and employment opportunities. The overall market valuation for the historical period of 2019-2024 is estimated to be around 90 billion.
Dominant Regions & Segments in Ferric Chloride Industry
The Water and Wastewater Treatment segment is the undisputed leader within the Ferric Chloride industry, accounting for an estimated market share of over 50 billion. This dominance is fueled by escalating global concerns regarding water scarcity and pollution, coupled with increasingly stringent environmental regulations mandating efficient wastewater treatment. Economic policies worldwide are actively promoting investment in water infrastructure, further bolstering demand. The Asia-Pacific region, particularly China and India, is a major growth engine due to rapid industrialization, expanding urban populations, and significant government initiatives for water resource management, contributing over 30 billion to regional market value. North America and Europe, with their well-established water treatment infrastructure and advanced regulatory frameworks, represent mature yet consistently significant markets, collectively valued at over 40 billion.
- Water and Wastewater Treatment: This segment's dominance is driven by its efficacy as a primary coagulant and flocculant, effectively removing suspended solids, phosphorus, and heavy metals. Infrastructure development projects and the need to comply with discharge standards are key drivers, with projected market growth of over 7 billion annually.
- Printed Circuit Board (PCB): Ferric chloride's role as an etchant in PCB manufacturing contributes a significant, albeit smaller, segment, valued at approximately 10 billion. The booming electronics industry and the increasing complexity of PCBs are fueling demand for high-purity ferric chloride. Technological advancements in etching processes and the miniaturization of electronic components are key drivers.
- Pigment Manufacturing: Used in the production of certain pigments, this segment contributes around 5 billion. Demand here is influenced by the construction and automotive industries.
- Animal Nutrient Supplements: Ferric chloride serves as a source of iron in animal feed, a segment valued at roughly 3 billion. Growth is linked to the expanding global livestock industry and the demand for animal health products.
- Asphalt Blowing: Its application in asphalt blowing processes adds another segment, with a market value of approximately 2 billion. This is influenced by the construction and road maintenance sectors.
- Other Applications: This diverse category, encompassing applications in metallurgy and chemical synthesis, contributes an additional 5 billion, with potential for growth in niche industrial processes.
Ferric Chloride Industry Product Innovations
Product innovation in the Ferric Chloride industry is primarily focused on enhancing purity, improving handling characteristics, and developing specialized formulations for niche applications. Leading companies are investing in advanced purification techniques to produce ferric chloride with extremely low impurity levels, crucial for sensitive applications like electronics manufacturing and pharmaceuticals. Development of more stable and less corrosive formulations is also a key trend, addressing safety and infrastructure challenges associated with traditional ferric chloride solutions. These innovations provide manufacturers with a competitive advantage by enabling them to cater to evolving industry demands and capture higher-value market segments.
Report Scope & Segmentation Analysis
This report provides a granular analysis of the Ferric Chloride market across its key application segments, including Water and Wastewater Treatment, Printed Circuit Board (PCB) manufacturing, Pigment Manufacturing, Animal Nutrient Supplements, Asphalt Blowing, and Other Applications. The Water and Wastewater Treatment segment, projected to reach over 80 billion by 2033, remains the largest contributor, driven by global efforts to ensure access to clean water and effective wastewater management. The PCB segment, valued at approximately 15 billion, is experiencing steady growth due to the expansion of the electronics industry. Pigment Manufacturing is estimated to reach 7 billion, influenced by construction and automotive demands. Animal Nutrient Supplements are projected to grow to 5 billion, driven by the global livestock sector. Asphalt Blowing is expected to reach 3 billion, tied to infrastructure development. Other Applications, encompassing various industrial uses, are anticipated to reach 7 billion, with potential for expansion in specialized chemical synthesis.
Key Drivers of Ferric Chloride Industry Growth
The Ferric Chloride industry's growth is propelled by several key factors. Growing Demand for Clean Water: Increasing global population and industrialization necessitate advanced water and wastewater treatment solutions, where ferric chloride plays a vital role as a coagulant. Stringent Environmental Regulations: Governments worldwide are enforcing stricter standards for industrial discharge and water quality, compelling industries to adopt more effective treatment chemicals. Industrial Expansion in Emerging Economies: Rapid industrial growth in regions like Asia-Pacific is driving demand for ferric chloride in various manufacturing processes, including PCB production and pigment manufacturing. Technological Advancements: Innovations in production methods are leading to more efficient and cost-effective manufacturing of ferric chloride, making it more accessible.
Challenges in the Ferric Chloride Industry Sector
Despite its growth potential, the Ferric Chloride industry faces several challenges. Corrosiveness and Handling Issues: Ferric chloride is highly corrosive, requiring specialized infrastructure and safety protocols for storage and transportation, leading to increased operational costs, estimated to add up to 2 billion annually in infrastructure and safety investments. Price Volatility of Raw Materials: Fluctuations in the prices of key raw materials like hydrochloric acid and iron scrap can impact profit margins and pricing strategies. Competition from Substitutes: While effective, ferric chloride faces competition from alternative coagulants like aluminum sulfate, particularly in price-sensitive markets. Environmental Concerns: Although a vital treatment chemical, the production and disposal of ferric chloride can have environmental implications, necessitating careful management and adherence to regulations.
Emerging Opportunities in Ferric Chloride Industry
Emerging opportunities in the Ferric Chloride industry are centered around innovation and expanding market reach. Sustainable Production Methods: Development of greener production processes, utilizing recycled materials and minimizing waste, presents a significant opportunity to enhance brand reputation and market appeal. New Application Development: Research into novel applications in areas such as advanced material synthesis and specialized chemical processes can unlock new market segments. Geographical Expansion: Tapping into underserved markets in developing regions with growing industrial bases and increasing focus on environmental compliance offers substantial growth potential. High-Purity Grades for Specialized Industries: The demand for ultra-high purity ferric chloride in sectors like semiconductors and pharmaceuticals presents lucrative opportunities for manufacturers capable of meeting stringent quality standards.
Leading Players in the Ferric Chloride Industry Market
- CHIMI ART
- Tessenderlo Group
- MALAY-SINO CHEMICAL INDUSTRIES SDN BHD
- PVS Technologies Inc
- SEQUENS
- MISR Chemical Industries
- Feralco AB
- Chemifloc LTD
- Saf Sulphur Factory
- BASF SE
- Kemira
- HORIZON CHEMICALS
- SIDRA WASSERCHEMIE GmbH
- Basic Chemical Industries
- Nobian
Key Developments in Ferric Chloride Industry Industry
- February 2022: Chemieanlagenbau Chemnitz commissioned its first ferric chloride plant for Al Kout Industrial Projects (AIP) in Kuwait, boasting an annual production capacity of 20,000 tons and utilizing iron scrap, hydrochloric acid, and chlorine gas as feedstock.
- July 2021: Nouryon announced the spin-out of its base chemicals business into a new, independent company named Nobian, which includes the manufacturing and sales of ferric chloride.
Future Outlook for Ferric Chloride Industry Market
The future outlook for the Ferric Chloride industry is highly positive, underpinned by sustained demand from the critical water and wastewater treatment sector. Growth accelerators include an increasing global emphasis on water security, stricter environmental regulations, and the expanding industrial landscape in emerging economies. Strategic opportunities lie in embracing sustainable production technologies, exploring novel applications in advanced materials and specialized chemicals, and expanding market presence in regions with nascent industrial development and growing environmental consciousness. The industry is poised for continued expansion, with a projected market value exceeding 150 billion by 2033, driven by innovation and an unwavering need for efficient chemical solutions.
Ferric Chloride Industry Segmentation
-
1. Application
- 1.1. Water and Wastewater Treatment
- 1.2. Printed Circuit Board (PCB)
- 1.3. Pigment Manufacturing
- 1.4. Animal Nutrient Supplements
- 1.5. Asphalt Blowing
- 1.6. Other Applications
Ferric Chloride Industry Segmentation By Geography
-
1. Asia Pacific
- 1.1. China
- 1.2. India
- 1.3. Japan
- 1.4. South Korea
- 1.5. ASEAN Countries
- 1.6. Rest of Asia Pacific
-
2. North America
- 2.1. United States
- 2.2. Canada
- 2.3. Mexico
-
3. Europe
- 3.1. Germany
- 3.2. United Kingdom
- 3.3. Italy
- 3.4. France
- 3.5. Russia
- 3.6. Spain
- 3.7. Rest of Europe
-
4. South America
- 4.1. Brazil
- 4.2. Argentina
- 4.3. Rest of South America
-
5. Middle East and Africa
- 5.1. Saudi Arabia
- 5.2. Egypt
- 5.3. South Africa
- 5.4. Rest of Middle East and Africa
Ferric Chloride Industry Regional Market Share
Geographic Coverage of Ferric Chloride Industry
Ferric Chloride Industry REPORT HIGHLIGHTS
| Aspects | Details |
|---|---|
| Study Period | 2020-2034 |
| Base Year | 2025 |
| Estimated Year | 2026 |
| Forecast Period | 2026-2034 |
| Historical Period | 2020-2025 |
| Growth Rate | CAGR of 4.8% from 2020-2034 |
| Segmentation |
|
Table of Contents
- 1. Introduction
- 1.1. Research Scope
- 1.2. Market Segmentation
- 1.3. Research Objective
- 1.4. Definitions and Assumptions
- 2. Executive Summary
- 2.1. Market Snapshot
- 3. Market Dynamics
- 3.1. Market Drivers
- 3.2. Market Restrains
- 3.3. Market Trends
- 3.4. Market Opportunities
- 4. Market Factor Analysis
- 4.1. Porters Five Forces
- 4.1.1. Bargaining Power of Suppliers
- 4.1.2. Bargaining Power of Buyers
- 4.1.3. Threat of New Entrants
- 4.1.4. Threat of Substitutes
- 4.1.5. Competitive Rivalry
- 4.2. PESTEL analysis
- 4.3. BCG Analysis
- 4.3.1. Stars (High Growth, High Market Share)
- 4.3.2. Cash Cows (Low Growth, High Market Share)
- 4.3.3. Question Mark (High Growth, Low Market Share)
- 4.3.4. Dogs (Low Growth, Low Market Share)
- 4.4. Ansoff Matrix Analysis
- 4.5. Supply Chain Analysis
- 4.6. Regulatory Landscape
- 4.7. Current Market Potential and Opportunity Assessment (TAM–SAM–SOM Framework)
- 4.8. PRI Analyst Note
- 4.1. Porters Five Forces
- 5. Market Analysis, Insights and Forecast 2021-2033
- 5.1. Market Analysis, Insights and Forecast - by Application
- 5.1.1. Water and Wastewater Treatment
- 5.1.2. Printed Circuit Board (PCB)
- 5.1.3. Pigment Manufacturing
- 5.1.4. Animal Nutrient Supplements
- 5.1.5. Asphalt Blowing
- 5.1.6. Other Applications
- 5.2. Market Analysis, Insights and Forecast - by Region
- 5.2.1. Asia Pacific
- 5.2.2. North America
- 5.2.3. Europe
- 5.2.4. South America
- 5.2.5. Middle East and Africa
- 5.1. Market Analysis, Insights and Forecast - by Application
- 6. Global Ferric Chloride Industry Analysis, Insights and Forecast, 2021-2033
- 6.1. Market Analysis, Insights and Forecast - by Application
- 6.1.1. Water and Wastewater Treatment
- 6.1.2. Printed Circuit Board (PCB)
- 6.1.3. Pigment Manufacturing
- 6.1.4. Animal Nutrient Supplements
- 6.1.5. Asphalt Blowing
- 6.1.6. Other Applications
- 6.1. Market Analysis, Insights and Forecast - by Application
- 7. Asia Pacific Ferric Chloride Industry Analysis, Insights and Forecast, 2020-2032
- 7.1. Market Analysis, Insights and Forecast - by Application
- 7.1.1. Water and Wastewater Treatment
- 7.1.2. Printed Circuit Board (PCB)
- 7.1.3. Pigment Manufacturing
- 7.1.4. Animal Nutrient Supplements
- 7.1.5. Asphalt Blowing
- 7.1.6. Other Applications
- 7.1. Market Analysis, Insights and Forecast - by Application
- 8. North America Ferric Chloride Industry Analysis, Insights and Forecast, 2020-2032
- 8.1. Market Analysis, Insights and Forecast - by Application
- 8.1.1. Water and Wastewater Treatment
- 8.1.2. Printed Circuit Board (PCB)
- 8.1.3. Pigment Manufacturing
- 8.1.4. Animal Nutrient Supplements
- 8.1.5. Asphalt Blowing
- 8.1.6. Other Applications
- 8.1. Market Analysis, Insights and Forecast - by Application
- 9. Europe Ferric Chloride Industry Analysis, Insights and Forecast, 2020-2032
- 9.1. Market Analysis, Insights and Forecast - by Application
- 9.1.1. Water and Wastewater Treatment
- 9.1.2. Printed Circuit Board (PCB)
- 9.1.3. Pigment Manufacturing
- 9.1.4. Animal Nutrient Supplements
- 9.1.5. Asphalt Blowing
- 9.1.6. Other Applications
- 9.1. Market Analysis, Insights and Forecast - by Application
- 10. South America Ferric Chloride Industry Analysis, Insights and Forecast, 2020-2032
- 10.1. Market Analysis, Insights and Forecast - by Application
- 10.1.1. Water and Wastewater Treatment
- 10.1.2. Printed Circuit Board (PCB)
- 10.1.3. Pigment Manufacturing
- 10.1.4. Animal Nutrient Supplements
- 10.1.5. Asphalt Blowing
- 10.1.6. Other Applications
- 10.1. Market Analysis, Insights and Forecast - by Application
- 11. Middle East and Africa Ferric Chloride Industry Analysis, Insights and Forecast, 2020-2032
- 11.1. Market Analysis, Insights and Forecast - by Application
- 11.1.1. Water and Wastewater Treatment
- 11.1.2. Printed Circuit Board (PCB)
- 11.1.3. Pigment Manufacturing
- 11.1.4. Animal Nutrient Supplements
- 11.1.5. Asphalt Blowing
- 11.1.6. Other Applications
- 11.1. Market Analysis, Insights and Forecast - by Application
- 12. Competitive Analysis
- 12.1. Company Profiles
- 12.1.1 CHIMI ART
- 12.1.1.1. Company Overview
- 12.1.1.2. Products
- 12.1.1.3. Company Financials
- 12.1.1.4. SWOT Analysis
- 12.1.2 Tessenderlo Group*List Not Exhaustive
- 12.1.2.1. Company Overview
- 12.1.2.2. Products
- 12.1.2.3. Company Financials
- 12.1.2.4. SWOT Analysis
- 12.1.3 MALAY-SINO CHEMICAL INDUSTRIES SDN BHD
- 12.1.3.1. Company Overview
- 12.1.3.2. Products
- 12.1.3.3. Company Financials
- 12.1.3.4. SWOT Analysis
- 12.1.4 PVS Technologies Inc
- 12.1.4.1. Company Overview
- 12.1.4.2. Products
- 12.1.4.3. Company Financials
- 12.1.4.4. SWOT Analysis
- 12.1.5 SEQUENS
- 12.1.5.1. Company Overview
- 12.1.5.2. Products
- 12.1.5.3. Company Financials
- 12.1.5.4. SWOT Analysis
- 12.1.6 MISR Chemical Industries
- 12.1.6.1. Company Overview
- 12.1.6.2. Products
- 12.1.6.3. Company Financials
- 12.1.6.4. SWOT Analysis
- 12.1.7 Feralco AB
- 12.1.7.1. Company Overview
- 12.1.7.2. Products
- 12.1.7.3. Company Financials
- 12.1.7.4. SWOT Analysis
- 12.1.8 Chemifloc LTD
- 12.1.8.1. Company Overview
- 12.1.8.2. Products
- 12.1.8.3. Company Financials
- 12.1.8.4. SWOT Analysis
- 12.1.9 Saf Sulphur Factory
- 12.1.9.1. Company Overview
- 12.1.9.2. Products
- 12.1.9.3. Company Financials
- 12.1.9.4. SWOT Analysis
- 12.1.10 BASF SE
- 12.1.10.1. Company Overview
- 12.1.10.2. Products
- 12.1.10.3. Company Financials
- 12.1.10.4. SWOT Analysis
- 12.1.11 Kemira
- 12.1.11.1. Company Overview
- 12.1.11.2. Products
- 12.1.11.3. Company Financials
- 12.1.11.4. SWOT Analysis
- 12.1.12 HORIZON CHEMICALS
- 12.1.12.1. Company Overview
- 12.1.12.2. Products
- 12.1.12.3. Company Financials
- 12.1.12.4. SWOT Analysis
- 12.1.13 SIDRA WASSERCHEMIE GmbH
- 12.1.13.1. Company Overview
- 12.1.13.2. Products
- 12.1.13.3. Company Financials
- 12.1.13.4. SWOT Analysis
- 12.1.14 Basic Chemical Industries
- 12.1.14.1. Company Overview
- 12.1.14.2. Products
- 12.1.14.3. Company Financials
- 12.1.14.4. SWOT Analysis
- 12.1.15 Nobian
- 12.1.15.1. Company Overview
- 12.1.15.2. Products
- 12.1.15.3. Company Financials
- 12.1.15.4. SWOT Analysis
- 12.1.1 CHIMI ART
- 12.2. Market Entropy
- 12.2.1 Company's Key Areas Served
- 12.2.2 Recent Developments
- 12.3. Company Market Share Analysis 2025
- 12.3.1 Top 5 Companies Market Share Analysis
- 12.3.2 Top 3 Companies Market Share Analysis
- 12.4. List of Potential Customers
- 13. Research Methodology
List of Figures
- Figure 1: Global Ferric Chloride Industry Revenue Breakdown (million, %) by Region 2025 & 2033
- Figure 2: Asia Pacific Ferric Chloride Industry Revenue (million), by Application 2025 & 2033
- Figure 3: Asia Pacific Ferric Chloride Industry Revenue Share (%), by Application 2025 & 2033
- Figure 4: Asia Pacific Ferric Chloride Industry Revenue (million), by Country 2025 & 2033
- Figure 5: Asia Pacific Ferric Chloride Industry Revenue Share (%), by Country 2025 & 2033
- Figure 6: North America Ferric Chloride Industry Revenue (million), by Application 2025 & 2033
- Figure 7: North America Ferric Chloride Industry Revenue Share (%), by Application 2025 & 2033
- Figure 8: North America Ferric Chloride Industry Revenue (million), by Country 2025 & 2033
- Figure 9: North America Ferric Chloride Industry Revenue Share (%), by Country 2025 & 2033
- Figure 10: Europe Ferric Chloride Industry Revenue (million), by Application 2025 & 2033
- Figure 11: Europe Ferric Chloride Industry Revenue Share (%), by Application 2025 & 2033
- Figure 12: Europe Ferric Chloride Industry Revenue (million), by Country 2025 & 2033
- Figure 13: Europe Ferric Chloride Industry Revenue Share (%), by Country 2025 & 2033
- Figure 14: South America Ferric Chloride Industry Revenue (million), by Application 2025 & 2033
- Figure 15: South America Ferric Chloride Industry Revenue Share (%), by Application 2025 & 2033
- Figure 16: South America Ferric Chloride Industry Revenue (million), by Country 2025 & 2033
- Figure 17: South America Ferric Chloride Industry Revenue Share (%), by Country 2025 & 2033
- Figure 18: Middle East and Africa Ferric Chloride Industry Revenue (million), by Application 2025 & 2033
- Figure 19: Middle East and Africa Ferric Chloride Industry Revenue Share (%), by Application 2025 & 2033
- Figure 20: Middle East and Africa Ferric Chloride Industry Revenue (million), by Country 2025 & 2033
- Figure 21: Middle East and Africa Ferric Chloride Industry Revenue Share (%), by Country 2025 & 2033
List of Tables
- Table 1: Global Ferric Chloride Industry Revenue million Forecast, by Application 2020 & 2033
- Table 2: Global Ferric Chloride Industry Revenue million Forecast, by Region 2020 & 2033
- Table 3: Global Ferric Chloride Industry Revenue million Forecast, by Application 2020 & 2033
- Table 4: Global Ferric Chloride Industry Revenue million Forecast, by Country 2020 & 2033
- Table 5: China Ferric Chloride Industry Revenue (million) Forecast, by Application 2020 & 2033
- Table 6: India Ferric Chloride Industry Revenue (million) Forecast, by Application 2020 & 2033
- Table 7: Japan Ferric Chloride Industry Revenue (million) Forecast, by Application 2020 & 2033
- Table 8: South Korea Ferric Chloride Industry Revenue (million) Forecast, by Application 2020 & 2033
- Table 9: ASEAN Countries Ferric Chloride Industry Revenue (million) Forecast, by Application 2020 & 2033
- Table 10: Rest of Asia Pacific Ferric Chloride Industry Revenue (million) Forecast, by Application 2020 & 2033
- Table 11: Global Ferric Chloride Industry Revenue million Forecast, by Application 2020 & 2033
- Table 12: Global Ferric Chloride Industry Revenue million Forecast, by Country 2020 & 2033
- Table 13: United States Ferric Chloride Industry Revenue (million) Forecast, by Application 2020 & 2033
- Table 14: Canada Ferric Chloride Industry Revenue (million) Forecast, by Application 2020 & 2033
- Table 15: Mexico Ferric Chloride Industry Revenue (million) Forecast, by Application 2020 & 2033
- Table 16: Global Ferric Chloride Industry Revenue million Forecast, by Application 2020 & 2033
- Table 17: Global Ferric Chloride Industry Revenue million Forecast, by Country 2020 & 2033
- Table 18: Germany Ferric Chloride Industry Revenue (million) Forecast, by Application 2020 & 2033
- Table 19: United Kingdom Ferric Chloride Industry Revenue (million) Forecast, by Application 2020 & 2033
- Table 20: Italy Ferric Chloride Industry Revenue (million) Forecast, by Application 2020 & 2033
- Table 21: France Ferric Chloride Industry Revenue (million) Forecast, by Application 2020 & 2033
- Table 22: Russia Ferric Chloride Industry Revenue (million) Forecast, by Application 2020 & 2033
- Table 23: Spain Ferric Chloride Industry Revenue (million) Forecast, by Application 2020 & 2033
- Table 24: Rest of Europe Ferric Chloride Industry Revenue (million) Forecast, by Application 2020 & 2033
- Table 25: Global Ferric Chloride Industry Revenue million Forecast, by Application 2020 & 2033
- Table 26: Global Ferric Chloride Industry Revenue million Forecast, by Country 2020 & 2033
- Table 27: Brazil Ferric Chloride Industry Revenue (million) Forecast, by Application 2020 & 2033
- Table 28: Argentina Ferric Chloride Industry Revenue (million) Forecast, by Application 2020 & 2033
- Table 29: Rest of South America Ferric Chloride Industry Revenue (million) Forecast, by Application 2020 & 2033
- Table 30: Global Ferric Chloride Industry Revenue million Forecast, by Application 2020 & 2033
- Table 31: Global Ferric Chloride Industry Revenue million Forecast, by Country 2020 & 2033
- Table 32: Saudi Arabia Ferric Chloride Industry Revenue (million) Forecast, by Application 2020 & 2033
- Table 33: Egypt Ferric Chloride Industry Revenue (million) Forecast, by Application 2020 & 2033
- Table 34: South Africa Ferric Chloride Industry Revenue (million) Forecast, by Application 2020 & 2033
- Table 35: Rest of Middle East and Africa Ferric Chloride Industry Revenue (million) Forecast, by Application 2020 & 2033
Frequently Asked Questions
1. What is the projected Compound Annual Growth Rate (CAGR) of the Ferric Chloride Industry?
The projected CAGR is approximately 4.8%.
2. Which companies are prominent players in the Ferric Chloride Industry?
Key companies in the market include CHIMI ART, Tessenderlo Group*List Not Exhaustive, MALAY-SINO CHEMICAL INDUSTRIES SDN BHD, PVS Technologies Inc, SEQUENS, MISR Chemical Industries, Feralco AB, Chemifloc LTD, Saf Sulphur Factory, BASF SE, Kemira, HORIZON CHEMICALS, SIDRA WASSERCHEMIE GmbH, Basic Chemical Industries, Nobian.
3. What are the main segments of the Ferric Chloride Industry?
The market segments include Application.
4. Can you provide details about the market size?
The market size is estimated to be USD 663 million as of 2022.
5. What are some drivers contributing to market growth?
High Demand from Wastewater Treatment Plants; Increasing Stringent Norms for the Treatment of Sewage Water and Industrial Waste to Curtail Pollution.
6. What are the notable trends driving market growth?
Increasing Applications in the Printed Circuit Board (PCB).
7. Are there any restraints impacting market growth?
Stringent Regulations Imposed on Companies during the Manufacturing and Shipment of Ferric Chloride Products; Presence of Substitutes Products.
8. Can you provide examples of recent developments in the market?
In February 2022, Chemieanlagenbau Chemnitz announced that the company commissioned its first ferric chloride plant for its client Al Kout Industrial Projects (AIP) at Shuaiba in the Persian Gulf, Kuwait. The plant uses feedstock such as iron scrap, hydrochloric acid and chlorine gas and has an annual production capacity of 20,000 tons of ferric chloride (FeCl3).
9. What pricing options are available for accessing the report?
Pricing options include single-user, multi-user, and enterprise licenses priced at USD 4750, USD 5250, and USD 8750 respectively.
10. Is the market size provided in terms of value or volume?
The market size is provided in terms of value, measured in million.
11. Are there any specific market keywords associated with the report?
Yes, the market keyword associated with the report is "Ferric Chloride Industry," which aids in identifying and referencing the specific market segment covered.
12. How do I determine which pricing option suits my needs best?
The pricing options vary based on user requirements and access needs. Individual users may opt for single-user licenses, while businesses requiring broader access may choose multi-user or enterprise licenses for cost-effective access to the report.
13. Are there any additional resources or data provided in the Ferric Chloride Industry report?
While the report offers comprehensive insights, it's advisable to review the specific contents or supplementary materials provided to ascertain if additional resources or data are available.
14. How can I stay updated on further developments or reports in the Ferric Chloride Industry?
To stay informed about further developments, trends, and reports in the Ferric Chloride Industry, consider subscribing to industry newsletters, following relevant companies and organizations, or regularly checking reputable industry news sources and publications.
Methodology
Step 1 - Identification of Relevant Samples Size from Population Database


Step 2 - Approaches for Defining Global Market Size (Value, Volume* & Price*)

Note*: In applicable scenarios
Step 3 - Data Sources
Primary Research
- Web Analytics
- Survey Reports
- Research Institute
- Latest Research Reports
- Opinion Leaders
Secondary Research
- Annual Reports
- White Paper
- Latest Press Release
- Industry Association
- Paid Database
- Investor Presentations

Step 4 - Data Triangulation
Involves using different sources of information in order to increase the validity of a study
These sources are likely to be stakeholders in a program - participants, other researchers, program staff, other community members, and so on.
Then we put all data in single framework & apply various statistical tools to find out the dynamic on the market.
During the analysis stage, feedback from the stakeholder groups would be compared to determine areas of agreement as well as areas of divergence