

Key Insights
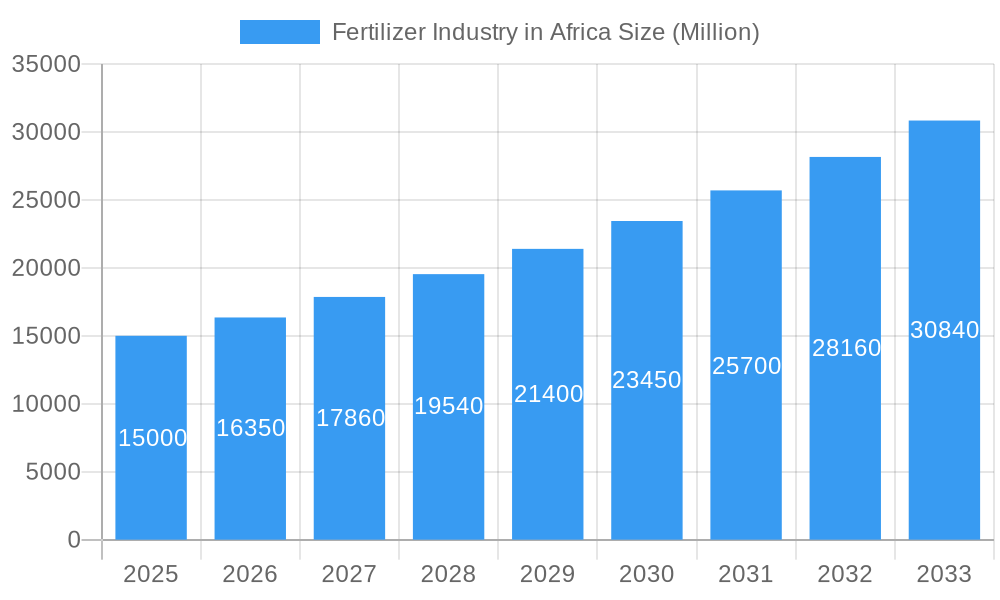
The African fertilizer market, valued at approximately $XX million in 2025, is experiencing robust growth, projected to achieve a Compound Annual Growth Rate (CAGR) of 9.02% from 2025 to 2033. This expansion is fueled by several key drivers. Increased agricultural investment across the continent, coupled with government initiatives promoting food security and agricultural modernization, are significantly boosting demand. Rising population and the consequent need for increased food production are major factors. Furthermore, advancements in fertilizer technology, focusing on improved efficiency and reduced environmental impact, are contributing to market growth. However, challenges remain. High input costs, including raw materials and transportation, coupled with infrastructural limitations in certain regions, pose constraints. Variability in rainfall patterns and soil conditions also present obstacles to consistent agricultural yields and fertilizer uptake. Market segmentation reveals strong growth in both production and consumption, with varying levels of import and export activity across different African nations. Leading players like Haifa Group, Foskor, and Yara International are actively engaged in meeting the growing demand, though smaller regional players also play a significant role, especially in specific markets. The analysis suggests a concentration of market share in North and Southern Africa, with significant growth potential in East and West Africa. The forecast period (2025-2033) shows continued expansion, driven by ongoing agricultural investments and technological advancements, albeit at a pace potentially moderated by the persistent infrastructural and logistical challenges.
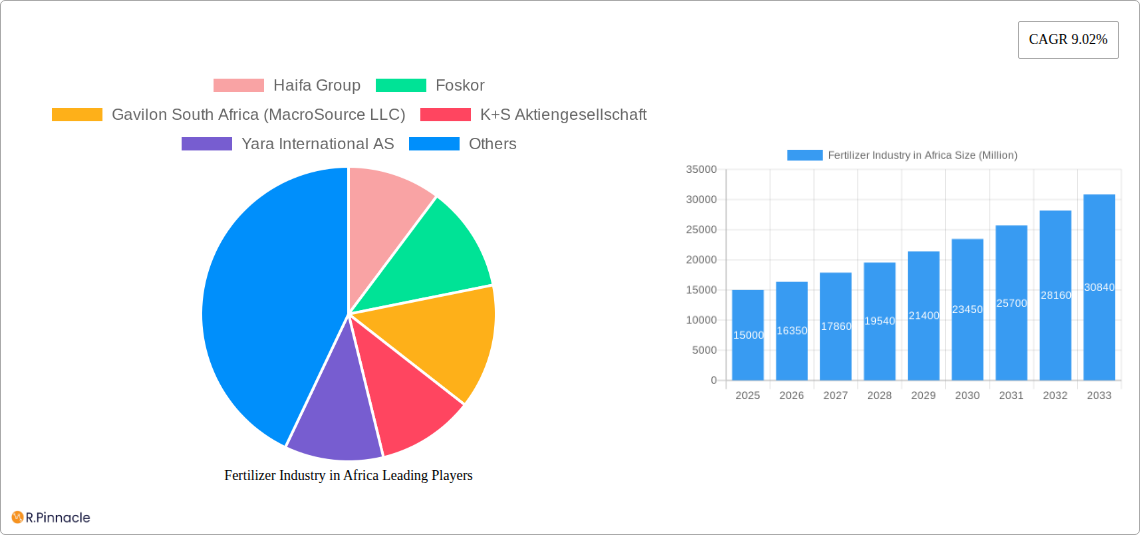
Fertilizer Industry in Africa Market Size (In Billion)
The diverse regional landscape within Africa presents both opportunities and challenges. North Africa, with its established agricultural infrastructure, commands a substantial market share. However, sub-Saharan Africa exhibits significant growth potential, driven by rising populations and increasing government focus on agricultural development. The analysis highlights the importance of tailored strategies for different regions, acknowledging the varied agricultural practices and infrastructural capacities. Further research into specific regional factors, including soil types, climate conditions, and farming practices, is crucial for effective market penetration and sustainable growth in the fertilizer industry. The success of fertilizer companies in Africa will depend on their ability to address the challenges of access, affordability, and sustainable agricultural practices, while effectively capitalizing on the rising demand for increased food production.
Fertilizer Industry in Africa Company Market Share
Fertilizer Industry in Africa: 2019-2033 Market Analysis & Forecast Report
This comprehensive report provides a detailed analysis of the African fertilizer industry, covering market dynamics, key players, and future growth prospects. With a study period spanning 2019-2033 (base year 2025, forecast period 2025-2033), this report offers actionable insights for industry professionals, investors, and policymakers. We analyze market segments, including production, consumption, import, and export, across key African nations. The report leverages extensive data analysis to highlight growth opportunities and potential challenges within this dynamic market. The total market value in 2025 is estimated at xx Million USD.
Fertilizer Industry in Africa Market Structure & Innovation Trends
This section analyzes the competitive landscape of the African fertilizer industry, examining market concentration, innovation drivers, regulatory frameworks, and mergers & acquisitions (M&A) activity. The market is characterized by a mix of large multinational corporations and smaller regional players.
Market Concentration: The market exhibits a moderately concentrated structure, with a few major players holding significant market share, while numerous smaller companies cater to niche segments. Haifa Group, Foskor, Gavilon South Africa (MacroSource LLC), K+S Aktiengesellschaft, Yara International AS, UPL Limited, ICL Group Ltd, and Kynoch Fertilizer are among the prominent players, collectively commanding an estimated xx% market share in 2025.
Innovation Drivers: Technological advancements in fertilizer production, precision agriculture, and sustainable farming practices are key innovation drivers. The demand for enhanced nutrient efficiency and environmentally friendly solutions is pushing companies to develop innovative products and formulations.
Regulatory Framework: Varying regulatory frameworks across African nations influence market dynamics. Policies related to fertilizer subsidies, import tariffs, and environmental regulations impact production, consumption, and trade.
Product Substitutes: Organic fertilizers and biofertilizers are emerging as substitutes for conventional chemical fertilizers, driven by growing awareness of environmental sustainability.
End-User Demographics: The end-user base comprises smallholder farmers, large-scale agricultural businesses, and government agencies. The distribution of fertilizer across these user groups significantly impacts market demand.
M&A Activities: Recent M&A activity, including K+S's acquisition of a 75% share in Industrial Commodities Holdings (Pty) Ltd (ICH) in April 2023, demonstrates ongoing consolidation within the industry. The deal value for this acquisition was estimated at xx Million USD. Such activities reshape market dynamics and competitive landscapes.
Fertilizer Industry in Africa Market Dynamics & Trends
The African fertilizer market is experiencing significant growth driven by factors such as increasing agricultural production, rising population, and supportive government policies promoting food security. The market is projected to witness a Compound Annual Growth Rate (CAGR) of xx% during the forecast period (2025-2033). Market penetration of improved fertilizer technologies and practices remains relatively low, indicating significant growth potential. Technological disruptions, such as precision agriculture and digital farming tools, are improving fertilizer application efficiency and optimizing yields. Consumer preferences are shifting towards higher-quality, value-added fertilizers with improved nutrient content and enhanced formulations to cater to specific crop needs. The competitive dynamics are shaped by both domestic and international players competing on price, quality, and innovation.
Dominant Regions & Segments in Fertilizer Industry in Africa
Production Analysis: xx region dominates fertilizer production, driven by factors such as resource availability, infrastructure, and government support. Production in 2025 is estimated at xx Million tons.
Consumption Analysis: xx country exhibits the highest fertilizer consumption due to its large agricultural sector and favorable climatic conditions. Total consumption in 2025 is predicted at xx Million tons.
Import Market Analysis (Value & Volume): Import value and volume vary across regions due to differences in domestic production capacity and demand. xx region represents a significant import market, totaling xx Million USD in value and xx Million tons in volume in 2025.
Export Market Analysis (Value & Volume): xx country is a major exporter of fertilizer products, driven by its efficient production capabilities and strategic location. Export value is estimated at xx Million USD and volume at xx Million tons in 2025.
Price Trend Analysis: Fertilizer prices are influenced by global commodity markets, currency fluctuations, and local supply-demand dynamics. Prices showed a xx% increase in 2025 compared to 2024.
Fertilizer Industry in Africa Product Innovations
The industry is witnessing the introduction of new fertilizer formulations tailored to specific crop needs and soil conditions. Technological advancements, such as controlled-release fertilizers and nano-fertilizers, aim to improve nutrient use efficiency and reduce environmental impacts. Companies are emphasizing sustainable and eco-friendly fertilizer options to meet growing consumer demand. These innovations aim to enhance crop yields, improve resource utilization, and minimize the environmental footprint of agriculture in Africa.
Report Scope & Segmentation Analysis
The report provides a detailed segmentation analysis based on fertilizer type (NPK, Urea, DAP, etc.), crop type (cereals, pulses, oilseeds, etc.), application method (broadcast, banding, foliar), and region. Each segment is further analyzed based on its market size, growth rate, and competitive dynamics. Growth projections for each segment are provided for the forecast period (2025-2033). Competitive analysis within each segment highlights key players and their market strategies.
Key Drivers of Fertilizer Industry in Africa Growth
Several factors drive the growth of the African fertilizer industry. These include increasing agricultural output, government initiatives to enhance food security, rising investments in agricultural infrastructure, and the growing adoption of modern farming techniques. Technological advancements are also driving growth by enhancing fertilizer efficiency and promoting sustainable agriculture practices.
Challenges in the Fertilizer Industry in Africa Sector
The African fertilizer industry faces numerous challenges. These include inadequate infrastructure for efficient distribution, high transportation costs, limited access to credit for farmers, and the need for improved agricultural extension services. Supply chain disruptions, price volatility in raw materials, and the high cost of production also impact industry growth.
Emerging Opportunities in Fertilizer Industry in Africa
Several emerging opportunities exist within the African fertilizer sector. These include the expansion of fertilizer blending facilities in local markets, the development of tailored fertilizer products for specific crops and soil conditions, and the growing adoption of precision agriculture technologies. The increasing focus on sustainable agriculture and the development of climate-smart fertilizer solutions also present significant opportunities.
Leading Players in the Fertilizer Industry in Africa Market
- Haifa Group
- Foskor
- Gavilon South Africa (MacroSource LLC)
- K+S Aktiengesellschaft
- Yara International AS
- UPL Limited
- ICL Group Ltd
- Kynoch Fertilizer
Key Developments in Fertilizer Industry in Africa Industry
April 2023: K+S acquired a 75% share of the fertilizer business of Industrial Commodities Holdings (Pty) Ltd (ICH), strengthening its presence in southern and eastern Africa. The new joint venture, FertivPty Ltd, will further expand K+S's operations.
January 2023: ICL partnered with General Mills, securing a long-term supply agreement for specialty phosphate solutions, expanding its international reach.
May 2022: ICL launched three new NPK formulations of Solinure, a product enhanced with trace elements for optimized crop yields.
Future Outlook for Fertilizer Industry in Africa Market
The African fertilizer industry is poised for substantial growth over the coming years. Continued investments in agricultural infrastructure, supportive government policies, and technological advancements will accelerate market expansion. Growing consumer demand for higher-quality fertilizers and the adoption of sustainable agricultural practices will drive innovation and competition within the industry. The focus on food security and improved agricultural productivity presents significant long-term opportunities for industry players.
Fertilizer Industry in Africa Segmentation
- 1. Production Analysis
- 2. Consumption Analysis
- 3. Import Market Analysis (Value & Volume)
- 4. Export Market Analysis (Value & Volume)
- 5. Price Trend Analysis
Fertilizer Industry in Africa Segmentation By Geography
-
1. North America
- 1.1. United States
- 1.2. Canada
- 1.3. Mexico
-
2. South America
- 2.1. Brazil
- 2.2. Argentina
- 2.3. Rest of South America
-
3. Europe
- 3.1. United Kingdom
- 3.2. Germany
- 3.3. France
- 3.4. Italy
- 3.5. Spain
- 3.6. Russia
- 3.7. Benelux
- 3.8. Nordics
- 3.9. Rest of Europe
-
4. Middle East & Africa
- 4.1. Turkey
- 4.2. Israel
- 4.3. GCC
- 4.4. North Africa
- 4.5. South Africa
- 4.6. Rest of Middle East & Africa
-
5. Asia Pacific
- 5.1. China
- 5.2. India
- 5.3. Japan
- 5.4. South Korea
- 5.5. ASEAN
- 5.6. Oceania
- 5.7. Rest of Asia Pacific
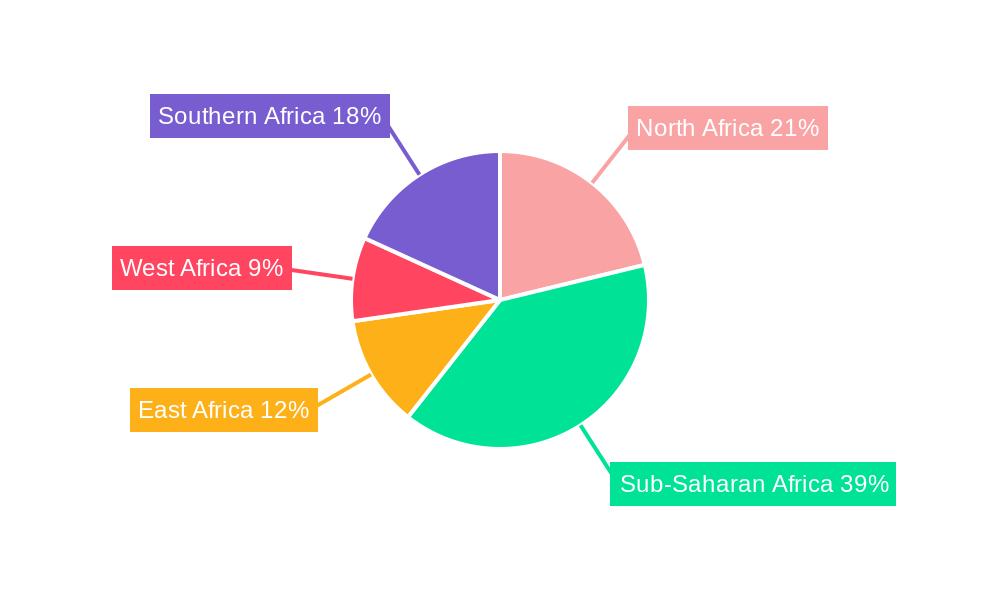
Fertilizer Industry in Africa Regional Market Share
Geographic Coverage of Fertilizer Industry in Africa
Fertilizer Industry in Africa REPORT HIGHLIGHTS
| Aspects | Details |
|---|---|
| Study Period | 2020-2034 |
| Base Year | 2025 |
| Estimated Year | 2026 |
| Forecast Period | 2026-2034 |
| Historical Period | 2020-2025 |
| Growth Rate | CAGR of 9.02% from 2020-2034 |
| Segmentation |
|
Table of Contents
- 1. Introduction
- 1.1. Research Scope
- 1.2. Market Segmentation
- 1.3. Research Objective
- 1.4. Definitions and Assumptions
- 2. Executive Summary
- 2.1. Market Snapshot
- 3. Market Dynamics
- 3.1. Market Drivers
- 3.2. Market Restrains
- 3.3. Market Trends
- 3.4. Market Opportunities
- 4. Market Factor Analysis
- 4.1. Porters Five Forces
- 4.1.1. Bargaining Power of Suppliers
- 4.1.2. Bargaining Power of Buyers
- 4.1.3. Threat of New Entrants
- 4.1.4. Threat of Substitutes
- 4.1.5. Competitive Rivalry
- 4.2. PESTEL analysis
- 4.3. BCG Analysis
- 4.3.1. Stars (High Growth, High Market Share)
- 4.3.2. Cash Cows (Low Growth, High Market Share)
- 4.3.3. Question Mark (High Growth, Low Market Share)
- 4.3.4. Dogs (Low Growth, Low Market Share)
- 4.4. Ansoff Matrix Analysis
- 4.5. Supply Chain Analysis
- 4.6. Regulatory Landscape
- 4.7. Current Market Potential and Opportunity Assessment (TAM–SAM–SOM Framework)
- 4.8. PRI Analyst Note
- 4.1. Porters Five Forces
- 5. Market Analysis, Insights and Forecast 2021-2033
- 5.1. Market Analysis, Insights and Forecast - by Production Analysis
- 5.2. Market Analysis, Insights and Forecast - by Consumption Analysis
- 5.3. Market Analysis, Insights and Forecast - by Import Market Analysis (Value & Volume)
- 5.4. Market Analysis, Insights and Forecast - by Export Market Analysis (Value & Volume)
- 5.5. Market Analysis, Insights and Forecast - by Price Trend Analysis
- 5.6. Market Analysis, Insights and Forecast - by Region
- 5.6.1. North America
- 5.6.2. South America
- 5.6.3. Europe
- 5.6.4. Middle East & Africa
- 5.6.5. Asia Pacific
- 6. Global Fertilizer Industry in Africa Analysis, Insights and Forecast, 2021-2033
- 6.1. Market Analysis, Insights and Forecast - by Production Analysis
- 6.2. Market Analysis, Insights and Forecast - by Consumption Analysis
- 6.3. Market Analysis, Insights and Forecast - by Import Market Analysis (Value & Volume)
- 6.4. Market Analysis, Insights and Forecast - by Export Market Analysis (Value & Volume)
- 6.5. Market Analysis, Insights and Forecast - by Price Trend Analysis
- 7. North America Fertilizer Industry in Africa Analysis, Insights and Forecast, 2020-2032
- 7.1. Market Analysis, Insights and Forecast - by Production Analysis
- 7.2. Market Analysis, Insights and Forecast - by Consumption Analysis
- 7.3. Market Analysis, Insights and Forecast - by Import Market Analysis (Value & Volume)
- 7.4. Market Analysis, Insights and Forecast - by Export Market Analysis (Value & Volume)
- 7.5. Market Analysis, Insights and Forecast - by Price Trend Analysis
- 8. South America Fertilizer Industry in Africa Analysis, Insights and Forecast, 2020-2032
- 8.1. Market Analysis, Insights and Forecast - by Production Analysis
- 8.2. Market Analysis, Insights and Forecast - by Consumption Analysis
- 8.3. Market Analysis, Insights and Forecast - by Import Market Analysis (Value & Volume)
- 8.4. Market Analysis, Insights and Forecast - by Export Market Analysis (Value & Volume)
- 8.5. Market Analysis, Insights and Forecast - by Price Trend Analysis
- 9. Europe Fertilizer Industry in Africa Analysis, Insights and Forecast, 2020-2032
- 9.1. Market Analysis, Insights and Forecast - by Production Analysis
- 9.2. Market Analysis, Insights and Forecast - by Consumption Analysis
- 9.3. Market Analysis, Insights and Forecast - by Import Market Analysis (Value & Volume)
- 9.4. Market Analysis, Insights and Forecast - by Export Market Analysis (Value & Volume)
- 9.5. Market Analysis, Insights and Forecast - by Price Trend Analysis
- 10. Middle East & Africa Fertilizer Industry in Africa Analysis, Insights and Forecast, 2020-2032
- 10.1. Market Analysis, Insights and Forecast - by Production Analysis
- 10.2. Market Analysis, Insights and Forecast - by Consumption Analysis
- 10.3. Market Analysis, Insights and Forecast - by Import Market Analysis (Value & Volume)
- 10.4. Market Analysis, Insights and Forecast - by Export Market Analysis (Value & Volume)
- 10.5. Market Analysis, Insights and Forecast - by Price Trend Analysis
- 11. Asia Pacific Fertilizer Industry in Africa Analysis, Insights and Forecast, 2020-2032
- 11.1. Market Analysis, Insights and Forecast - by Production Analysis
- 11.2. Market Analysis, Insights and Forecast - by Consumption Analysis
- 11.3. Market Analysis, Insights and Forecast - by Import Market Analysis (Value & Volume)
- 11.4. Market Analysis, Insights and Forecast - by Export Market Analysis (Value & Volume)
- 11.5. Market Analysis, Insights and Forecast - by Price Trend Analysis
- 12. Competitive Analysis
- 12.1. Company Profiles
- 12.1.1 Haifa Group
- 12.1.1.1. Company Overview
- 12.1.1.2. Products
- 12.1.1.3. Company Financials
- 12.1.1.4. SWOT Analysis
- 12.1.2 Foskor
- 12.1.2.1. Company Overview
- 12.1.2.2. Products
- 12.1.2.3. Company Financials
- 12.1.2.4. SWOT Analysis
- 12.1.3 Gavilon South Africa (MacroSource LLC)
- 12.1.3.1. Company Overview
- 12.1.3.2. Products
- 12.1.3.3. Company Financials
- 12.1.3.4. SWOT Analysis
- 12.1.4 K+S Aktiengesellschaft
- 12.1.4.1. Company Overview
- 12.1.4.2. Products
- 12.1.4.3. Company Financials
- 12.1.4.4. SWOT Analysis
- 12.1.5 Yara International AS
- 12.1.5.1. Company Overview
- 12.1.5.2. Products
- 12.1.5.3. Company Financials
- 12.1.5.4. SWOT Analysis
- 12.1.6 UPL Limited
- 12.1.6.1. Company Overview
- 12.1.6.2. Products
- 12.1.6.3. Company Financials
- 12.1.6.4. SWOT Analysis
- 12.1.7 ICL Group Ltd
- 12.1.7.1. Company Overview
- 12.1.7.2. Products
- 12.1.7.3. Company Financials
- 12.1.7.4. SWOT Analysis
- 12.1.8 Kynoch Fertilizer
- 12.1.8.1. Company Overview
- 12.1.8.2. Products
- 12.1.8.3. Company Financials
- 12.1.8.4. SWOT Analysis
- 12.1.1 Haifa Group
- 12.2. Market Entropy
- 12.2.1 Company's Key Areas Served
- 12.2.2 Recent Developments
- 12.3. Company Market Share Analysis 2025
- 12.3.1 Top 5 Companies Market Share Analysis
- 12.3.2 Top 3 Companies Market Share Analysis
- 12.4. List of Potential Customers
- 13. Research Methodology
List of Figures
- Figure 1: Global Fertilizer Industry in Africa Revenue Breakdown (Million, %) by Region 2025 & 2033
- Figure 2: North America Fertilizer Industry in Africa Revenue (Million), by Production Analysis 2025 & 2033
- Figure 3: North America Fertilizer Industry in Africa Revenue Share (%), by Production Analysis 2025 & 2033
- Figure 4: North America Fertilizer Industry in Africa Revenue (Million), by Consumption Analysis 2025 & 2033
- Figure 5: North America Fertilizer Industry in Africa Revenue Share (%), by Consumption Analysis 2025 & 2033
- Figure 6: North America Fertilizer Industry in Africa Revenue (Million), by Import Market Analysis (Value & Volume) 2025 & 2033
- Figure 7: North America Fertilizer Industry in Africa Revenue Share (%), by Import Market Analysis (Value & Volume) 2025 & 2033
- Figure 8: North America Fertilizer Industry in Africa Revenue (Million), by Export Market Analysis (Value & Volume) 2025 & 2033
- Figure 9: North America Fertilizer Industry in Africa Revenue Share (%), by Export Market Analysis (Value & Volume) 2025 & 2033
- Figure 10: North America Fertilizer Industry in Africa Revenue (Million), by Price Trend Analysis 2025 & 2033
- Figure 11: North America Fertilizer Industry in Africa Revenue Share (%), by Price Trend Analysis 2025 & 2033
- Figure 12: North America Fertilizer Industry in Africa Revenue (Million), by Country 2025 & 2033
- Figure 13: North America Fertilizer Industry in Africa Revenue Share (%), by Country 2025 & 2033
- Figure 14: South America Fertilizer Industry in Africa Revenue (Million), by Production Analysis 2025 & 2033
- Figure 15: South America Fertilizer Industry in Africa Revenue Share (%), by Production Analysis 2025 & 2033
- Figure 16: South America Fertilizer Industry in Africa Revenue (Million), by Consumption Analysis 2025 & 2033
- Figure 17: South America Fertilizer Industry in Africa Revenue Share (%), by Consumption Analysis 2025 & 2033
- Figure 18: South America Fertilizer Industry in Africa Revenue (Million), by Import Market Analysis (Value & Volume) 2025 & 2033
- Figure 19: South America Fertilizer Industry in Africa Revenue Share (%), by Import Market Analysis (Value & Volume) 2025 & 2033
- Figure 20: South America Fertilizer Industry in Africa Revenue (Million), by Export Market Analysis (Value & Volume) 2025 & 2033
- Figure 21: South America Fertilizer Industry in Africa Revenue Share (%), by Export Market Analysis (Value & Volume) 2025 & 2033
- Figure 22: South America Fertilizer Industry in Africa Revenue (Million), by Price Trend Analysis 2025 & 2033
- Figure 23: South America Fertilizer Industry in Africa Revenue Share (%), by Price Trend Analysis 2025 & 2033
- Figure 24: South America Fertilizer Industry in Africa Revenue (Million), by Country 2025 & 2033
- Figure 25: South America Fertilizer Industry in Africa Revenue Share (%), by Country 2025 & 2033
- Figure 26: Europe Fertilizer Industry in Africa Revenue (Million), by Production Analysis 2025 & 2033
- Figure 27: Europe Fertilizer Industry in Africa Revenue Share (%), by Production Analysis 2025 & 2033
- Figure 28: Europe Fertilizer Industry in Africa Revenue (Million), by Consumption Analysis 2025 & 2033
- Figure 29: Europe Fertilizer Industry in Africa Revenue Share (%), by Consumption Analysis 2025 & 2033
- Figure 30: Europe Fertilizer Industry in Africa Revenue (Million), by Import Market Analysis (Value & Volume) 2025 & 2033
- Figure 31: Europe Fertilizer Industry in Africa Revenue Share (%), by Import Market Analysis (Value & Volume) 2025 & 2033
- Figure 32: Europe Fertilizer Industry in Africa Revenue (Million), by Export Market Analysis (Value & Volume) 2025 & 2033
- Figure 33: Europe Fertilizer Industry in Africa Revenue Share (%), by Export Market Analysis (Value & Volume) 2025 & 2033
- Figure 34: Europe Fertilizer Industry in Africa Revenue (Million), by Price Trend Analysis 2025 & 2033
- Figure 35: Europe Fertilizer Industry in Africa Revenue Share (%), by Price Trend Analysis 2025 & 2033
- Figure 36: Europe Fertilizer Industry in Africa Revenue (Million), by Country 2025 & 2033
- Figure 37: Europe Fertilizer Industry in Africa Revenue Share (%), by Country 2025 & 2033
- Figure 38: Middle East & Africa Fertilizer Industry in Africa Revenue (Million), by Production Analysis 2025 & 2033
- Figure 39: Middle East & Africa Fertilizer Industry in Africa Revenue Share (%), by Production Analysis 2025 & 2033
- Figure 40: Middle East & Africa Fertilizer Industry in Africa Revenue (Million), by Consumption Analysis 2025 & 2033
- Figure 41: Middle East & Africa Fertilizer Industry in Africa Revenue Share (%), by Consumption Analysis 2025 & 2033
- Figure 42: Middle East & Africa Fertilizer Industry in Africa Revenue (Million), by Import Market Analysis (Value & Volume) 2025 & 2033
- Figure 43: Middle East & Africa Fertilizer Industry in Africa Revenue Share (%), by Import Market Analysis (Value & Volume) 2025 & 2033
- Figure 44: Middle East & Africa Fertilizer Industry in Africa Revenue (Million), by Export Market Analysis (Value & Volume) 2025 & 2033
- Figure 45: Middle East & Africa Fertilizer Industry in Africa Revenue Share (%), by Export Market Analysis (Value & Volume) 2025 & 2033
- Figure 46: Middle East & Africa Fertilizer Industry in Africa Revenue (Million), by Price Trend Analysis 2025 & 2033
- Figure 47: Middle East & Africa Fertilizer Industry in Africa Revenue Share (%), by Price Trend Analysis 2025 & 2033
- Figure 48: Middle East & Africa Fertilizer Industry in Africa Revenue (Million), by Country 2025 & 2033
- Figure 49: Middle East & Africa Fertilizer Industry in Africa Revenue Share (%), by Country 2025 & 2033
- Figure 50: Asia Pacific Fertilizer Industry in Africa Revenue (Million), by Production Analysis 2025 & 2033
- Figure 51: Asia Pacific Fertilizer Industry in Africa Revenue Share (%), by Production Analysis 2025 & 2033
- Figure 52: Asia Pacific Fertilizer Industry in Africa Revenue (Million), by Consumption Analysis 2025 & 2033
- Figure 53: Asia Pacific Fertilizer Industry in Africa Revenue Share (%), by Consumption Analysis 2025 & 2033
- Figure 54: Asia Pacific Fertilizer Industry in Africa Revenue (Million), by Import Market Analysis (Value & Volume) 2025 & 2033
- Figure 55: Asia Pacific Fertilizer Industry in Africa Revenue Share (%), by Import Market Analysis (Value & Volume) 2025 & 2033
- Figure 56: Asia Pacific Fertilizer Industry in Africa Revenue (Million), by Export Market Analysis (Value & Volume) 2025 & 2033
- Figure 57: Asia Pacific Fertilizer Industry in Africa Revenue Share (%), by Export Market Analysis (Value & Volume) 2025 & 2033
- Figure 58: Asia Pacific Fertilizer Industry in Africa Revenue (Million), by Price Trend Analysis 2025 & 2033
- Figure 59: Asia Pacific Fertilizer Industry in Africa Revenue Share (%), by Price Trend Analysis 2025 & 2033
- Figure 60: Asia Pacific Fertilizer Industry in Africa Revenue (Million), by Country 2025 & 2033
- Figure 61: Asia Pacific Fertilizer Industry in Africa Revenue Share (%), by Country 2025 & 2033
List of Tables
- Table 1: Global Fertilizer Industry in Africa Revenue Million Forecast, by Production Analysis 2020 & 2033
- Table 2: Global Fertilizer Industry in Africa Revenue Million Forecast, by Consumption Analysis 2020 & 2033
- Table 3: Global Fertilizer Industry in Africa Revenue Million Forecast, by Import Market Analysis (Value & Volume) 2020 & 2033
- Table 4: Global Fertilizer Industry in Africa Revenue Million Forecast, by Export Market Analysis (Value & Volume) 2020 & 2033
- Table 5: Global Fertilizer Industry in Africa Revenue Million Forecast, by Price Trend Analysis 2020 & 2033
- Table 6: Global Fertilizer Industry in Africa Revenue Million Forecast, by Region 2020 & 2033
- Table 7: Global Fertilizer Industry in Africa Revenue Million Forecast, by Production Analysis 2020 & 2033
- Table 8: Global Fertilizer Industry in Africa Revenue Million Forecast, by Consumption Analysis 2020 & 2033
- Table 9: Global Fertilizer Industry in Africa Revenue Million Forecast, by Import Market Analysis (Value & Volume) 2020 & 2033
- Table 10: Global Fertilizer Industry in Africa Revenue Million Forecast, by Export Market Analysis (Value & Volume) 2020 & 2033
- Table 11: Global Fertilizer Industry in Africa Revenue Million Forecast, by Price Trend Analysis 2020 & 2033
- Table 12: Global Fertilizer Industry in Africa Revenue Million Forecast, by Country 2020 & 2033
- Table 13: United States Fertilizer Industry in Africa Revenue (Million) Forecast, by Application 2020 & 2033
- Table 14: Canada Fertilizer Industry in Africa Revenue (Million) Forecast, by Application 2020 & 2033
- Table 15: Mexico Fertilizer Industry in Africa Revenue (Million) Forecast, by Application 2020 & 2033
- Table 16: Global Fertilizer Industry in Africa Revenue Million Forecast, by Production Analysis 2020 & 2033
- Table 17: Global Fertilizer Industry in Africa Revenue Million Forecast, by Consumption Analysis 2020 & 2033
- Table 18: Global Fertilizer Industry in Africa Revenue Million Forecast, by Import Market Analysis (Value & Volume) 2020 & 2033
- Table 19: Global Fertilizer Industry in Africa Revenue Million Forecast, by Export Market Analysis (Value & Volume) 2020 & 2033
- Table 20: Global Fertilizer Industry in Africa Revenue Million Forecast, by Price Trend Analysis 2020 & 2033
- Table 21: Global Fertilizer Industry in Africa Revenue Million Forecast, by Country 2020 & 2033
- Table 22: Brazil Fertilizer Industry in Africa Revenue (Million) Forecast, by Application 2020 & 2033
- Table 23: Argentina Fertilizer Industry in Africa Revenue (Million) Forecast, by Application 2020 & 2033
- Table 24: Rest of South America Fertilizer Industry in Africa Revenue (Million) Forecast, by Application 2020 & 2033
- Table 25: Global Fertilizer Industry in Africa Revenue Million Forecast, by Production Analysis 2020 & 2033
- Table 26: Global Fertilizer Industry in Africa Revenue Million Forecast, by Consumption Analysis 2020 & 2033
- Table 27: Global Fertilizer Industry in Africa Revenue Million Forecast, by Import Market Analysis (Value & Volume) 2020 & 2033
- Table 28: Global Fertilizer Industry in Africa Revenue Million Forecast, by Export Market Analysis (Value & Volume) 2020 & 2033
- Table 29: Global Fertilizer Industry in Africa Revenue Million Forecast, by Price Trend Analysis 2020 & 2033
- Table 30: Global Fertilizer Industry in Africa Revenue Million Forecast, by Country 2020 & 2033
- Table 31: United Kingdom Fertilizer Industry in Africa Revenue (Million) Forecast, by Application 2020 & 2033
- Table 32: Germany Fertilizer Industry in Africa Revenue (Million) Forecast, by Application 2020 & 2033
- Table 33: France Fertilizer Industry in Africa Revenue (Million) Forecast, by Application 2020 & 2033
- Table 34: Italy Fertilizer Industry in Africa Revenue (Million) Forecast, by Application 2020 & 2033
- Table 35: Spain Fertilizer Industry in Africa Revenue (Million) Forecast, by Application 2020 & 2033
- Table 36: Russia Fertilizer Industry in Africa Revenue (Million) Forecast, by Application 2020 & 2033
- Table 37: Benelux Fertilizer Industry in Africa Revenue (Million) Forecast, by Application 2020 & 2033
- Table 38: Nordics Fertilizer Industry in Africa Revenue (Million) Forecast, by Application 2020 & 2033
- Table 39: Rest of Europe Fertilizer Industry in Africa Revenue (Million) Forecast, by Application 2020 & 2033
- Table 40: Global Fertilizer Industry in Africa Revenue Million Forecast, by Production Analysis 2020 & 2033
- Table 41: Global Fertilizer Industry in Africa Revenue Million Forecast, by Consumption Analysis 2020 & 2033
- Table 42: Global Fertilizer Industry in Africa Revenue Million Forecast, by Import Market Analysis (Value & Volume) 2020 & 2033
- Table 43: Global Fertilizer Industry in Africa Revenue Million Forecast, by Export Market Analysis (Value & Volume) 2020 & 2033
- Table 44: Global Fertilizer Industry in Africa Revenue Million Forecast, by Price Trend Analysis 2020 & 2033
- Table 45: Global Fertilizer Industry in Africa Revenue Million Forecast, by Country 2020 & 2033
- Table 46: Turkey Fertilizer Industry in Africa Revenue (Million) Forecast, by Application 2020 & 2033
- Table 47: Israel Fertilizer Industry in Africa Revenue (Million) Forecast, by Application 2020 & 2033
- Table 48: GCC Fertilizer Industry in Africa Revenue (Million) Forecast, by Application 2020 & 2033
- Table 49: North Africa Fertilizer Industry in Africa Revenue (Million) Forecast, by Application 2020 & 2033
- Table 50: South Africa Fertilizer Industry in Africa Revenue (Million) Forecast, by Application 2020 & 2033
- Table 51: Rest of Middle East & Africa Fertilizer Industry in Africa Revenue (Million) Forecast, by Application 2020 & 2033
- Table 52: Global Fertilizer Industry in Africa Revenue Million Forecast, by Production Analysis 2020 & 2033
- Table 53: Global Fertilizer Industry in Africa Revenue Million Forecast, by Consumption Analysis 2020 & 2033
- Table 54: Global Fertilizer Industry in Africa Revenue Million Forecast, by Import Market Analysis (Value & Volume) 2020 & 2033
- Table 55: Global Fertilizer Industry in Africa Revenue Million Forecast, by Export Market Analysis (Value & Volume) 2020 & 2033
- Table 56: Global Fertilizer Industry in Africa Revenue Million Forecast, by Price Trend Analysis 2020 & 2033
- Table 57: Global Fertilizer Industry in Africa Revenue Million Forecast, by Country 2020 & 2033
- Table 58: China Fertilizer Industry in Africa Revenue (Million) Forecast, by Application 2020 & 2033
- Table 59: India Fertilizer Industry in Africa Revenue (Million) Forecast, by Application 2020 & 2033
- Table 60: Japan Fertilizer Industry in Africa Revenue (Million) Forecast, by Application 2020 & 2033
- Table 61: South Korea Fertilizer Industry in Africa Revenue (Million) Forecast, by Application 2020 & 2033
- Table 62: ASEAN Fertilizer Industry in Africa Revenue (Million) Forecast, by Application 2020 & 2033
- Table 63: Oceania Fertilizer Industry in Africa Revenue (Million) Forecast, by Application 2020 & 2033
- Table 64: Rest of Asia Pacific Fertilizer Industry in Africa Revenue (Million) Forecast, by Application 2020 & 2033
Frequently Asked Questions
1. What is the projected Compound Annual Growth Rate (CAGR) of the Fertilizer Industry in Africa?
The projected CAGR is approximately 9.02%.
2. Which companies are prominent players in the Fertilizer Industry in Africa?
Key companies in the market include Haifa Group, Foskor, Gavilon South Africa (MacroSource LLC), K+S Aktiengesellschaft, Yara International AS, UPL Limited, ICL Group Ltd, Kynoch Fertilizer.
3. What are the main segments of the Fertilizer Industry in Africa?
The market segments include Production Analysis, Consumption Analysis, Import Market Analysis (Value & Volume), Export Market Analysis (Value & Volume), Price Trend Analysis.
4. Can you provide details about the market size?
The market size is estimated to be USD XX Million as of 2022.
5. What are some drivers contributing to market growth?
Need for Custom Product Development; Use of CROs for Regulatory Services.
6. What are the notable trends driving market growth?
OTHER KEY INDUSTRY TRENDS COVERED IN THE REPORT.
7. Are there any restraints impacting market growth?
Data and Cyber Security Concerns; Lack of Experts and Professionals in this Industry.
8. Can you provide examples of recent developments in the market?
April 2023: K+S has acquired a 75% share of the fertilizer business of South African trading company Industrial Commodities Holdings (Pty) Ltd (ICH). In addition to expanding the core business, K+S is strengthening its operations in southern and eastern Africa as a result of this acquisition. The newly acquired fertilizer business in the future to be operated in a joint venture, under the name of FertivPty Ltd.January 2023: ICL has entered into a strategic partnership agreement with General Mills, in which it will be the supplier of strategic specialty phosphate solutions to General Mills. The long-term agreement will also focus on international expansion.May 2022: ICL launched three new NPK formulations of Solinure, a product with increased trace elements to optimize yields.
9. What pricing options are available for accessing the report?
Pricing options include single-user, multi-user, and enterprise licenses priced at USD 3800, USD 4500, and USD 5800 respectively.
10. Is the market size provided in terms of value or volume?
The market size is provided in terms of value, measured in Million.
11. Are there any specific market keywords associated with the report?
Yes, the market keyword associated with the report is "Fertilizer Industry in Africa," which aids in identifying and referencing the specific market segment covered.
12. How do I determine which pricing option suits my needs best?
The pricing options vary based on user requirements and access needs. Individual users may opt for single-user licenses, while businesses requiring broader access may choose multi-user or enterprise licenses for cost-effective access to the report.
13. Are there any additional resources or data provided in the Fertilizer Industry in Africa report?
While the report offers comprehensive insights, it's advisable to review the specific contents or supplementary materials provided to ascertain if additional resources or data are available.
14. How can I stay updated on further developments or reports in the Fertilizer Industry in Africa?
To stay informed about further developments, trends, and reports in the Fertilizer Industry in Africa, consider subscribing to industry newsletters, following relevant companies and organizations, or regularly checking reputable industry news sources and publications.
Methodology
Step 1 - Identification of Relevant Samples Size from Population Database


Step 2 - Approaches for Defining Global Market Size (Value, Volume* & Price*)

Note*: In applicable scenarios
Step 3 - Data Sources
Primary Research
- Web Analytics
- Survey Reports
- Research Institute
- Latest Research Reports
- Opinion Leaders
Secondary Research
- Annual Reports
- White Paper
- Latest Press Release
- Industry Association
- Paid Database
- Investor Presentations

Step 4 - Data Triangulation
Involves using different sources of information in order to increase the validity of a study
These sources are likely to be stakeholders in a program - participants, other researchers, program staff, other community members, and so on.
Then we put all data in single framework & apply various statistical tools to find out the dynamic on the market.
During the analysis stage, feedback from the stakeholder groups would be compared to determine areas of agreement as well as areas of divergence