

Key Insights
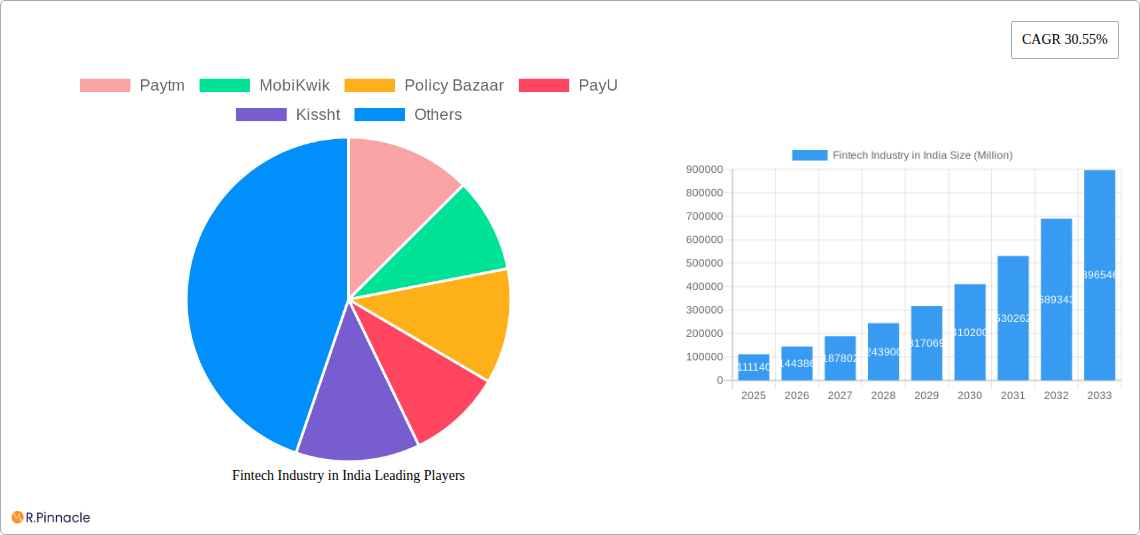
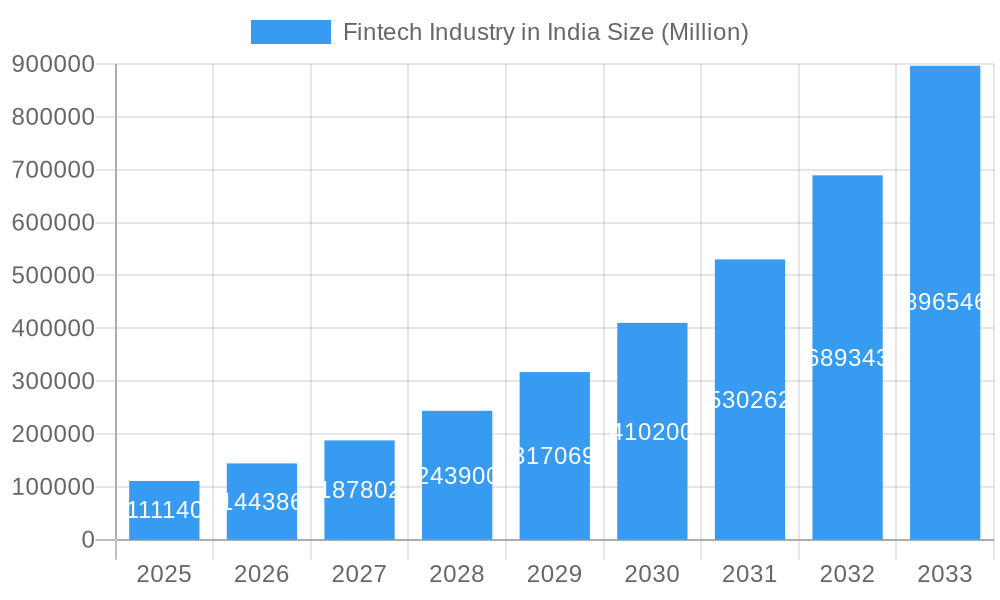
The Indian Fintech market, valued at $111.14 billion in 2025, is experiencing explosive growth, projected to expand at a Compound Annual Growth Rate (CAGR) of 30.55% from 2025 to 2033. This phenomenal rise is fueled by several key drivers. India's burgeoning digital economy, driven by increasing smartphone penetration and internet access, provides a fertile ground for Fintech innovation. Government initiatives promoting digital payments and financial inclusion further accelerate this growth. The rising adoption of mobile wallets, UPI-based payments, and online lending platforms significantly contributes to the market expansion. Furthermore, a young and tech-savvy population readily embraces digital financial solutions, creating a massive user base for Fintech services. Competitive pressures among established players like Paytm, PhonePe, PolicyBazaar, and emerging startups foster innovation and drive down costs, making financial services more accessible to a wider population. While challenges remain, such as concerns around data security and financial literacy, the overall market trajectory indicates a bright future for the Indian Fintech sector.
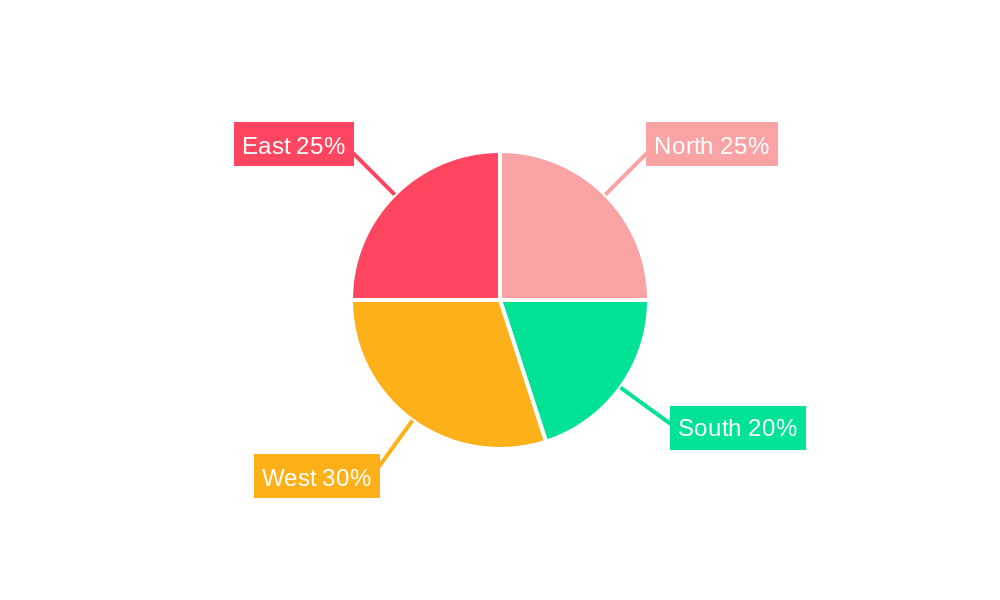
Fintech Industry in India Market Size (In Billion)
The segmentation within the Indian Fintech market is diverse, encompassing payments, lending, investment, and insurance technology. The payments segment dominates, with players like Paytm and PhonePe leading the charge. The lending segment, while facing regulatory scrutiny, is experiencing significant growth driven by the demand for personal and business loans. Investment platforms are also witnessing increased adoption, as more Indians invest in mutual funds and stocks through digital channels. Insurance technology is also a rapidly growing segment, with platforms enabling easier access to insurance products. The regional distribution of the market likely reflects the uneven distribution of digital literacy and infrastructure across India. Future growth will depend on continued infrastructure development, improving digital literacy, and addressing regulatory concerns to ensure sustainable and inclusive growth. The forecast period suggests significant market expansion, potentially surpassing several trillion dollars by 2033, depending on continued positive trends.
Fintech Industry in India Company Market Share
Fintech Industry in India: A Comprehensive Market Report (2019-2033)
This in-depth report provides a comprehensive analysis of the burgeoning Fintech industry in India, covering the period 2019-2033, with a focus on 2025. Discover key market trends, growth drivers, challenges, and opportunities for success in this dynamic sector. This report is essential for investors, entrepreneurs, and industry professionals seeking actionable insights into India's rapidly evolving Fintech landscape.
Fintech Industry in India Market Structure & Innovation Trends
This section analyzes the Indian Fintech market's structure, encompassing market concentration, innovation drivers, regulatory frameworks, product substitutes, end-user demographics, and M&A activities. The Indian Fintech market is characterized by a blend of established players and disruptive startups, resulting in a moderately concentrated market. While precise market share figures for each player fluctuate, Paytm and PhonePe hold significant market share in payments, with others like MobiKwik and PayU vying for position. The total market size in 2025 is estimated at xx Million USD.
- Market Concentration: Moderately concentrated, with Paytm and PhonePe leading the payments segment.
- Innovation Drivers: Government initiatives promoting digitalization, increasing smartphone penetration, and a young, tech-savvy population.
- Regulatory Framework: The Reserve Bank of India (RBI) plays a crucial role, with regulations impacting licensing, data security, and compliance.
- Product Substitutes: Traditional banking services and alternative lending platforms pose competitive threats.
- End-User Demographics: Primarily driven by the young, digitally active population in urban and semi-urban areas.
- M&A Activities: Significant M&A activity, with deals like the CreditVidya acquisition by CRED in November 2022 illustrating industry consolidation. The value of such deals varies widely, with some exceeding xx Million USD, while others remain undisclosed.
Fintech Industry in India Market Dynamics & Trends
This section delves into the market dynamics, focusing on growth drivers, technological disruptions, consumer preferences, and competitive dynamics. The Indian Fintech market exhibits robust growth, driven by factors such as increasing smartphone and internet penetration, rising digital literacy, and favorable government policies. The Compound Annual Growth Rate (CAGR) for the forecast period (2025-2033) is projected at xx%, with market penetration steadily increasing across various segments. Technological advancements like AI, blockchain, and big data analytics are disrupting traditional financial models. Consumers increasingly prefer convenient, accessible, and personalized financial services, fueling the demand for Fintech solutions. The competitive landscape is highly dynamic, with constant innovation and strategic partnerships shaping market dynamics.
Dominant Regions & Segments in Fintech Industry in India
This section identifies dominant regions and segments within the Indian Fintech market. While the market is growing across India, urban areas and major metropolitan centers exhibit higher adoption rates. The payments and lending segments are currently the most dominant, followed by wealth management and insurance technology.
- Key Drivers of Dominance:
- Urban Areas: Higher internet and smartphone penetration, digital literacy, and a larger pool of potential customers.
- Payments Segment: High transaction volumes, driven by increasing digital transactions and mobile wallet usage.
- Lending Segment: Growing demand for credit among individuals and small businesses, facilitated by Fintech platforms.
The dominance of these areas is expected to continue throughout the forecast period, though expansion into rural areas is projected to increase gradually.
Fintech Industry in India Product Innovations
Recent product innovations include advancements in mobile payment systems, AI-powered lending platforms, robo-advisors for wealth management, and insurance technology solutions. These innovations offer improved customer experience, increased efficiency, and enhanced financial inclusion. The competitive advantage stems from leveraging technological trends to meet evolving market needs and offer unique value propositions.
Report Scope & Segmentation Analysis
This report segments the Indian Fintech market by product type (payments, lending, wealth management, insurance tech), deployment mode (mobile, web), and end-user (individuals, businesses). Growth projections for each segment vary based on factors such as market maturity and technological advancements. Market sizes are estimated in Million USD, considering historical data and projected growth rates. Competitive dynamics within each segment are assessed, highlighting key players and their strategic positioning.
Key Drivers of Fintech Industry in India Growth
The growth of India's Fintech sector is driven by several key factors:
- Government Initiatives: Digital India and other government programs are boosting digital adoption.
- Technological Advancements: AI, machine learning, and blockchain are revolutionizing financial services.
- Rising Smartphone Penetration: Increased mobile access fuels the adoption of Fintech apps.
- Favorable Regulatory Environment: A supportive regulatory environment, while still evolving, encourages innovation.
Challenges in the Fintech Industry in India Sector
Challenges facing the Indian Fintech sector include:
- Regulatory Uncertainty: Evolving regulations can create uncertainty and compliance issues.
- Cybersecurity Risks: Data breaches and fraud pose significant threats.
- Digital Divide: Unequal access to technology in rural areas limits market penetration.
- Competition: Intense competition necessitates continuous innovation and differentiation.
Emerging Opportunities in Fintech Industry in India
Emerging opportunities include:
- Expansion into Underserved Markets: Reaching rural populations and providing financial services to the unbanked.
- Open Banking: Leveraging open banking APIs to offer innovative financial products and services.
- Embedded Finance: Integrating financial services into non-financial platforms and applications.
- Growth in Fintech Infrastructure: Investment in infrastructure will further support the sector’s growth.
Key Developments in Fintech Industry in India Industry
- September 2023: PayU partnered with WhatsApp to enhance the Indian purchasing experience.
- November 2022: CreditVidya, a Hyderabad-based SaaS company, was acquired by CRED.
Future Outlook for Fintech Industry in India Market
The Indian Fintech market is poised for significant growth in the coming years. Continued digitalization, favorable government policies, and technological advancements will drive market expansion. Strategic partnerships, innovative product development, and effective risk management will be crucial for success in this dynamic and competitive landscape. The total market value is expected to reach xx Million USD by 2033.
Fintech Industry in India Segmentation
-
1. Service Proposition
- 1.1. Money Transfer and Payments
- 1.2. Savings and Investments
- 1.3. Digital Lending and Lending Marketplaces
- 1.4. Online Insurance and Insurance Marketplaces
-
2. Application
- 2.1. E-Commerce
- 2.2. Utilities
- 2.3. Travel
Fintech Industry in India Segmentation By Geography
-
1. North America
- 1.1. United States
- 1.2. Canada
- 1.3. Mexico
-
2. South America
- 2.1. Brazil
- 2.2. Argentina
- 2.3. Rest of South America
-
3. Europe
- 3.1. United Kingdom
- 3.2. Germany
- 3.3. France
- 3.4. Italy
- 3.5. Spain
- 3.6. Russia
- 3.7. Benelux
- 3.8. Nordics
- 3.9. Rest of Europe
-
4. Middle East & Africa
- 4.1. Turkey
- 4.2. Israel
- 4.3. GCC
- 4.4. North Africa
- 4.5. South Africa
- 4.6. Rest of Middle East & Africa
-
5. Asia Pacific
- 5.1. China
- 5.2. India
- 5.3. Japan
- 5.4. South Korea
- 5.5. ASEAN
- 5.6. Oceania
- 5.7. Rest of Asia Pacific
Fintech Industry in India Regional Market Share
Geographic Coverage of Fintech Industry in India
Fintech Industry in India REPORT HIGHLIGHTS
| Aspects | Details |
|---|---|
| Study Period | 2020-2034 |
| Base Year | 2025 |
| Estimated Year | 2026 |
| Forecast Period | 2026-2034 |
| Historical Period | 2020-2025 |
| Growth Rate | CAGR of 30.55% from 2020-2034 |
| Segmentation |
|
Table of Contents
- 1. Introduction
- 1.1. Research Scope
- 1.2. Market Segmentation
- 1.3. Research Objective
- 1.4. Definitions and Assumptions
- 2. Executive Summary
- 2.1. Market Snapshot
- 3. Market Dynamics
- 3.1. Market Drivers
- 3.2. Market Restrains
- 3.3. Market Trends
- 3.4. Market Opportunities
- 4. Market Factor Analysis
- 4.1. Porters Five Forces
- 4.1.1. Bargaining Power of Suppliers
- 4.1.2. Bargaining Power of Buyers
- 4.1.3. Threat of New Entrants
- 4.1.4. Threat of Substitutes
- 4.1.5. Competitive Rivalry
- 4.2. PESTEL analysis
- 4.3. BCG Analysis
- 4.3.1. Stars (High Growth, High Market Share)
- 4.3.2. Cash Cows (Low Growth, High Market Share)
- 4.3.3. Question Mark (High Growth, Low Market Share)
- 4.3.4. Dogs (Low Growth, Low Market Share)
- 4.4. Ansoff Matrix Analysis
- 4.5. Supply Chain Analysis
- 4.6. Regulatory Landscape
- 4.7. Current Market Potential and Opportunity Assessment (TAM–SAM–SOM Framework)
- 4.8. PRI Analyst Note
- 4.1. Porters Five Forces
- 5. Market Analysis, Insights and Forecast 2021-2033
- 5.1. Market Analysis, Insights and Forecast - by Service Proposition
- 5.1.1. Money Transfer and Payments
- 5.1.2. Savings and Investments
- 5.1.3. Digital Lending and Lending Marketplaces
- 5.1.4. Online Insurance and Insurance Marketplaces
- 5.2. Market Analysis, Insights and Forecast - by Application
- 5.2.1. E-Commerce
- 5.2.2. Utilities
- 5.2.3. Travel
- 5.3. Market Analysis, Insights and Forecast - by Region
- 5.3.1. North America
- 5.3.2. South America
- 5.3.3. Europe
- 5.3.4. Middle East & Africa
- 5.3.5. Asia Pacific
- 5.1. Market Analysis, Insights and Forecast - by Service Proposition
- 6. Global Fintech Industry in India Analysis, Insights and Forecast, 2021-2033
- 6.1. Market Analysis, Insights and Forecast - by Service Proposition
- 6.1.1. Money Transfer and Payments
- 6.1.2. Savings and Investments
- 6.1.3. Digital Lending and Lending Marketplaces
- 6.1.4. Online Insurance and Insurance Marketplaces
- 6.2. Market Analysis, Insights and Forecast - by Application
- 6.2.1. E-Commerce
- 6.2.2. Utilities
- 6.2.3. Travel
- 6.1. Market Analysis, Insights and Forecast - by Service Proposition
- 7. North America Fintech Industry in India Analysis, Insights and Forecast, 2020-2032
- 7.1. Market Analysis, Insights and Forecast - by Service Proposition
- 7.1.1. Money Transfer and Payments
- 7.1.2. Savings and Investments
- 7.1.3. Digital Lending and Lending Marketplaces
- 7.1.4. Online Insurance and Insurance Marketplaces
- 7.2. Market Analysis, Insights and Forecast - by Application
- 7.2.1. E-Commerce
- 7.2.2. Utilities
- 7.2.3. Travel
- 7.1. Market Analysis, Insights and Forecast - by Service Proposition
- 8. South America Fintech Industry in India Analysis, Insights and Forecast, 2020-2032
- 8.1. Market Analysis, Insights and Forecast - by Service Proposition
- 8.1.1. Money Transfer and Payments
- 8.1.2. Savings and Investments
- 8.1.3. Digital Lending and Lending Marketplaces
- 8.1.4. Online Insurance and Insurance Marketplaces
- 8.2. Market Analysis, Insights and Forecast - by Application
- 8.2.1. E-Commerce
- 8.2.2. Utilities
- 8.2.3. Travel
- 8.1. Market Analysis, Insights and Forecast - by Service Proposition
- 9. Europe Fintech Industry in India Analysis, Insights and Forecast, 2020-2032
- 9.1. Market Analysis, Insights and Forecast - by Service Proposition
- 9.1.1. Money Transfer and Payments
- 9.1.2. Savings and Investments
- 9.1.3. Digital Lending and Lending Marketplaces
- 9.1.4. Online Insurance and Insurance Marketplaces
- 9.2. Market Analysis, Insights and Forecast - by Application
- 9.2.1. E-Commerce
- 9.2.2. Utilities
- 9.2.3. Travel
- 9.1. Market Analysis, Insights and Forecast - by Service Proposition
- 10. Middle East & Africa Fintech Industry in India Analysis, Insights and Forecast, 2020-2032
- 10.1. Market Analysis, Insights and Forecast - by Service Proposition
- 10.1.1. Money Transfer and Payments
- 10.1.2. Savings and Investments
- 10.1.3. Digital Lending and Lending Marketplaces
- 10.1.4. Online Insurance and Insurance Marketplaces
- 10.2. Market Analysis, Insights and Forecast - by Application
- 10.2.1. E-Commerce
- 10.2.2. Utilities
- 10.2.3. Travel
- 10.1. Market Analysis, Insights and Forecast - by Service Proposition
- 11. Asia Pacific Fintech Industry in India Analysis, Insights and Forecast, 2020-2032
- 11.1. Market Analysis, Insights and Forecast - by Service Proposition
- 11.1.1. Money Transfer and Payments
- 11.1.2. Savings and Investments
- 11.1.3. Digital Lending and Lending Marketplaces
- 11.1.4. Online Insurance and Insurance Marketplaces
- 11.2. Market Analysis, Insights and Forecast - by Application
- 11.2.1. E-Commerce
- 11.2.2. Utilities
- 11.2.3. Travel
- 11.1. Market Analysis, Insights and Forecast - by Service Proposition
- 12. Competitive Analysis
- 12.1. Company Profiles
- 12.1.1 Paytm
- 12.1.1.1. Company Overview
- 12.1.1.2. Products
- 12.1.1.3. Company Financials
- 12.1.1.4. SWOT Analysis
- 12.1.2 MobiKwik
- 12.1.2.1. Company Overview
- 12.1.2.2. Products
- 12.1.2.3. Company Financials
- 12.1.2.4. SWOT Analysis
- 12.1.3 Policy Bazaar
- 12.1.3.1. Company Overview
- 12.1.3.2. Products
- 12.1.3.3. Company Financials
- 12.1.3.4. SWOT Analysis
- 12.1.4 PayU
- 12.1.4.1. Company Overview
- 12.1.4.2. Products
- 12.1.4.3. Company Financials
- 12.1.4.4. SWOT Analysis
- 12.1.5 Kissht
- 12.1.5.1. Company Overview
- 12.1.5.2. Products
- 12.1.5.3. Company Financials
- 12.1.5.4. SWOT Analysis
- 12.1.6 Shubh Loans
- 12.1.6.1. Company Overview
- 12.1.6.2. Products
- 12.1.6.3. Company Financials
- 12.1.6.4. SWOT Analysis
- 12.1.7 Lending Kart
- 12.1.7.1. Company Overview
- 12.1.7.2. Products
- 12.1.7.3. Company Financials
- 12.1.7.4. SWOT Analysis
- 12.1.8 Phonepe
- 12.1.8.1. Company Overview
- 12.1.8.2. Products
- 12.1.8.3. Company Financials
- 12.1.8.4. SWOT Analysis
- 12.1.9 Faircent
- 12.1.9.1. Company Overview
- 12.1.9.2. Products
- 12.1.9.3. Company Financials
- 12.1.9.4. SWOT Analysis
- 12.1.10 ET money**List Not Exhaustive
- 12.1.10.1. Company Overview
- 12.1.10.2. Products
- 12.1.10.3. Company Financials
- 12.1.10.4. SWOT Analysis
- 12.1.1 Paytm
- 12.2. Market Entropy
- 12.2.1 Company's Key Areas Served
- 12.2.2 Recent Developments
- 12.3. Company Market Share Analysis 2025
- 12.3.1 Top 5 Companies Market Share Analysis
- 12.3.2 Top 3 Companies Market Share Analysis
- 12.4. List of Potential Customers
- 13. Research Methodology
List of Figures
- Figure 1: Global Fintech Industry in India Revenue Breakdown (Million, %) by Region 2025 & 2033
- Figure 2: Global Fintech Industry in India Volume Breakdown (Billion, %) by Region 2025 & 2033
- Figure 3: North America Fintech Industry in India Revenue (Million), by Service Proposition 2025 & 2033
- Figure 4: North America Fintech Industry in India Volume (Billion), by Service Proposition 2025 & 2033
- Figure 5: North America Fintech Industry in India Revenue Share (%), by Service Proposition 2025 & 2033
- Figure 6: North America Fintech Industry in India Volume Share (%), by Service Proposition 2025 & 2033
- Figure 7: North America Fintech Industry in India Revenue (Million), by Application 2025 & 2033
- Figure 8: North America Fintech Industry in India Volume (Billion), by Application 2025 & 2033
- Figure 9: North America Fintech Industry in India Revenue Share (%), by Application 2025 & 2033
- Figure 10: North America Fintech Industry in India Volume Share (%), by Application 2025 & 2033
- Figure 11: North America Fintech Industry in India Revenue (Million), by Country 2025 & 2033
- Figure 12: North America Fintech Industry in India Volume (Billion), by Country 2025 & 2033
- Figure 13: North America Fintech Industry in India Revenue Share (%), by Country 2025 & 2033
- Figure 14: North America Fintech Industry in India Volume Share (%), by Country 2025 & 2033
- Figure 15: South America Fintech Industry in India Revenue (Million), by Service Proposition 2025 & 2033
- Figure 16: South America Fintech Industry in India Volume (Billion), by Service Proposition 2025 & 2033
- Figure 17: South America Fintech Industry in India Revenue Share (%), by Service Proposition 2025 & 2033
- Figure 18: South America Fintech Industry in India Volume Share (%), by Service Proposition 2025 & 2033
- Figure 19: South America Fintech Industry in India Revenue (Million), by Application 2025 & 2033
- Figure 20: South America Fintech Industry in India Volume (Billion), by Application 2025 & 2033
- Figure 21: South America Fintech Industry in India Revenue Share (%), by Application 2025 & 2033
- Figure 22: South America Fintech Industry in India Volume Share (%), by Application 2025 & 2033
- Figure 23: South America Fintech Industry in India Revenue (Million), by Country 2025 & 2033
- Figure 24: South America Fintech Industry in India Volume (Billion), by Country 2025 & 2033
- Figure 25: South America Fintech Industry in India Revenue Share (%), by Country 2025 & 2033
- Figure 26: South America Fintech Industry in India Volume Share (%), by Country 2025 & 2033
- Figure 27: Europe Fintech Industry in India Revenue (Million), by Service Proposition 2025 & 2033
- Figure 28: Europe Fintech Industry in India Volume (Billion), by Service Proposition 2025 & 2033
- Figure 29: Europe Fintech Industry in India Revenue Share (%), by Service Proposition 2025 & 2033
- Figure 30: Europe Fintech Industry in India Volume Share (%), by Service Proposition 2025 & 2033
- Figure 31: Europe Fintech Industry in India Revenue (Million), by Application 2025 & 2033
- Figure 32: Europe Fintech Industry in India Volume (Billion), by Application 2025 & 2033
- Figure 33: Europe Fintech Industry in India Revenue Share (%), by Application 2025 & 2033
- Figure 34: Europe Fintech Industry in India Volume Share (%), by Application 2025 & 2033
- Figure 35: Europe Fintech Industry in India Revenue (Million), by Country 2025 & 2033
- Figure 36: Europe Fintech Industry in India Volume (Billion), by Country 2025 & 2033
- Figure 37: Europe Fintech Industry in India Revenue Share (%), by Country 2025 & 2033
- Figure 38: Europe Fintech Industry in India Volume Share (%), by Country 2025 & 2033
- Figure 39: Middle East & Africa Fintech Industry in India Revenue (Million), by Service Proposition 2025 & 2033
- Figure 40: Middle East & Africa Fintech Industry in India Volume (Billion), by Service Proposition 2025 & 2033
- Figure 41: Middle East & Africa Fintech Industry in India Revenue Share (%), by Service Proposition 2025 & 2033
- Figure 42: Middle East & Africa Fintech Industry in India Volume Share (%), by Service Proposition 2025 & 2033
- Figure 43: Middle East & Africa Fintech Industry in India Revenue (Million), by Application 2025 & 2033
- Figure 44: Middle East & Africa Fintech Industry in India Volume (Billion), by Application 2025 & 2033
- Figure 45: Middle East & Africa Fintech Industry in India Revenue Share (%), by Application 2025 & 2033
- Figure 46: Middle East & Africa Fintech Industry in India Volume Share (%), by Application 2025 & 2033
- Figure 47: Middle East & Africa Fintech Industry in India Revenue (Million), by Country 2025 & 2033
- Figure 48: Middle East & Africa Fintech Industry in India Volume (Billion), by Country 2025 & 2033
- Figure 49: Middle East & Africa Fintech Industry in India Revenue Share (%), by Country 2025 & 2033
- Figure 50: Middle East & Africa Fintech Industry in India Volume Share (%), by Country 2025 & 2033
- Figure 51: Asia Pacific Fintech Industry in India Revenue (Million), by Service Proposition 2025 & 2033
- Figure 52: Asia Pacific Fintech Industry in India Volume (Billion), by Service Proposition 2025 & 2033
- Figure 53: Asia Pacific Fintech Industry in India Revenue Share (%), by Service Proposition 2025 & 2033
- Figure 54: Asia Pacific Fintech Industry in India Volume Share (%), by Service Proposition 2025 & 2033
- Figure 55: Asia Pacific Fintech Industry in India Revenue (Million), by Application 2025 & 2033
- Figure 56: Asia Pacific Fintech Industry in India Volume (Billion), by Application 2025 & 2033
- Figure 57: Asia Pacific Fintech Industry in India Revenue Share (%), by Application 2025 & 2033
- Figure 58: Asia Pacific Fintech Industry in India Volume Share (%), by Application 2025 & 2033
- Figure 59: Asia Pacific Fintech Industry in India Revenue (Million), by Country 2025 & 2033
- Figure 60: Asia Pacific Fintech Industry in India Volume (Billion), by Country 2025 & 2033
- Figure 61: Asia Pacific Fintech Industry in India Revenue Share (%), by Country 2025 & 2033
- Figure 62: Asia Pacific Fintech Industry in India Volume Share (%), by Country 2025 & 2033
List of Tables
- Table 1: Global Fintech Industry in India Revenue Million Forecast, by Service Proposition 2020 & 2033
- Table 2: Global Fintech Industry in India Volume Billion Forecast, by Service Proposition 2020 & 2033
- Table 3: Global Fintech Industry in India Revenue Million Forecast, by Application 2020 & 2033
- Table 4: Global Fintech Industry in India Volume Billion Forecast, by Application 2020 & 2033
- Table 5: Global Fintech Industry in India Revenue Million Forecast, by Region 2020 & 2033
- Table 6: Global Fintech Industry in India Volume Billion Forecast, by Region 2020 & 2033
- Table 7: Global Fintech Industry in India Revenue Million Forecast, by Service Proposition 2020 & 2033
- Table 8: Global Fintech Industry in India Volume Billion Forecast, by Service Proposition 2020 & 2033
- Table 9: Global Fintech Industry in India Revenue Million Forecast, by Application 2020 & 2033
- Table 10: Global Fintech Industry in India Volume Billion Forecast, by Application 2020 & 2033
- Table 11: Global Fintech Industry in India Revenue Million Forecast, by Country 2020 & 2033
- Table 12: Global Fintech Industry in India Volume Billion Forecast, by Country 2020 & 2033
- Table 13: United States Fintech Industry in India Revenue (Million) Forecast, by Application 2020 & 2033
- Table 14: United States Fintech Industry in India Volume (Billion) Forecast, by Application 2020 & 2033
- Table 15: Canada Fintech Industry in India Revenue (Million) Forecast, by Application 2020 & 2033
- Table 16: Canada Fintech Industry in India Volume (Billion) Forecast, by Application 2020 & 2033
- Table 17: Mexico Fintech Industry in India Revenue (Million) Forecast, by Application 2020 & 2033
- Table 18: Mexico Fintech Industry in India Volume (Billion) Forecast, by Application 2020 & 2033
- Table 19: Global Fintech Industry in India Revenue Million Forecast, by Service Proposition 2020 & 2033
- Table 20: Global Fintech Industry in India Volume Billion Forecast, by Service Proposition 2020 & 2033
- Table 21: Global Fintech Industry in India Revenue Million Forecast, by Application 2020 & 2033
- Table 22: Global Fintech Industry in India Volume Billion Forecast, by Application 2020 & 2033
- Table 23: Global Fintech Industry in India Revenue Million Forecast, by Country 2020 & 2033
- Table 24: Global Fintech Industry in India Volume Billion Forecast, by Country 2020 & 2033
- Table 25: Brazil Fintech Industry in India Revenue (Million) Forecast, by Application 2020 & 2033
- Table 26: Brazil Fintech Industry in India Volume (Billion) Forecast, by Application 2020 & 2033
- Table 27: Argentina Fintech Industry in India Revenue (Million) Forecast, by Application 2020 & 2033
- Table 28: Argentina Fintech Industry in India Volume (Billion) Forecast, by Application 2020 & 2033
- Table 29: Rest of South America Fintech Industry in India Revenue (Million) Forecast, by Application 2020 & 2033
- Table 30: Rest of South America Fintech Industry in India Volume (Billion) Forecast, by Application 2020 & 2033
- Table 31: Global Fintech Industry in India Revenue Million Forecast, by Service Proposition 2020 & 2033
- Table 32: Global Fintech Industry in India Volume Billion Forecast, by Service Proposition 2020 & 2033
- Table 33: Global Fintech Industry in India Revenue Million Forecast, by Application 2020 & 2033
- Table 34: Global Fintech Industry in India Volume Billion Forecast, by Application 2020 & 2033
- Table 35: Global Fintech Industry in India Revenue Million Forecast, by Country 2020 & 2033
- Table 36: Global Fintech Industry in India Volume Billion Forecast, by Country 2020 & 2033
- Table 37: United Kingdom Fintech Industry in India Revenue (Million) Forecast, by Application 2020 & 2033
- Table 38: United Kingdom Fintech Industry in India Volume (Billion) Forecast, by Application 2020 & 2033
- Table 39: Germany Fintech Industry in India Revenue (Million) Forecast, by Application 2020 & 2033
- Table 40: Germany Fintech Industry in India Volume (Billion) Forecast, by Application 2020 & 2033
- Table 41: France Fintech Industry in India Revenue (Million) Forecast, by Application 2020 & 2033
- Table 42: France Fintech Industry in India Volume (Billion) Forecast, by Application 2020 & 2033
- Table 43: Italy Fintech Industry in India Revenue (Million) Forecast, by Application 2020 & 2033
- Table 44: Italy Fintech Industry in India Volume (Billion) Forecast, by Application 2020 & 2033
- Table 45: Spain Fintech Industry in India Revenue (Million) Forecast, by Application 2020 & 2033
- Table 46: Spain Fintech Industry in India Volume (Billion) Forecast, by Application 2020 & 2033
- Table 47: Russia Fintech Industry in India Revenue (Million) Forecast, by Application 2020 & 2033
- Table 48: Russia Fintech Industry in India Volume (Billion) Forecast, by Application 2020 & 2033
- Table 49: Benelux Fintech Industry in India Revenue (Million) Forecast, by Application 2020 & 2033
- Table 50: Benelux Fintech Industry in India Volume (Billion) Forecast, by Application 2020 & 2033
- Table 51: Nordics Fintech Industry in India Revenue (Million) Forecast, by Application 2020 & 2033
- Table 52: Nordics Fintech Industry in India Volume (Billion) Forecast, by Application 2020 & 2033
- Table 53: Rest of Europe Fintech Industry in India Revenue (Million) Forecast, by Application 2020 & 2033
- Table 54: Rest of Europe Fintech Industry in India Volume (Billion) Forecast, by Application 2020 & 2033
- Table 55: Global Fintech Industry in India Revenue Million Forecast, by Service Proposition 2020 & 2033
- Table 56: Global Fintech Industry in India Volume Billion Forecast, by Service Proposition 2020 & 2033
- Table 57: Global Fintech Industry in India Revenue Million Forecast, by Application 2020 & 2033
- Table 58: Global Fintech Industry in India Volume Billion Forecast, by Application 2020 & 2033
- Table 59: Global Fintech Industry in India Revenue Million Forecast, by Country 2020 & 2033
- Table 60: Global Fintech Industry in India Volume Billion Forecast, by Country 2020 & 2033
- Table 61: Turkey Fintech Industry in India Revenue (Million) Forecast, by Application 2020 & 2033
- Table 62: Turkey Fintech Industry in India Volume (Billion) Forecast, by Application 2020 & 2033
- Table 63: Israel Fintech Industry in India Revenue (Million) Forecast, by Application 2020 & 2033
- Table 64: Israel Fintech Industry in India Volume (Billion) Forecast, by Application 2020 & 2033
- Table 65: GCC Fintech Industry in India Revenue (Million) Forecast, by Application 2020 & 2033
- Table 66: GCC Fintech Industry in India Volume (Billion) Forecast, by Application 2020 & 2033
- Table 67: North Africa Fintech Industry in India Revenue (Million) Forecast, by Application 2020 & 2033
- Table 68: North Africa Fintech Industry in India Volume (Billion) Forecast, by Application 2020 & 2033
- Table 69: South Africa Fintech Industry in India Revenue (Million) Forecast, by Application 2020 & 2033
- Table 70: South Africa Fintech Industry in India Volume (Billion) Forecast, by Application 2020 & 2033
- Table 71: Rest of Middle East & Africa Fintech Industry in India Revenue (Million) Forecast, by Application 2020 & 2033
- Table 72: Rest of Middle East & Africa Fintech Industry in India Volume (Billion) Forecast, by Application 2020 & 2033
- Table 73: Global Fintech Industry in India Revenue Million Forecast, by Service Proposition 2020 & 2033
- Table 74: Global Fintech Industry in India Volume Billion Forecast, by Service Proposition 2020 & 2033
- Table 75: Global Fintech Industry in India Revenue Million Forecast, by Application 2020 & 2033
- Table 76: Global Fintech Industry in India Volume Billion Forecast, by Application 2020 & 2033
- Table 77: Global Fintech Industry in India Revenue Million Forecast, by Country 2020 & 2033
- Table 78: Global Fintech Industry in India Volume Billion Forecast, by Country 2020 & 2033
- Table 79: China Fintech Industry in India Revenue (Million) Forecast, by Application 2020 & 2033
- Table 80: China Fintech Industry in India Volume (Billion) Forecast, by Application 2020 & 2033
- Table 81: India Fintech Industry in India Revenue (Million) Forecast, by Application 2020 & 2033
- Table 82: India Fintech Industry in India Volume (Billion) Forecast, by Application 2020 & 2033
- Table 83: Japan Fintech Industry in India Revenue (Million) Forecast, by Application 2020 & 2033
- Table 84: Japan Fintech Industry in India Volume (Billion) Forecast, by Application 2020 & 2033
- Table 85: South Korea Fintech Industry in India Revenue (Million) Forecast, by Application 2020 & 2033
- Table 86: South Korea Fintech Industry in India Volume (Billion) Forecast, by Application 2020 & 2033
- Table 87: ASEAN Fintech Industry in India Revenue (Million) Forecast, by Application 2020 & 2033
- Table 88: ASEAN Fintech Industry in India Volume (Billion) Forecast, by Application 2020 & 2033
- Table 89: Oceania Fintech Industry in India Revenue (Million) Forecast, by Application 2020 & 2033
- Table 90: Oceania Fintech Industry in India Volume (Billion) Forecast, by Application 2020 & 2033
- Table 91: Rest of Asia Pacific Fintech Industry in India Revenue (Million) Forecast, by Application 2020 & 2033
- Table 92: Rest of Asia Pacific Fintech Industry in India Volume (Billion) Forecast, by Application 2020 & 2033
Frequently Asked Questions
1. What is the projected Compound Annual Growth Rate (CAGR) of the Fintech Industry in India?
The projected CAGR is approximately 30.55%.
2. Which companies are prominent players in the Fintech Industry in India?
Key companies in the market include Paytm, MobiKwik, Policy Bazaar, PayU, Kissht, Shubh Loans, Lending Kart, Phonepe, Faircent, ET money**List Not Exhaustive.
3. What are the main segments of the Fintech Industry in India?
The market segments include Service Proposition, Application.
4. Can you provide details about the market size?
The market size is estimated to be USD 111.14 Million as of 2022.
5. What are some drivers contributing to market growth?
Increasing Demand for Digital Services; Rapid Advancement in Technology is Driving the Market.
6. What are the notable trends driving market growth?
Increase in Mobile Banking Payments is Surging the Growth of the Market.
7. Are there any restraints impacting market growth?
Increasing Demand for Digital Services; Rapid Advancement in Technology is Driving the Market.
8. Can you provide examples of recent developments in the market?
September 2023: PayU, an Indian payments company, partnered with WhatsApp to considerably improve Indians' purchasing experience.
9. What pricing options are available for accessing the report?
Pricing options include single-user, multi-user, and enterprise licenses priced at USD 3800, USD 4500, and USD 5800 respectively.
10. Is the market size provided in terms of value or volume?
The market size is provided in terms of value, measured in Million and volume, measured in Billion.
11. Are there any specific market keywords associated with the report?
Yes, the market keyword associated with the report is "Fintech Industry in India," which aids in identifying and referencing the specific market segment covered.
12. How do I determine which pricing option suits my needs best?
The pricing options vary based on user requirements and access needs. Individual users may opt for single-user licenses, while businesses requiring broader access may choose multi-user or enterprise licenses for cost-effective access to the report.
13. Are there any additional resources or data provided in the Fintech Industry in India report?
While the report offers comprehensive insights, it's advisable to review the specific contents or supplementary materials provided to ascertain if additional resources or data are available.
14. How can I stay updated on further developments or reports in the Fintech Industry in India?
To stay informed about further developments, trends, and reports in the Fintech Industry in India, consider subscribing to industry newsletters, following relevant companies and organizations, or regularly checking reputable industry news sources and publications.
Methodology
Step 1 - Identification of Relevant Samples Size from Population Database


Step 2 - Approaches for Defining Global Market Size (Value, Volume* & Price*)

Note*: In applicable scenarios
Step 3 - Data Sources
Primary Research
- Web Analytics
- Survey Reports
- Research Institute
- Latest Research Reports
- Opinion Leaders
Secondary Research
- Annual Reports
- White Paper
- Latest Press Release
- Industry Association
- Paid Database
- Investor Presentations

Step 4 - Data Triangulation
Involves using different sources of information in order to increase the validity of a study
These sources are likely to be stakeholders in a program - participants, other researchers, program staff, other community members, and so on.
Then we put all data in single framework & apply various statistical tools to find out the dynamic on the market.
During the analysis stage, feedback from the stakeholder groups would be compared to determine areas of agreement as well as areas of divergence