

Key Insights
The Indian freight transport sector is poised for significant expansion, with a projected Compound Annual Growth Rate (CAGR) of 11.5%. This dynamic industry is a critical enabler of India's economic progress, driven by robust e-commerce growth, a thriving manufacturing base, and extensive infrastructure development. Government initiatives aimed at enhancing road networks and logistics further bolster this positive trajectory. While challenges such as fuel price volatility and regulatory hurdles persist, the industry is actively embracing technological advancements, including digital freight management and tracking solutions, to improve transparency and operational efficiency. The market is diversified across numerous end-user industries, transportation modes, and geographical regions, presenting ample opportunities for specialized service providers.
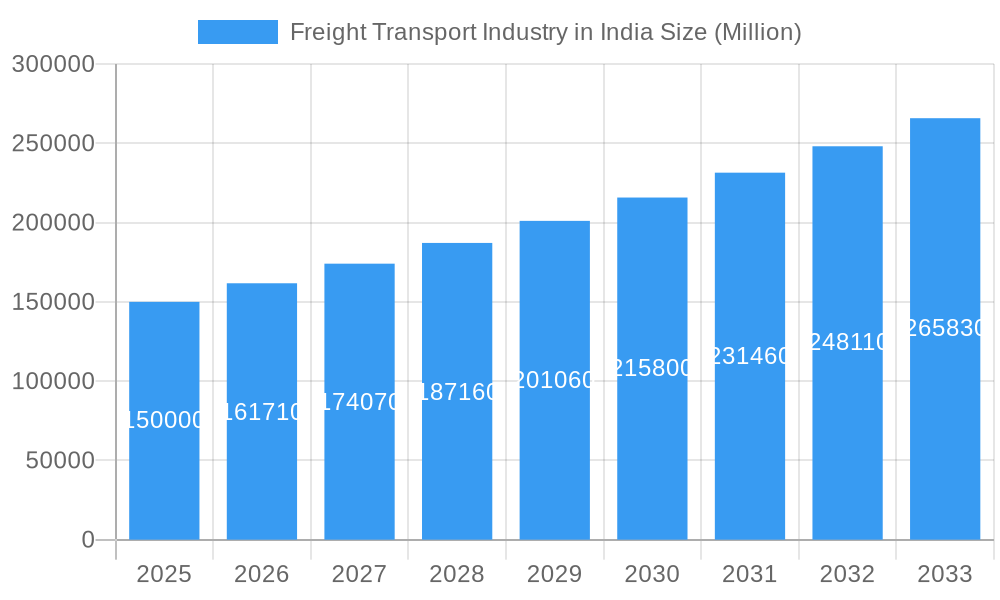
Freight Transport Industry in India Market Size (In Billion)
The competitive environment features a blend of global logistics giants and agile domestic enterprises. Market leaders leverage extensive networks, while smaller players excel in niche segments. Future growth will be propelled by ongoing infrastructure enhancements, technological innovation, and adaptability to evolving customer demands and regulatory landscapes. A growing emphasis on sustainable and eco-friendly transportation solutions is also shaping the industry. The market is forecast to reach a size of 38.5 billion by 2025, underscoring the importance of continuous supply chain and logistics optimization to support India's burgeoning economy.
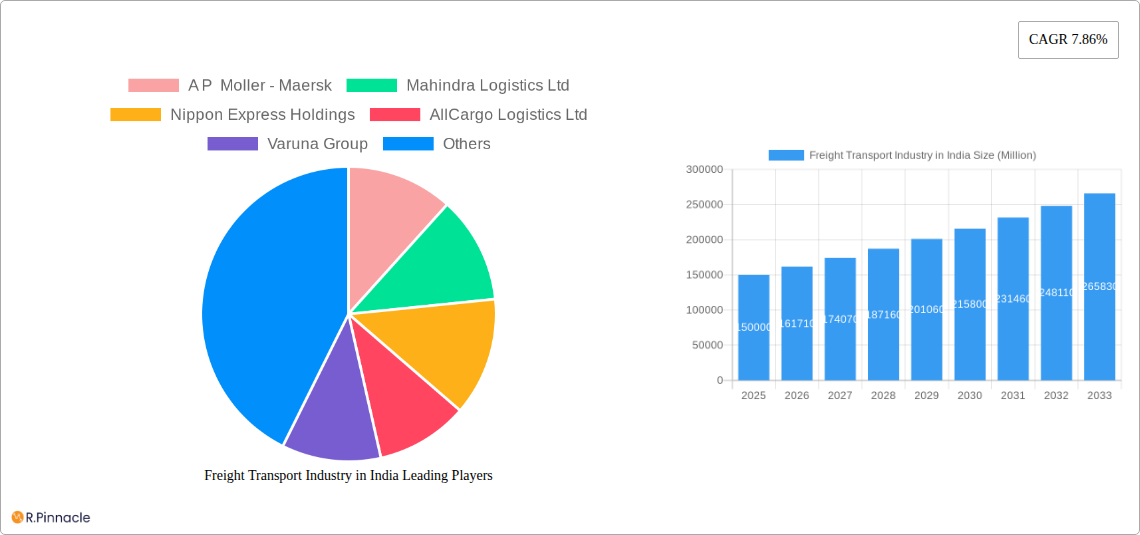
Freight Transport Industry in India Company Market Share
Freight Transport Industry in India Market Structure & Innovation Trends
This report provides a comprehensive analysis of the Indian freight transport industry, covering the period 2019-2033. The market is characterized by a mix of large multinational players and domestic companies, leading to a moderately fragmented structure. While precise market share figures for each company fluctuate, A P Moller - Maersk, Mahindra Logistics Ltd, and AllCargo Logistics Ltd consistently hold significant shares. The industry exhibits varying degrees of concentration across different segments, with higher consolidation in certain niches like containerized long-haul transport. Innovation is driven by factors such as increasing e-commerce penetration, the burgeoning need for efficient supply chain management, and government initiatives promoting infrastructure development. Stringent regulatory frameworks, particularly concerning safety and emission norms, also shape innovation. Product substitutes, such as improved rail transport and the growth of inland waterways, pose competitive pressures. End-user demographics show a strong correlation with economic growth, with sectors like manufacturing and e-commerce significantly impacting freight demand. M&A activity has been substantial in recent years, with deal values exceeding xx Million in the past five years. Key examples include (specific deals and values would need to be researched and inserted here).
Freight Transport Industry in India Market Dynamics & Trends
The Indian freight transport market exhibits robust growth, driven by a rapidly expanding economy, increasing industrial output, and the rise of e-commerce. The Compound Annual Growth Rate (CAGR) during the historical period (2019-2024) was estimated at xx%, while the forecast period (2025-2033) projects a CAGR of xx%. Market penetration of newer technologies, such as GPS tracking and telematics, is steadily increasing, improving efficiency and reducing operational costs. Consumer preferences are shifting towards faster, more reliable, and technologically advanced logistics solutions. Competitive dynamics are intensifying, with players focusing on enhancing service offerings, expanding their networks, and adopting innovative technologies. The market is witnessing a significant shift towards consolidation, with larger companies acquiring smaller ones to gain market share and expand their service capabilities. The penetration of LTL services continues to grow, indicating a rise in smaller shipments driven by the e-commerce sector. Technological disruptions like the introduction of autonomous vehicles and drone delivery systems promise to reshape the industry significantly, though widespread adoption is expected only over the longer term.
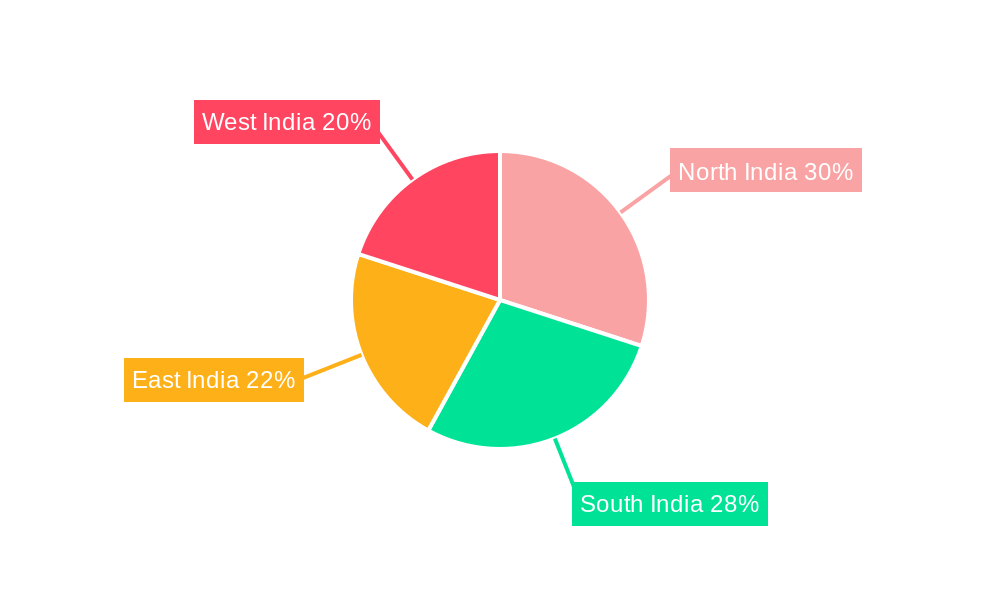
Dominant Regions & Segments in Freight Transport Industry in India
The Indian freight transport market exhibits regional disparities, with certain areas experiencing significantly higher growth compared to others. Key factors contributing to regional dominance include:
- Economic Activity: Regions with higher industrial concentration and robust economic activity naturally exhibit higher freight volumes.
- Infrastructure Development: Areas with better road, rail, and port infrastructure attract more freight traffic.
- Government Policies: Targeted government initiatives promoting infrastructure development in specific regions can significantly influence their dominance.
Dominant Segments: The Manufacturing, Wholesale and Retail Trade, and Construction end-user segments are currently driving the majority of freight volumes. Within transportation modes, Domestic freight accounts for a significantly larger share than International freight. The FTL segment holds a larger share than LTL, although LTL is showing faster growth, driven by e-commerce. Containerized freight is progressively becoming dominant over non-containerized freight due to improved efficiency and safety. Long-haul transport dominates the distance category. Solid goods and non-temperature controlled goods form the bulk of freight. A detailed breakdown of market share for each segment is provided in subsequent sections.
Freight Transport Industry in India Product Innovations
The Indian freight transport industry is witnessing a surge in product innovations, driven by technological advancements and the need for improved efficiency and sustainability. These include the adoption of advanced telematics systems for real-time tracking and fleet management, the use of AI-powered route optimization software, and the integration of blockchain technology for enhanced supply chain transparency. The growing use of electric and alternative fuel vehicles showcases a strong push towards sustainability. These innovations are leading to improved cost-effectiveness, faster delivery times, and reduced environmental impact, fostering a competitive edge in the market.
Report Scope & Segmentation Analysis
This report analyzes the Indian freight transport market across various segments:
- End-User Industry: Agriculture, Fishing, and Forestry; Construction; Manufacturing; Oil and Gas; Mining and Quarrying; Wholesale and Retail Trade; Others. Each segment shows varying growth projections based on sector-specific trends.
- Destination: Domestic and International, with substantial difference in volume and growth rates.
- Truckload Specification: Full-Truck-Load (FTL) and Less-than-Truck-Load (LTL), reflecting different shipment sizes and cost structures.
- Containerization: Containerized and Non-Containerized, indicating different handling methods and efficiency levels.
- Distance: Long Haul and Short Haul, highlighting variations in operational costs and transit times.
- Goods Configuration: Fluid Goods and Solid Goods, addressing the specific handling requirements of different cargo types.
- Temperature Control: Non-Temperature Controlled and Temperature Controlled, reflecting specialized logistical needs for perishable goods.
Each segment's market size, growth projections, and competitive dynamics are detailed in the main report.
Key Drivers of Freight Transport Industry in India Growth
The growth of the Indian freight transport industry is propelled by several key factors: India's robust economic growth fuels demand for efficient logistics solutions. Government initiatives focused on infrastructure development, such as road and rail expansion, play a crucial role. The rise of e-commerce exponentially increases the demand for last-mile delivery services. Technological advancements, such as GPS tracking and real-time shipment monitoring systems, contribute to improved efficiency and reduced operational costs. Favorable regulatory policies that encourage private sector participation in the logistics sector further stimulate growth.
Challenges in the Freight Transport Industry in India Sector
The Indian freight transport industry faces significant challenges. Infrastructure limitations, such as inadequate road networks and congested ports, hamper efficient transportation. Stringent regulatory compliance and bureaucratic processes increase operational costs. Driver shortages and high driver turnover rates create supply chain disruptions. Fuel price volatility impacts profitability, and intense competition among players puts pressure on margins. These factors negatively impact operational efficiency and overall profitability, resulting in xx Million in estimated annual losses across the sector (this needs to be researched for a valid figure).
Emerging Opportunities in Freight Transport Industry in India
The Indian freight transport sector presents substantial growth opportunities. The increasing adoption of technology, such as AI-powered route optimization and autonomous vehicles, promises to enhance efficiency and reduce costs. The government's focus on infrastructure development creates opportunities for expansion and investment. The burgeoning e-commerce market fuels demand for specialized last-mile delivery solutions. The growth of cold chain logistics caters to the rising demand for temperature-controlled transportation of perishable goods. These trends will shape future growth and offer strategic advantages to innovative players.
Leading Players in the Freight Transport Industry in India Market
- A P Moller - Maersk
- Mahindra Logistics Ltd
- Nippon Express Holdings
- AllCargo Logistics Ltd
- Varuna Group
- CJ Darcl
- DHL Group
- GEODIS
- VRL Logistics Ltd
- Delhivery Limited
- Transport Corporation of India Limited (TCI)
- Safexpress
- V-Trans
- Gati Express & Supply Chain Private Limited
- Expeditors International of Washington Inc
Key Developments in Freight Transport Industry in India Industry
- October 2023: CJ Darcl Logistics and Tata Motors signed an MoU to strengthen CJ Darcl's fleet and explore new logistics services, indicating strategic partnerships driving fleet expansion.
- September 2023: Shreeji Translogistics Limited contracted with DHL Express (India) for bonded trucking services, highlighting the growing demand for specialized courier services.
- August 2023: Maersk expanded its electric vehicle fleet to over 500 for e-commerce deliveries, showcasing the industry's commitment to sustainability and green solutions.
Future Outlook for Freight Transport Industry in India Market
The future of the Indian freight transport industry is promising, with continued growth driven by economic expansion and technological advancements. The increasing adoption of digital technologies, improved infrastructure, and government support will further fuel this growth. Companies focusing on sustainable practices and innovative solutions will be well-positioned to capitalize on emerging opportunities. The market is expected to witness consolidation, with larger players acquiring smaller ones to enhance their market share and service offerings. The integration of technology and sustainable practices will be critical for long-term success in the competitive landscape.
Freight Transport Industry in India Segmentation
-
1. End User Industry
- 1.1. Agriculture, Fishing, and Forestry
- 1.2. Construction
- 1.3. Manufacturing
- 1.4. Oil and Gas, Mining and Quarrying
- 1.5. Wholesale and Retail Trade
- 1.6. Others
-
2. Destination
- 2.1. Domestic
- 2.2. International
-
3. Truckload Specification
- 3.1. Full-Truck-Load (FTL)
- 3.2. Less than-Truck-Load (LTL)
-
4. Containerization
- 4.1. Containerized
- 4.2. Non-Containerized
-
5. Distance
- 5.1. Long Haul
- 5.2. Short Haul
-
6. Goods Configuration
- 6.1. Fluid Goods
- 6.2. Solid Goods
-
7. Temperature Control
- 7.1. Non-Temperature Controlled
Freight Transport Industry in India Segmentation By Geography
-
1. North America
- 1.1. United States
- 1.2. Canada
- 1.3. Mexico
-
2. South America
- 2.1. Brazil
- 2.2. Argentina
- 2.3. Rest of South America
-
3. Europe
- 3.1. United Kingdom
- 3.2. Germany
- 3.3. France
- 3.4. Italy
- 3.5. Spain
- 3.6. Russia
- 3.7. Benelux
- 3.8. Nordics
- 3.9. Rest of Europe
-
4. Middle East & Africa
- 4.1. Turkey
- 4.2. Israel
- 4.3. GCC
- 4.4. North Africa
- 4.5. South Africa
- 4.6. Rest of Middle East & Africa
-
5. Asia Pacific
- 5.1. China
- 5.2. India
- 5.3. Japan
- 5.4. South Korea
- 5.5. ASEAN
- 5.6. Oceania
- 5.7. Rest of Asia Pacific
Freight Transport Industry in India Regional Market Share
Geographic Coverage of Freight Transport Industry in India
Freight Transport Industry in India REPORT HIGHLIGHTS
| Aspects | Details |
|---|---|
| Study Period | 2020-2034 |
| Base Year | 2025 |
| Estimated Year | 2026 |
| Forecast Period | 2026-2034 |
| Historical Period | 2020-2025 |
| Growth Rate | CAGR of 11.5% from 2020-2034 |
| Segmentation |
|
Table of Contents
- 1. Introduction
- 1.1. Research Scope
- 1.2. Market Segmentation
- 1.3. Research Objective
- 1.4. Definitions and Assumptions
- 2. Executive Summary
- 2.1. Market Snapshot
- 3. Market Dynamics
- 3.1. Market Drivers
- 3.2. Market Restrains
- 3.3. Market Trends
- 3.4. Market Opportunities
- 4. Market Factor Analysis
- 4.1. Porters Five Forces
- 4.1.1. Bargaining Power of Suppliers
- 4.1.2. Bargaining Power of Buyers
- 4.1.3. Threat of New Entrants
- 4.1.4. Threat of Substitutes
- 4.1.5. Competitive Rivalry
- 4.2. PESTEL analysis
- 4.3. BCG Analysis
- 4.3.1. Stars (High Growth, High Market Share)
- 4.3.2. Cash Cows (Low Growth, High Market Share)
- 4.3.3. Question Mark (High Growth, Low Market Share)
- 4.3.4. Dogs (Low Growth, Low Market Share)
- 4.4. Ansoff Matrix Analysis
- 4.5. Supply Chain Analysis
- 4.6. Regulatory Landscape
- 4.7. Current Market Potential and Opportunity Assessment (TAM–SAM–SOM Framework)
- 4.8. PRI Analyst Note
- 4.1. Porters Five Forces
- 5. Market Analysis, Insights and Forecast 2021-2033
- 5.1. Market Analysis, Insights and Forecast - by End User Industry
- 5.1.1. Agriculture, Fishing, and Forestry
- 5.1.2. Construction
- 5.1.3. Manufacturing
- 5.1.4. Oil and Gas, Mining and Quarrying
- 5.1.5. Wholesale and Retail Trade
- 5.1.6. Others
- 5.2. Market Analysis, Insights and Forecast - by Destination
- 5.2.1. Domestic
- 5.2.2. International
- 5.3. Market Analysis, Insights and Forecast - by Truckload Specification
- 5.3.1. Full-Truck-Load (FTL)
- 5.3.2. Less than-Truck-Load (LTL)
- 5.4. Market Analysis, Insights and Forecast - by Containerization
- 5.4.1. Containerized
- 5.4.2. Non-Containerized
- 5.5. Market Analysis, Insights and Forecast - by Distance
- 5.5.1. Long Haul
- 5.5.2. Short Haul
- 5.6. Market Analysis, Insights and Forecast - by Goods Configuration
- 5.6.1. Fluid Goods
- 5.6.2. Solid Goods
- 5.7. Market Analysis, Insights and Forecast - by Temperature Control
- 5.7.1. Non-Temperature Controlled
- 5.8. Market Analysis, Insights and Forecast - by Region
- 5.8.1. North America
- 5.8.2. South America
- 5.8.3. Europe
- 5.8.4. Middle East & Africa
- 5.8.5. Asia Pacific
- 5.1. Market Analysis, Insights and Forecast - by End User Industry
- 6. Global Freight Transport Industry in India Analysis, Insights and Forecast, 2021-2033
- 6.1. Market Analysis, Insights and Forecast - by End User Industry
- 6.1.1. Agriculture, Fishing, and Forestry
- 6.1.2. Construction
- 6.1.3. Manufacturing
- 6.1.4. Oil and Gas, Mining and Quarrying
- 6.1.5. Wholesale and Retail Trade
- 6.1.6. Others
- 6.2. Market Analysis, Insights and Forecast - by Destination
- 6.2.1. Domestic
- 6.2.2. International
- 6.3. Market Analysis, Insights and Forecast - by Truckload Specification
- 6.3.1. Full-Truck-Load (FTL)
- 6.3.2. Less than-Truck-Load (LTL)
- 6.4. Market Analysis, Insights and Forecast - by Containerization
- 6.4.1. Containerized
- 6.4.2. Non-Containerized
- 6.5. Market Analysis, Insights and Forecast - by Distance
- 6.5.1. Long Haul
- 6.5.2. Short Haul
- 6.6. Market Analysis, Insights and Forecast - by Goods Configuration
- 6.6.1. Fluid Goods
- 6.6.2. Solid Goods
- 6.7. Market Analysis, Insights and Forecast - by Temperature Control
- 6.7.1. Non-Temperature Controlled
- 6.1. Market Analysis, Insights and Forecast - by End User Industry
- 7. North America Freight Transport Industry in India Analysis, Insights and Forecast, 2020-2032
- 7.1. Market Analysis, Insights and Forecast - by End User Industry
- 7.1.1. Agriculture, Fishing, and Forestry
- 7.1.2. Construction
- 7.1.3. Manufacturing
- 7.1.4. Oil and Gas, Mining and Quarrying
- 7.1.5. Wholesale and Retail Trade
- 7.1.6. Others
- 7.2. Market Analysis, Insights and Forecast - by Destination
- 7.2.1. Domestic
- 7.2.2. International
- 7.3. Market Analysis, Insights and Forecast - by Truckload Specification
- 7.3.1. Full-Truck-Load (FTL)
- 7.3.2. Less than-Truck-Load (LTL)
- 7.4. Market Analysis, Insights and Forecast - by Containerization
- 7.4.1. Containerized
- 7.4.2. Non-Containerized
- 7.5. Market Analysis, Insights and Forecast - by Distance
- 7.5.1. Long Haul
- 7.5.2. Short Haul
- 7.6. Market Analysis, Insights and Forecast - by Goods Configuration
- 7.6.1. Fluid Goods
- 7.6.2. Solid Goods
- 7.7. Market Analysis, Insights and Forecast - by Temperature Control
- 7.7.1. Non-Temperature Controlled
- 7.1. Market Analysis, Insights and Forecast - by End User Industry
- 8. South America Freight Transport Industry in India Analysis, Insights and Forecast, 2020-2032
- 8.1. Market Analysis, Insights and Forecast - by End User Industry
- 8.1.1. Agriculture, Fishing, and Forestry
- 8.1.2. Construction
- 8.1.3. Manufacturing
- 8.1.4. Oil and Gas, Mining and Quarrying
- 8.1.5. Wholesale and Retail Trade
- 8.1.6. Others
- 8.2. Market Analysis, Insights and Forecast - by Destination
- 8.2.1. Domestic
- 8.2.2. International
- 8.3. Market Analysis, Insights and Forecast - by Truckload Specification
- 8.3.1. Full-Truck-Load (FTL)
- 8.3.2. Less than-Truck-Load (LTL)
- 8.4. Market Analysis, Insights and Forecast - by Containerization
- 8.4.1. Containerized
- 8.4.2. Non-Containerized
- 8.5. Market Analysis, Insights and Forecast - by Distance
- 8.5.1. Long Haul
- 8.5.2. Short Haul
- 8.6. Market Analysis, Insights and Forecast - by Goods Configuration
- 8.6.1. Fluid Goods
- 8.6.2. Solid Goods
- 8.7. Market Analysis, Insights and Forecast - by Temperature Control
- 8.7.1. Non-Temperature Controlled
- 8.1. Market Analysis, Insights and Forecast - by End User Industry
- 9. Europe Freight Transport Industry in India Analysis, Insights and Forecast, 2020-2032
- 9.1. Market Analysis, Insights and Forecast - by End User Industry
- 9.1.1. Agriculture, Fishing, and Forestry
- 9.1.2. Construction
- 9.1.3. Manufacturing
- 9.1.4. Oil and Gas, Mining and Quarrying
- 9.1.5. Wholesale and Retail Trade
- 9.1.6. Others
- 9.2. Market Analysis, Insights and Forecast - by Destination
- 9.2.1. Domestic
- 9.2.2. International
- 9.3. Market Analysis, Insights and Forecast - by Truckload Specification
- 9.3.1. Full-Truck-Load (FTL)
- 9.3.2. Less than-Truck-Load (LTL)
- 9.4. Market Analysis, Insights and Forecast - by Containerization
- 9.4.1. Containerized
- 9.4.2. Non-Containerized
- 9.5. Market Analysis, Insights and Forecast - by Distance
- 9.5.1. Long Haul
- 9.5.2. Short Haul
- 9.6. Market Analysis, Insights and Forecast - by Goods Configuration
- 9.6.1. Fluid Goods
- 9.6.2. Solid Goods
- 9.7. Market Analysis, Insights and Forecast - by Temperature Control
- 9.7.1. Non-Temperature Controlled
- 9.1. Market Analysis, Insights and Forecast - by End User Industry
- 10. Middle East & Africa Freight Transport Industry in India Analysis, Insights and Forecast, 2020-2032
- 10.1. Market Analysis, Insights and Forecast - by End User Industry
- 10.1.1. Agriculture, Fishing, and Forestry
- 10.1.2. Construction
- 10.1.3. Manufacturing
- 10.1.4. Oil and Gas, Mining and Quarrying
- 10.1.5. Wholesale and Retail Trade
- 10.1.6. Others
- 10.2. Market Analysis, Insights and Forecast - by Destination
- 10.2.1. Domestic
- 10.2.2. International
- 10.3. Market Analysis, Insights and Forecast - by Truckload Specification
- 10.3.1. Full-Truck-Load (FTL)
- 10.3.2. Less than-Truck-Load (LTL)
- 10.4. Market Analysis, Insights and Forecast - by Containerization
- 10.4.1. Containerized
- 10.4.2. Non-Containerized
- 10.5. Market Analysis, Insights and Forecast - by Distance
- 10.5.1. Long Haul
- 10.5.2. Short Haul
- 10.6. Market Analysis, Insights and Forecast - by Goods Configuration
- 10.6.1. Fluid Goods
- 10.6.2. Solid Goods
- 10.7. Market Analysis, Insights and Forecast - by Temperature Control
- 10.7.1. Non-Temperature Controlled
- 10.1. Market Analysis, Insights and Forecast - by End User Industry
- 11. Asia Pacific Freight Transport Industry in India Analysis, Insights and Forecast, 2020-2032
- 11.1. Market Analysis, Insights and Forecast - by End User Industry
- 11.1.1. Agriculture, Fishing, and Forestry
- 11.1.2. Construction
- 11.1.3. Manufacturing
- 11.1.4. Oil and Gas, Mining and Quarrying
- 11.1.5. Wholesale and Retail Trade
- 11.1.6. Others
- 11.2. Market Analysis, Insights and Forecast - by Destination
- 11.2.1. Domestic
- 11.2.2. International
- 11.3. Market Analysis, Insights and Forecast - by Truckload Specification
- 11.3.1. Full-Truck-Load (FTL)
- 11.3.2. Less than-Truck-Load (LTL)
- 11.4. Market Analysis, Insights and Forecast - by Containerization
- 11.4.1. Containerized
- 11.4.2. Non-Containerized
- 11.5. Market Analysis, Insights and Forecast - by Distance
- 11.5.1. Long Haul
- 11.5.2. Short Haul
- 11.6. Market Analysis, Insights and Forecast - by Goods Configuration
- 11.6.1. Fluid Goods
- 11.6.2. Solid Goods
- 11.7. Market Analysis, Insights and Forecast - by Temperature Control
- 11.7.1. Non-Temperature Controlled
- 11.1. Market Analysis, Insights and Forecast - by End User Industry
- 12. Competitive Analysis
- 12.1. Company Profiles
- 12.1.1 A P Moller - Maersk
- 12.1.1.1. Company Overview
- 12.1.1.2. Products
- 12.1.1.3. Company Financials
- 12.1.1.4. SWOT Analysis
- 12.1.2 Mahindra Logistics Ltd
- 12.1.2.1. Company Overview
- 12.1.2.2. Products
- 12.1.2.3. Company Financials
- 12.1.2.4. SWOT Analysis
- 12.1.3 Nippon Express Holdings
- 12.1.3.1. Company Overview
- 12.1.3.2. Products
- 12.1.3.3. Company Financials
- 12.1.3.4. SWOT Analysis
- 12.1.4 AllCargo Logistics Ltd
- 12.1.4.1. Company Overview
- 12.1.4.2. Products
- 12.1.4.3. Company Financials
- 12.1.4.4. SWOT Analysis
- 12.1.5 Varuna Group
- 12.1.5.1. Company Overview
- 12.1.5.2. Products
- 12.1.5.3. Company Financials
- 12.1.5.4. SWOT Analysis
- 12.1.6 CJ Darcl
- 12.1.6.1. Company Overview
- 12.1.6.2. Products
- 12.1.6.3. Company Financials
- 12.1.6.4. SWOT Analysis
- 12.1.7 DHL Group
- 12.1.7.1. Company Overview
- 12.1.7.2. Products
- 12.1.7.3. Company Financials
- 12.1.7.4. SWOT Analysis
- 12.1.8 GEODIS
- 12.1.8.1. Company Overview
- 12.1.8.2. Products
- 12.1.8.3. Company Financials
- 12.1.8.4. SWOT Analysis
- 12.1.9 VRL Logistics Ltd
- 12.1.9.1. Company Overview
- 12.1.9.2. Products
- 12.1.9.3. Company Financials
- 12.1.9.4. SWOT Analysis
- 12.1.10 Delhivery Limited
- 12.1.10.1. Company Overview
- 12.1.10.2. Products
- 12.1.10.3. Company Financials
- 12.1.10.4. SWOT Analysis
- 12.1.11 Transport Corporation of India Limited (TCI)
- 12.1.11.1. Company Overview
- 12.1.11.2. Products
- 12.1.11.3. Company Financials
- 12.1.11.4. SWOT Analysis
- 12.1.12 Safexpress
- 12.1.12.1. Company Overview
- 12.1.12.2. Products
- 12.1.12.3. Company Financials
- 12.1.12.4. SWOT Analysis
- 12.1.13 V-Trans
- 12.1.13.1. Company Overview
- 12.1.13.2. Products
- 12.1.13.3. Company Financials
- 12.1.13.4. SWOT Analysis
- 12.1.14 Gati Express & Supply Chain Private Limited
- 12.1.14.1. Company Overview
- 12.1.14.2. Products
- 12.1.14.3. Company Financials
- 12.1.14.4. SWOT Analysis
- 12.1.15 Expeditors International of Washington Inc
- 12.1.15.1. Company Overview
- 12.1.15.2. Products
- 12.1.15.3. Company Financials
- 12.1.15.4. SWOT Analysis
- 12.1.1 A P Moller - Maersk
- 12.2. Market Entropy
- 12.2.1 Company's Key Areas Served
- 12.2.2 Recent Developments
- 12.3. Company Market Share Analysis 2025
- 12.3.1 Top 5 Companies Market Share Analysis
- 12.3.2 Top 3 Companies Market Share Analysis
- 12.4. List of Potential Customers
- 13. Research Methodology
List of Figures
- Figure 1: Global Freight Transport Industry in India Revenue Breakdown (billion, %) by Region 2025 & 2033
- Figure 2: North America Freight Transport Industry in India Revenue (billion), by End User Industry 2025 & 2033
- Figure 3: North America Freight Transport Industry in India Revenue Share (%), by End User Industry 2025 & 2033
- Figure 4: North America Freight Transport Industry in India Revenue (billion), by Destination 2025 & 2033
- Figure 5: North America Freight Transport Industry in India Revenue Share (%), by Destination 2025 & 2033
- Figure 6: North America Freight Transport Industry in India Revenue (billion), by Truckload Specification 2025 & 2033
- Figure 7: North America Freight Transport Industry in India Revenue Share (%), by Truckload Specification 2025 & 2033
- Figure 8: North America Freight Transport Industry in India Revenue (billion), by Containerization 2025 & 2033
- Figure 9: North America Freight Transport Industry in India Revenue Share (%), by Containerization 2025 & 2033
- Figure 10: North America Freight Transport Industry in India Revenue (billion), by Distance 2025 & 2033
- Figure 11: North America Freight Transport Industry in India Revenue Share (%), by Distance 2025 & 2033
- Figure 12: North America Freight Transport Industry in India Revenue (billion), by Goods Configuration 2025 & 2033
- Figure 13: North America Freight Transport Industry in India Revenue Share (%), by Goods Configuration 2025 & 2033
- Figure 14: North America Freight Transport Industry in India Revenue (billion), by Temperature Control 2025 & 2033
- Figure 15: North America Freight Transport Industry in India Revenue Share (%), by Temperature Control 2025 & 2033
- Figure 16: North America Freight Transport Industry in India Revenue (billion), by Country 2025 & 2033
- Figure 17: North America Freight Transport Industry in India Revenue Share (%), by Country 2025 & 2033
- Figure 18: South America Freight Transport Industry in India Revenue (billion), by End User Industry 2025 & 2033
- Figure 19: South America Freight Transport Industry in India Revenue Share (%), by End User Industry 2025 & 2033
- Figure 20: South America Freight Transport Industry in India Revenue (billion), by Destination 2025 & 2033
- Figure 21: South America Freight Transport Industry in India Revenue Share (%), by Destination 2025 & 2033
- Figure 22: South America Freight Transport Industry in India Revenue (billion), by Truckload Specification 2025 & 2033
- Figure 23: South America Freight Transport Industry in India Revenue Share (%), by Truckload Specification 2025 & 2033
- Figure 24: South America Freight Transport Industry in India Revenue (billion), by Containerization 2025 & 2033
- Figure 25: South America Freight Transport Industry in India Revenue Share (%), by Containerization 2025 & 2033
- Figure 26: South America Freight Transport Industry in India Revenue (billion), by Distance 2025 & 2033
- Figure 27: South America Freight Transport Industry in India Revenue Share (%), by Distance 2025 & 2033
- Figure 28: South America Freight Transport Industry in India Revenue (billion), by Goods Configuration 2025 & 2033
- Figure 29: South America Freight Transport Industry in India Revenue Share (%), by Goods Configuration 2025 & 2033
- Figure 30: South America Freight Transport Industry in India Revenue (billion), by Temperature Control 2025 & 2033
- Figure 31: South America Freight Transport Industry in India Revenue Share (%), by Temperature Control 2025 & 2033
- Figure 32: South America Freight Transport Industry in India Revenue (billion), by Country 2025 & 2033
- Figure 33: South America Freight Transport Industry in India Revenue Share (%), by Country 2025 & 2033
- Figure 34: Europe Freight Transport Industry in India Revenue (billion), by End User Industry 2025 & 2033
- Figure 35: Europe Freight Transport Industry in India Revenue Share (%), by End User Industry 2025 & 2033
- Figure 36: Europe Freight Transport Industry in India Revenue (billion), by Destination 2025 & 2033
- Figure 37: Europe Freight Transport Industry in India Revenue Share (%), by Destination 2025 & 2033
- Figure 38: Europe Freight Transport Industry in India Revenue (billion), by Truckload Specification 2025 & 2033
- Figure 39: Europe Freight Transport Industry in India Revenue Share (%), by Truckload Specification 2025 & 2033
- Figure 40: Europe Freight Transport Industry in India Revenue (billion), by Containerization 2025 & 2033
- Figure 41: Europe Freight Transport Industry in India Revenue Share (%), by Containerization 2025 & 2033
- Figure 42: Europe Freight Transport Industry in India Revenue (billion), by Distance 2025 & 2033
- Figure 43: Europe Freight Transport Industry in India Revenue Share (%), by Distance 2025 & 2033
- Figure 44: Europe Freight Transport Industry in India Revenue (billion), by Goods Configuration 2025 & 2033
- Figure 45: Europe Freight Transport Industry in India Revenue Share (%), by Goods Configuration 2025 & 2033
- Figure 46: Europe Freight Transport Industry in India Revenue (billion), by Temperature Control 2025 & 2033
- Figure 47: Europe Freight Transport Industry in India Revenue Share (%), by Temperature Control 2025 & 2033
- Figure 48: Europe Freight Transport Industry in India Revenue (billion), by Country 2025 & 2033
- Figure 49: Europe Freight Transport Industry in India Revenue Share (%), by Country 2025 & 2033
- Figure 50: Middle East & Africa Freight Transport Industry in India Revenue (billion), by End User Industry 2025 & 2033
- Figure 51: Middle East & Africa Freight Transport Industry in India Revenue Share (%), by End User Industry 2025 & 2033
- Figure 52: Middle East & Africa Freight Transport Industry in India Revenue (billion), by Destination 2025 & 2033
- Figure 53: Middle East & Africa Freight Transport Industry in India Revenue Share (%), by Destination 2025 & 2033
- Figure 54: Middle East & Africa Freight Transport Industry in India Revenue (billion), by Truckload Specification 2025 & 2033
- Figure 55: Middle East & Africa Freight Transport Industry in India Revenue Share (%), by Truckload Specification 2025 & 2033
- Figure 56: Middle East & Africa Freight Transport Industry in India Revenue (billion), by Containerization 2025 & 2033
- Figure 57: Middle East & Africa Freight Transport Industry in India Revenue Share (%), by Containerization 2025 & 2033
- Figure 58: Middle East & Africa Freight Transport Industry in India Revenue (billion), by Distance 2025 & 2033
- Figure 59: Middle East & Africa Freight Transport Industry in India Revenue Share (%), by Distance 2025 & 2033
- Figure 60: Middle East & Africa Freight Transport Industry in India Revenue (billion), by Goods Configuration 2025 & 2033
- Figure 61: Middle East & Africa Freight Transport Industry in India Revenue Share (%), by Goods Configuration 2025 & 2033
- Figure 62: Middle East & Africa Freight Transport Industry in India Revenue (billion), by Temperature Control 2025 & 2033
- Figure 63: Middle East & Africa Freight Transport Industry in India Revenue Share (%), by Temperature Control 2025 & 2033
- Figure 64: Middle East & Africa Freight Transport Industry in India Revenue (billion), by Country 2025 & 2033
- Figure 65: Middle East & Africa Freight Transport Industry in India Revenue Share (%), by Country 2025 & 2033
- Figure 66: Asia Pacific Freight Transport Industry in India Revenue (billion), by End User Industry 2025 & 2033
- Figure 67: Asia Pacific Freight Transport Industry in India Revenue Share (%), by End User Industry 2025 & 2033
- Figure 68: Asia Pacific Freight Transport Industry in India Revenue (billion), by Destination 2025 & 2033
- Figure 69: Asia Pacific Freight Transport Industry in India Revenue Share (%), by Destination 2025 & 2033
- Figure 70: Asia Pacific Freight Transport Industry in India Revenue (billion), by Truckload Specification 2025 & 2033
- Figure 71: Asia Pacific Freight Transport Industry in India Revenue Share (%), by Truckload Specification 2025 & 2033
- Figure 72: Asia Pacific Freight Transport Industry in India Revenue (billion), by Containerization 2025 & 2033
- Figure 73: Asia Pacific Freight Transport Industry in India Revenue Share (%), by Containerization 2025 & 2033
- Figure 74: Asia Pacific Freight Transport Industry in India Revenue (billion), by Distance 2025 & 2033
- Figure 75: Asia Pacific Freight Transport Industry in India Revenue Share (%), by Distance 2025 & 2033
- Figure 76: Asia Pacific Freight Transport Industry in India Revenue (billion), by Goods Configuration 2025 & 2033
- Figure 77: Asia Pacific Freight Transport Industry in India Revenue Share (%), by Goods Configuration 2025 & 2033
- Figure 78: Asia Pacific Freight Transport Industry in India Revenue (billion), by Temperature Control 2025 & 2033
- Figure 79: Asia Pacific Freight Transport Industry in India Revenue Share (%), by Temperature Control 2025 & 2033
- Figure 80: Asia Pacific Freight Transport Industry in India Revenue (billion), by Country 2025 & 2033
- Figure 81: Asia Pacific Freight Transport Industry in India Revenue Share (%), by Country 2025 & 2033
List of Tables
- Table 1: Global Freight Transport Industry in India Revenue billion Forecast, by End User Industry 2020 & 2033
- Table 2: Global Freight Transport Industry in India Revenue billion Forecast, by Destination 2020 & 2033
- Table 3: Global Freight Transport Industry in India Revenue billion Forecast, by Truckload Specification 2020 & 2033
- Table 4: Global Freight Transport Industry in India Revenue billion Forecast, by Containerization 2020 & 2033
- Table 5: Global Freight Transport Industry in India Revenue billion Forecast, by Distance 2020 & 2033
- Table 6: Global Freight Transport Industry in India Revenue billion Forecast, by Goods Configuration 2020 & 2033
- Table 7: Global Freight Transport Industry in India Revenue billion Forecast, by Temperature Control 2020 & 2033
- Table 8: Global Freight Transport Industry in India Revenue billion Forecast, by Region 2020 & 2033
- Table 9: Global Freight Transport Industry in India Revenue billion Forecast, by End User Industry 2020 & 2033
- Table 10: Global Freight Transport Industry in India Revenue billion Forecast, by Destination 2020 & 2033
- Table 11: Global Freight Transport Industry in India Revenue billion Forecast, by Truckload Specification 2020 & 2033
- Table 12: Global Freight Transport Industry in India Revenue billion Forecast, by Containerization 2020 & 2033
- Table 13: Global Freight Transport Industry in India Revenue billion Forecast, by Distance 2020 & 2033
- Table 14: Global Freight Transport Industry in India Revenue billion Forecast, by Goods Configuration 2020 & 2033
- Table 15: Global Freight Transport Industry in India Revenue billion Forecast, by Temperature Control 2020 & 2033
- Table 16: Global Freight Transport Industry in India Revenue billion Forecast, by Country 2020 & 2033
- Table 17: United States Freight Transport Industry in India Revenue (billion) Forecast, by Application 2020 & 2033
- Table 18: Canada Freight Transport Industry in India Revenue (billion) Forecast, by Application 2020 & 2033
- Table 19: Mexico Freight Transport Industry in India Revenue (billion) Forecast, by Application 2020 & 2033
- Table 20: Global Freight Transport Industry in India Revenue billion Forecast, by End User Industry 2020 & 2033
- Table 21: Global Freight Transport Industry in India Revenue billion Forecast, by Destination 2020 & 2033
- Table 22: Global Freight Transport Industry in India Revenue billion Forecast, by Truckload Specification 2020 & 2033
- Table 23: Global Freight Transport Industry in India Revenue billion Forecast, by Containerization 2020 & 2033
- Table 24: Global Freight Transport Industry in India Revenue billion Forecast, by Distance 2020 & 2033
- Table 25: Global Freight Transport Industry in India Revenue billion Forecast, by Goods Configuration 2020 & 2033
- Table 26: Global Freight Transport Industry in India Revenue billion Forecast, by Temperature Control 2020 & 2033
- Table 27: Global Freight Transport Industry in India Revenue billion Forecast, by Country 2020 & 2033
- Table 28: Brazil Freight Transport Industry in India Revenue (billion) Forecast, by Application 2020 & 2033
- Table 29: Argentina Freight Transport Industry in India Revenue (billion) Forecast, by Application 2020 & 2033
- Table 30: Rest of South America Freight Transport Industry in India Revenue (billion) Forecast, by Application 2020 & 2033
- Table 31: Global Freight Transport Industry in India Revenue billion Forecast, by End User Industry 2020 & 2033
- Table 32: Global Freight Transport Industry in India Revenue billion Forecast, by Destination 2020 & 2033
- Table 33: Global Freight Transport Industry in India Revenue billion Forecast, by Truckload Specification 2020 & 2033
- Table 34: Global Freight Transport Industry in India Revenue billion Forecast, by Containerization 2020 & 2033
- Table 35: Global Freight Transport Industry in India Revenue billion Forecast, by Distance 2020 & 2033
- Table 36: Global Freight Transport Industry in India Revenue billion Forecast, by Goods Configuration 2020 & 2033
- Table 37: Global Freight Transport Industry in India Revenue billion Forecast, by Temperature Control 2020 & 2033
- Table 38: Global Freight Transport Industry in India Revenue billion Forecast, by Country 2020 & 2033
- Table 39: United Kingdom Freight Transport Industry in India Revenue (billion) Forecast, by Application 2020 & 2033
- Table 40: Germany Freight Transport Industry in India Revenue (billion) Forecast, by Application 2020 & 2033
- Table 41: France Freight Transport Industry in India Revenue (billion) Forecast, by Application 2020 & 2033
- Table 42: Italy Freight Transport Industry in India Revenue (billion) Forecast, by Application 2020 & 2033
- Table 43: Spain Freight Transport Industry in India Revenue (billion) Forecast, by Application 2020 & 2033
- Table 44: Russia Freight Transport Industry in India Revenue (billion) Forecast, by Application 2020 & 2033
- Table 45: Benelux Freight Transport Industry in India Revenue (billion) Forecast, by Application 2020 & 2033
- Table 46: Nordics Freight Transport Industry in India Revenue (billion) Forecast, by Application 2020 & 2033
- Table 47: Rest of Europe Freight Transport Industry in India Revenue (billion) Forecast, by Application 2020 & 2033
- Table 48: Global Freight Transport Industry in India Revenue billion Forecast, by End User Industry 2020 & 2033
- Table 49: Global Freight Transport Industry in India Revenue billion Forecast, by Destination 2020 & 2033
- Table 50: Global Freight Transport Industry in India Revenue billion Forecast, by Truckload Specification 2020 & 2033
- Table 51: Global Freight Transport Industry in India Revenue billion Forecast, by Containerization 2020 & 2033
- Table 52: Global Freight Transport Industry in India Revenue billion Forecast, by Distance 2020 & 2033
- Table 53: Global Freight Transport Industry in India Revenue billion Forecast, by Goods Configuration 2020 & 2033
- Table 54: Global Freight Transport Industry in India Revenue billion Forecast, by Temperature Control 2020 & 2033
- Table 55: Global Freight Transport Industry in India Revenue billion Forecast, by Country 2020 & 2033
- Table 56: Turkey Freight Transport Industry in India Revenue (billion) Forecast, by Application 2020 & 2033
- Table 57: Israel Freight Transport Industry in India Revenue (billion) Forecast, by Application 2020 & 2033
- Table 58: GCC Freight Transport Industry in India Revenue (billion) Forecast, by Application 2020 & 2033
- Table 59: North Africa Freight Transport Industry in India Revenue (billion) Forecast, by Application 2020 & 2033
- Table 60: South Africa Freight Transport Industry in India Revenue (billion) Forecast, by Application 2020 & 2033
- Table 61: Rest of Middle East & Africa Freight Transport Industry in India Revenue (billion) Forecast, by Application 2020 & 2033
- Table 62: Global Freight Transport Industry in India Revenue billion Forecast, by End User Industry 2020 & 2033
- Table 63: Global Freight Transport Industry in India Revenue billion Forecast, by Destination 2020 & 2033
- Table 64: Global Freight Transport Industry in India Revenue billion Forecast, by Truckload Specification 2020 & 2033
- Table 65: Global Freight Transport Industry in India Revenue billion Forecast, by Containerization 2020 & 2033
- Table 66: Global Freight Transport Industry in India Revenue billion Forecast, by Distance 2020 & 2033
- Table 67: Global Freight Transport Industry in India Revenue billion Forecast, by Goods Configuration 2020 & 2033
- Table 68: Global Freight Transport Industry in India Revenue billion Forecast, by Temperature Control 2020 & 2033
- Table 69: Global Freight Transport Industry in India Revenue billion Forecast, by Country 2020 & 2033
- Table 70: China Freight Transport Industry in India Revenue (billion) Forecast, by Application 2020 & 2033
- Table 71: India Freight Transport Industry in India Revenue (billion) Forecast, by Application 2020 & 2033
- Table 72: Japan Freight Transport Industry in India Revenue (billion) Forecast, by Application 2020 & 2033
- Table 73: South Korea Freight Transport Industry in India Revenue (billion) Forecast, by Application 2020 & 2033
- Table 74: ASEAN Freight Transport Industry in India Revenue (billion) Forecast, by Application 2020 & 2033
- Table 75: Oceania Freight Transport Industry in India Revenue (billion) Forecast, by Application 2020 & 2033
- Table 76: Rest of Asia Pacific Freight Transport Industry in India Revenue (billion) Forecast, by Application 2020 & 2033
Frequently Asked Questions
1. What is the projected Compound Annual Growth Rate (CAGR) of the Freight Transport Industry in India?
The projected CAGR is approximately 11.5%.
2. Which companies are prominent players in the Freight Transport Industry in India?
Key companies in the market include A P Moller - Maersk, Mahindra Logistics Ltd, Nippon Express Holdings, AllCargo Logistics Ltd, Varuna Group, CJ Darcl, DHL Group, GEODIS, VRL Logistics Ltd, Delhivery Limited, Transport Corporation of India Limited (TCI), Safexpress, V-Trans, Gati Express & Supply Chain Private Limited, Expeditors International of Washington Inc.
3. What are the main segments of the Freight Transport Industry in India?
The market segments include End User Industry, Destination, Truckload Specification, Containerization, Distance, Goods Configuration, Temperature Control.
4. Can you provide details about the market size?
The market size is estimated to be USD 38.5 billion as of 2022.
5. What are some drivers contributing to market growth?
4.; Increasing demand for efficient transportation4.; Growing eCommerce industry.
6. What are the notable trends driving market growth?
OTHER KEY INDUSTRY TRENDS COVERED IN THE REPORT.
7. Are there any restraints impacting market growth?
4.; Intense competition affecting the market4.; Fluctuating fuel prices.
8. Can you provide examples of recent developments in the market?
October 2023: CJ Darcl Logistics, a diversified logistics company, and Tata Motors signed a memorandum of understanding (MoU) to strengthen CJ Darcl’s fleet of vehicles and explore options of logistics services.September 2023: Shreeji Translogistics Limited (STL) one of the large integrated national logistical solution providers in India, has entered into contract with DHL Express (India) Pvt. Ltd. for providing courier cargo under bonded trucking services.August 2023: Maersk is expanding its fleet of electric vehicles to over 500 for deployment across 26 cities covering first, middle, and last-mile distribution for one of the top e-commerce platforms in India. The expansion ties with Maersk’s ambition to become net zero across businesses and provide customers with 100% green solutions by 2040.
9. What pricing options are available for accessing the report?
Pricing options include single-user, multi-user, and enterprise licenses priced at USD 3800, USD 4500, and USD 5800 respectively.
10. Is the market size provided in terms of value or volume?
The market size is provided in terms of value, measured in billion.
11. Are there any specific market keywords associated with the report?
Yes, the market keyword associated with the report is "Freight Transport Industry in India," which aids in identifying and referencing the specific market segment covered.
12. How do I determine which pricing option suits my needs best?
The pricing options vary based on user requirements and access needs. Individual users may opt for single-user licenses, while businesses requiring broader access may choose multi-user or enterprise licenses for cost-effective access to the report.
13. Are there any additional resources or data provided in the Freight Transport Industry in India report?
While the report offers comprehensive insights, it's advisable to review the specific contents or supplementary materials provided to ascertain if additional resources or data are available.
14. How can I stay updated on further developments or reports in the Freight Transport Industry in India?
To stay informed about further developments, trends, and reports in the Freight Transport Industry in India, consider subscribing to industry newsletters, following relevant companies and organizations, or regularly checking reputable industry news sources and publications.
Methodology
Step 1 - Identification of Relevant Samples Size from Population Database


Step 2 - Approaches for Defining Global Market Size (Value, Volume* & Price*)

Note*: In applicable scenarios
Step 3 - Data Sources
Primary Research
- Web Analytics
- Survey Reports
- Research Institute
- Latest Research Reports
- Opinion Leaders
Secondary Research
- Annual Reports
- White Paper
- Latest Press Release
- Industry Association
- Paid Database
- Investor Presentations

Step 4 - Data Triangulation
Involves using different sources of information in order to increase the validity of a study
These sources are likely to be stakeholders in a program - participants, other researchers, program staff, other community members, and so on.
Then we put all data in single framework & apply various statistical tools to find out the dynamic on the market.
During the analysis stage, feedback from the stakeholder groups would be compared to determine areas of agreement as well as areas of divergence