

Key Insights
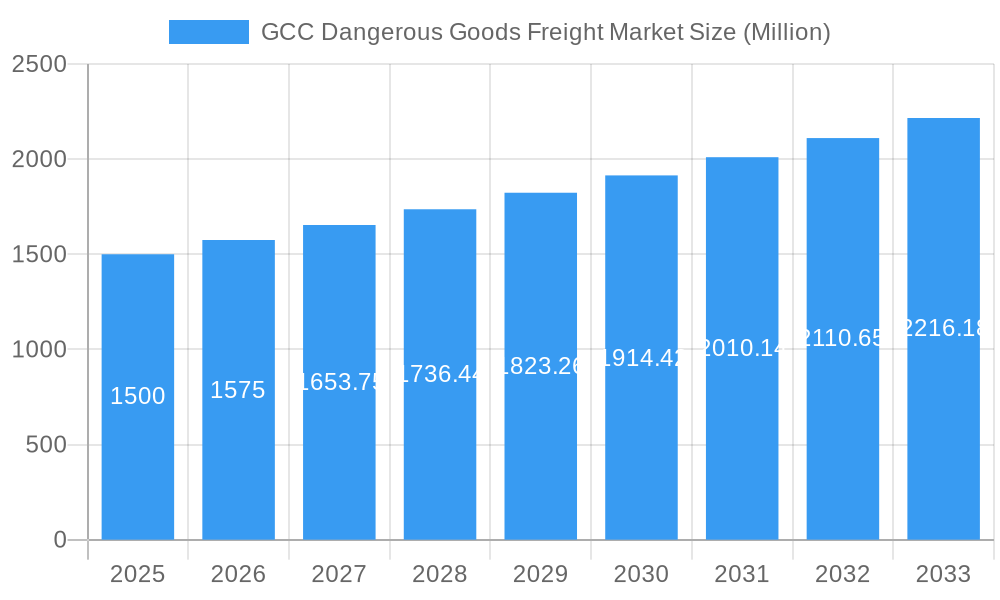
The GCC Dangerous Goods Freight market is experiencing robust growth, driven by the region's expanding industrial sector, particularly in petrochemicals, pharmaceuticals, and manufacturing. The increasing volume of hazardous materials necessitates specialized transportation and handling, fueling demand for sophisticated logistics services. A Compound Annual Growth Rate (CAGR) exceeding 5% indicates a consistently expanding market, projected to reach significant value by 2033. Key growth drivers include stringent regulatory compliance requirements for safe handling of dangerous goods, leading to increased investment in specialized infrastructure and technology. Furthermore, the rising e-commerce sector and associated cross-border shipments contribute to market expansion, albeit with a need for enhanced safety protocols. While the market faces restraints such as fluctuating oil prices (impacting petrochemical transportation) and geopolitical instability, these are largely offset by the sustained growth in various other sectors requiring dangerous goods logistics. The market segmentation by service type (transportation, warehousing, value-added services) and by country (Saudi Arabia, UAE, Kuwait, Qatar, Bahrain, Oman) offers opportunities for specialized logistics providers to focus on specific niches and capitalize on regional variations in demand. Competition is intense, with both global logistics giants and regional players vying for market share. The market's future trajectory points towards increased technological adoption, including advanced tracking systems and digital platforms, enhancing efficiency, transparency, and safety.
GCC Dangerous Goods Freight Market Market Size (In Billion)
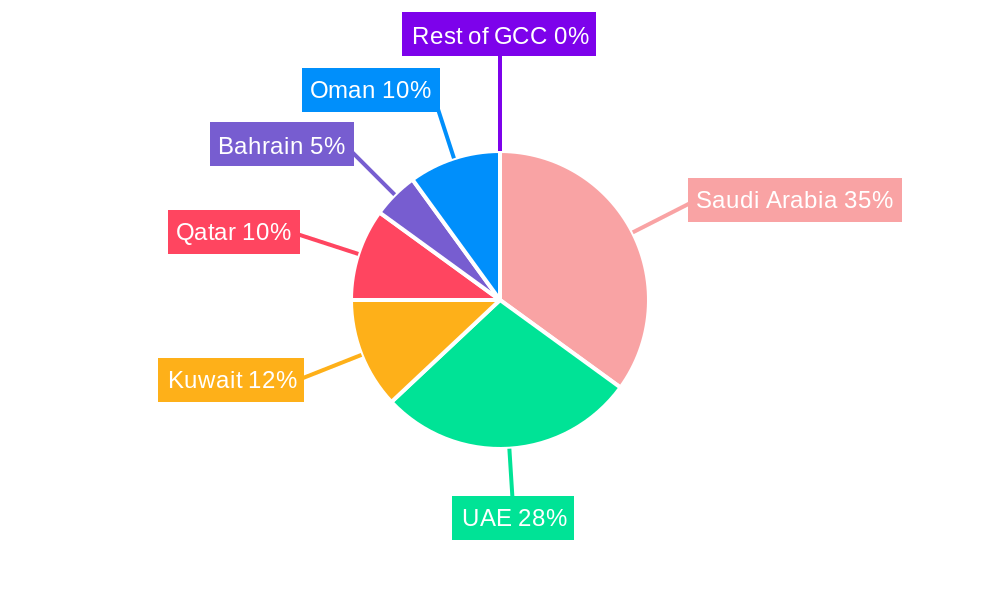
The GCC Dangerous Goods Freight market is geographically concentrated within the six Gulf Cooperation Council (GCC) nations, with Saudi Arabia and the UAE holding the largest market shares due to their significant industrial bases and port infrastructure. However, other GCC countries are also experiencing considerable growth, driven by infrastructure development and diversification of their economies. The market demonstrates a clear preference for reliable and compliant logistics providers, emphasizing the importance of safety certifications and adherence to international standards. Value-added services, such as specialized packaging, labeling, and customs brokerage, are gaining traction as clients seek streamlined and compliant solutions. Future market dynamics will be shaped by the evolving regulatory landscape, technological innovations, and the ongoing development of robust supply chains capable of handling the increasing volume and complexity of dangerous goods transportation. Growth is expected to remain strong, presenting attractive investment opportunities for companies operating in this sector.
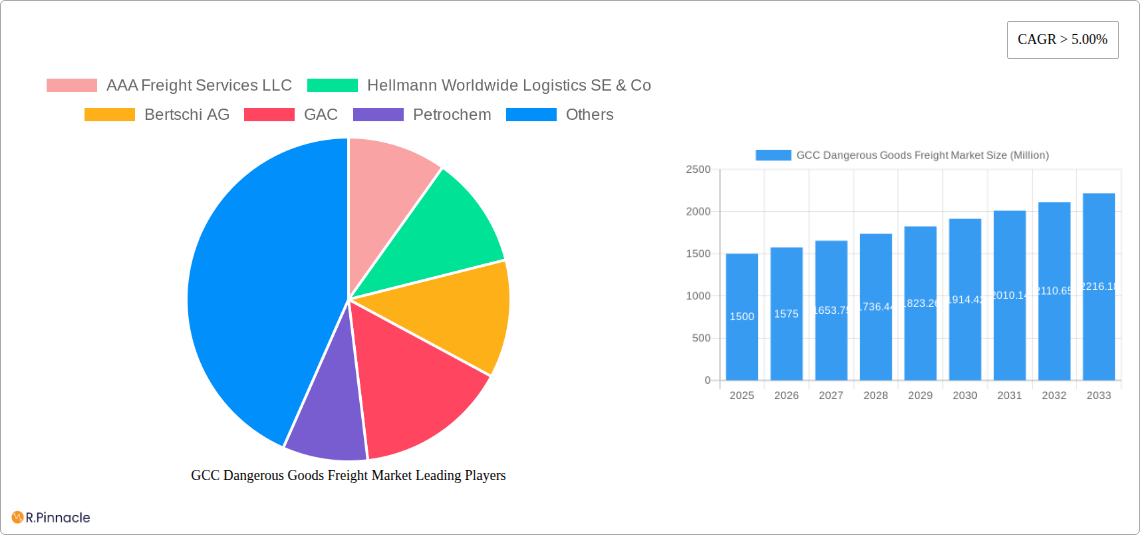
GCC Dangerous Goods Freight Market Company Market Share
GCC Dangerous Goods Freight Market Report: 2019-2033
This comprehensive report provides an in-depth analysis of the GCC Dangerous Goods Freight Market, offering valuable insights for industry professionals, investors, and strategic decision-makers. Covering the period from 2019 to 2033, with a base year of 2025, this report forecasts market trends and growth opportunities within this specialized sector.
GCC Dangerous Goods Freight Market Structure & Innovation Trends
The GCC Dangerous Goods Freight Market exhibits a moderately concentrated structure, with several key players holding significant market share. AAA Freight Services LLC, Hellmann Worldwide Logistics SE & Co, Bertschi AG, GAC, Petrochem, Agility, Al Ghazal Transport UAE, BDP INTERNATIONAL, Al Futtaim - Logistics, and TALKE Group are among the prominent companies shaping the market landscape. The exact market share for each company remains confidential but the market concentration is estimated to be around xx%. Innovation is driven by stricter regulatory frameworks surrounding the transportation of hazardous materials, pushing companies to adopt advanced technologies for improved safety and tracking. Product substitutes are limited due to the specialized nature of handling dangerous goods. M&A activities, such as the recent acquisition of Cargo Logistics Group by Magnate Worldwide (detailed further in the Key Developments section), highlight consolidation trends and strategic expansion within the market. The estimated value of this deal is xx Million. End-user demographics are primarily industrial sectors (petrochemicals, chemicals, pharmaceuticals) with significant reliance on efficient and compliant transportation networks.
GCC Dangerous Goods Freight Market Dynamics & Trends
The GCC Dangerous Goods Freight Market is experiencing robust growth, driven primarily by the expansion of the industrial sector, increased cross-border trade, and rising demand for specialized logistics solutions. Technological disruptions, such as the adoption of digital platforms for tracking and management of hazardous materials, are transforming industry operations. The market is projected to achieve a Compound Annual Growth Rate (CAGR) of xx% during the forecast period (2025-2033), and market penetration for advanced technologies is expected to reach xx% by 2033. Consumer preferences, driven by a need for enhanced safety, transparency, and reliability, are pushing companies to enhance their services and technology adoption. Competitive dynamics are characterized by a mix of established players and emerging companies focusing on niche segments and innovative solutions.
Dominant Regions & Segments in GCC Dangerous Goods Freight Market
The United Arab Emirates (UAE) currently holds the leading position in the GCC Dangerous Goods Freight Market, followed closely by Saudi Arabia.
Key Drivers for UAE Dominance:
- Strategic geographic location
- Well-developed infrastructure
- Proactive regulatory environment
- High concentration of industrial activities
Key Drivers for Saudi Arabia's Strong Presence:
- Significant oil and gas sector activity
- Government initiatives promoting industrial diversification
- Large-scale infrastructure development projects
Segment Analysis:
- Transportation: This segment dominates the market, accounting for xx Million in revenue in 2025. Growth is fueled by increasing demand for efficient and safe transportation of dangerous goods.
- Warehousing and Inventory Management: This segment is expected to witness significant growth due to the increasing need for secure storage facilities specialized in handling hazardous materials. Projected revenue is xx Million in 2025.
- Value-added Services: This segment is experiencing growth as companies seek comprehensive solutions encompassing customs brokerage, documentation, and specialized handling. 2025 revenue is predicted at xx Million.
GCC Dangerous Goods Freight Market Product Innovations
Recent product innovations in the GCC Dangerous Goods Freight Market are revolutionizing safety, tracking, and operational efficiency. We are witnessing a surge in the adoption of advanced, real-time tracking systems that provide granular visibility throughout the supply chain. Alongside this, specialized, intelligent containers are being developed, incorporating enhanced safety features and smart monitoring for hazardous materials. Furthermore, digital platforms are becoming indispensable, streamlining documentation management and facilitating seamless communication between stakeholders. These advancements not only ensure robust compliance with evolving regulatory standards but also significantly boost supply chain transparency and resilience. The market fit for these cutting-edge technologies is exceptionally strong, driven by a pervasive industry-wide commitment to proactive risk mitigation and the pursuit of optimized operational performance.
Report Scope & Segmentation Analysis
This comprehensive report provides an in-depth analysis of the GCC Dangerous Goods Freight Market, meticulously segmenting it by key parameters including:
- Service Type: Transportation (road, sea, air), Warehousing and Inventory Management, and Value-added Services (e.g., packaging, labeling, disposal).
- Country: Detailed insights into Saudi Arabia, United Arab Emirates, Kuwait, Qatar, Bahrain, and Oman.
For each segment, we offer detailed growth projections, current market size estimations, and a thorough analysis of competitive dynamics. The GCC Dangerous Goods Freight Market is projected to reach an impressive size of xx Million by 2033, exhibiting robust growth driven by increasing trade volumes and stringent safety mandates.
Key Drivers of GCC Dangerous Goods Freight Market Growth
Several factors drive the growth of the GCC Dangerous Goods Freight Market, including:
- Expansion of industrial sectors, especially petrochemicals and chemicals.
- Rising cross-border trade within the GCC and beyond.
- Stringent regulatory requirements necessitating specialized logistics solutions.
- Increased investments in advanced tracking and management technologies.
Challenges in the GCC Dangerous Goods Freight Market Sector
Navigating the GCC Dangerous Goods Freight Market presents a unique set of challenges for industry participants:
- Stringent Regulatory Landscape: The region's increasingly rigorous and evolving regulations surrounding the handling, transportation, and storage of dangerous goods necessitate significant investment in compliance, impacting operational costs and requiring constant adaptation.
- Supply Chain Vulnerability: The inherent susceptibility of supply chains to disruptions, whether stemming from geopolitical shifts, natural disasters, or unforeseen logistical impediments, poses a significant risk to the timely and secure delivery of hazardous materials.
- Intensified Competition: The market is characterized by fierce competition, with both well-established global logistics providers and agile, emerging regional players vying for market share, demanding continuous innovation and service differentiation.
- Infrastructure Development Gaps: While significant progress has been made, certain areas may still face infrastructure limitations that can impact the efficiency and safety of transporting specialized cargo.
- Talent Acquisition and Training: Ensuring a skilled workforce with the necessary expertise in handling dangerous goods and adhering to safety protocols remains a critical challenge for many operators.
Emerging Opportunities in GCC Dangerous Goods Freight Market
Opportunities exist in:
- The development and adoption of innovative technologies like AI and IoT for enhanced safety and efficiency.
- Expansion into niche segments with specialized hazardous materials handling needs.
- Leveraging digitalization for improved supply chain transparency and visibility.
Leading Players in the GCC Dangerous Goods Freight Market Market
- AAA Freight Services LLC
- Hellmann Worldwide Logistics SE & Co
- Bertschi AG
- GAC
- Petrochem
- Agility
- Al Ghazal Transport UAE
- BDP INTERNATIONAL
- Al Futtaim - Logistics
- TALKE Group
Key Developments in GCC Dangerous Goods Freight Market Industry
- June 2023: Magnate Worldwide acquires Cargo Logistics Group, expanding its presence and capabilities in the dangerous goods logistics sector.
- April 2023: dnata adopts IATA's 'Connect API,' furthering digitalization in air cargo and streamlining dangerous goods handling processes.
Future Outlook for GCC Dangerous Goods Freight Market Market
The GCC Dangerous Goods Freight Market exhibits strong future potential, driven by continuous industrial growth, technological advancements, and increasing demand for safe and efficient logistics solutions. Strategic partnerships, investments in technology, and expansion into new segments will be crucial for companies seeking to capitalize on emerging opportunities within this dynamic market. The market is projected to reach xx Million by 2033.
GCC Dangerous Goods Freight Market Segmentation
-
1. Service
- 1.1. Transportation
- 1.2. Warehousing and Inventory Management
- 1.3. Value-added Services
GCC Dangerous Goods Freight Market Segmentation By Geography
-
1. North America
- 1.1. United States
- 1.2. Canada
- 1.3. Mexico
-
2. South America
- 2.1. Brazil
- 2.2. Argentina
- 2.3. Rest of South America
-
3. Europe
- 3.1. United Kingdom
- 3.2. Germany
- 3.3. France
- 3.4. Italy
- 3.5. Spain
- 3.6. Russia
- 3.7. Benelux
- 3.8. Nordics
- 3.9. Rest of Europe
-
4. Middle East & Africa
- 4.1. Turkey
- 4.2. Israel
- 4.3. GCC
- 4.4. North Africa
- 4.5. South Africa
- 4.6. Rest of Middle East & Africa
-
5. Asia Pacific
- 5.1. China
- 5.2. India
- 5.3. Japan
- 5.4. South Korea
- 5.5. ASEAN
- 5.6. Oceania
- 5.7. Rest of Asia Pacific
GCC Dangerous Goods Freight Market Regional Market Share
Geographic Coverage of GCC Dangerous Goods Freight Market
GCC Dangerous Goods Freight Market REPORT HIGHLIGHTS
| Aspects | Details |
|---|---|
| Study Period | 2020-2034 |
| Base Year | 2025 |
| Estimated Year | 2026 |
| Forecast Period | 2026-2034 |
| Historical Period | 2020-2025 |
| Growth Rate | CAGR of > 5.00% from 2020-2034 |
| Segmentation |
|
Table of Contents
- 1. Introduction
- 1.1. Research Scope
- 1.2. Market Segmentation
- 1.3. Research Objective
- 1.4. Definitions and Assumptions
- 2. Executive Summary
- 2.1. Market Snapshot
- 3. Market Dynamics
- 3.1. Market Drivers
- 3.2. Market Restrains
- 3.3. Market Trends
- 3.4. Market Opportunities
- 4. Market Factor Analysis
- 4.1. Porters Five Forces
- 4.1.1. Bargaining Power of Suppliers
- 4.1.2. Bargaining Power of Buyers
- 4.1.3. Threat of New Entrants
- 4.1.4. Threat of Substitutes
- 4.1.5. Competitive Rivalry
- 4.2. PESTEL analysis
- 4.3. BCG Analysis
- 4.3.1. Stars (High Growth, High Market Share)
- 4.3.2. Cash Cows (Low Growth, High Market Share)
- 4.3.3. Question Mark (High Growth, Low Market Share)
- 4.3.4. Dogs (Low Growth, Low Market Share)
- 4.4. Ansoff Matrix Analysis
- 4.5. Supply Chain Analysis
- 4.6. Regulatory Landscape
- 4.7. Current Market Potential and Opportunity Assessment (TAM–SAM–SOM Framework)
- 4.8. PRI Analyst Note
- 4.1. Porters Five Forces
- 5. Market Analysis, Insights and Forecast 2021-2033
- 5.1. Market Analysis, Insights and Forecast - by Service
- 5.1.1. Transportation
- 5.1.2. Warehousing and Inventory Management
- 5.1.3. Value-added Services
- 5.2. Market Analysis, Insights and Forecast - by Region
- 5.2.1. North America
- 5.2.2. South America
- 5.2.3. Europe
- 5.2.4. Middle East & Africa
- 5.2.5. Asia Pacific
- 5.1. Market Analysis, Insights and Forecast - by Service
- 6. Global GCC Dangerous Goods Freight Market Analysis, Insights and Forecast, 2021-2033
- 6.1. Market Analysis, Insights and Forecast - by Service
- 6.1.1. Transportation
- 6.1.2. Warehousing and Inventory Management
- 6.1.3. Value-added Services
- 6.1. Market Analysis, Insights and Forecast - by Service
- 7. North America GCC Dangerous Goods Freight Market Analysis, Insights and Forecast, 2020-2032
- 7.1. Market Analysis, Insights and Forecast - by Service
- 7.1.1. Transportation
- 7.1.2. Warehousing and Inventory Management
- 7.1.3. Value-added Services
- 7.1. Market Analysis, Insights and Forecast - by Service
- 8. South America GCC Dangerous Goods Freight Market Analysis, Insights and Forecast, 2020-2032
- 8.1. Market Analysis, Insights and Forecast - by Service
- 8.1.1. Transportation
- 8.1.2. Warehousing and Inventory Management
- 8.1.3. Value-added Services
- 8.1. Market Analysis, Insights and Forecast - by Service
- 9. Europe GCC Dangerous Goods Freight Market Analysis, Insights and Forecast, 2020-2032
- 9.1. Market Analysis, Insights and Forecast - by Service
- 9.1.1. Transportation
- 9.1.2. Warehousing and Inventory Management
- 9.1.3. Value-added Services
- 9.1. Market Analysis, Insights and Forecast - by Service
- 10. Middle East & Africa GCC Dangerous Goods Freight Market Analysis, Insights and Forecast, 2020-2032
- 10.1. Market Analysis, Insights and Forecast - by Service
- 10.1.1. Transportation
- 10.1.2. Warehousing and Inventory Management
- 10.1.3. Value-added Services
- 10.1. Market Analysis, Insights and Forecast - by Service
- 11. Asia Pacific GCC Dangerous Goods Freight Market Analysis, Insights and Forecast, 2020-2032
- 11.1. Market Analysis, Insights and Forecast - by Service
- 11.1.1. Transportation
- 11.1.2. Warehousing and Inventory Management
- 11.1.3. Value-added Services
- 11.1. Market Analysis, Insights and Forecast - by Service
- 12. Competitive Analysis
- 12.1. Company Profiles
- 12.1.1 AAA Freight Services LLC
- 12.1.1.1. Company Overview
- 12.1.1.2. Products
- 12.1.1.3. Company Financials
- 12.1.1.4. SWOT Analysis
- 12.1.2 Hellmann Worldwide Logistics SE & Co
- 12.1.2.1. Company Overview
- 12.1.2.2. Products
- 12.1.2.3. Company Financials
- 12.1.2.4. SWOT Analysis
- 12.1.3 Bertschi AG
- 12.1.3.1. Company Overview
- 12.1.3.2. Products
- 12.1.3.3. Company Financials
- 12.1.3.4. SWOT Analysis
- 12.1.4 GAC
- 12.1.4.1. Company Overview
- 12.1.4.2. Products
- 12.1.4.3. Company Financials
- 12.1.4.4. SWOT Analysis
- 12.1.5 Petrochem
- 12.1.5.1. Company Overview
- 12.1.5.2. Products
- 12.1.5.3. Company Financials
- 12.1.5.4. SWOT Analysis
- 12.1.6 Agility
- 12.1.6.1. Company Overview
- 12.1.6.2. Products
- 12.1.6.3. Company Financials
- 12.1.6.4. SWOT Analysis
- 12.1.7 Al Ghazal Transport UAE**List Not Exhaustive
- 12.1.7.1. Company Overview
- 12.1.7.2. Products
- 12.1.7.3. Company Financials
- 12.1.7.4. SWOT Analysis
- 12.1.8 BDP INTERNATIONAL
- 12.1.8.1. Company Overview
- 12.1.8.2. Products
- 12.1.8.3. Company Financials
- 12.1.8.4. SWOT Analysis
- 12.1.9 Al Futtaim - Logistics
- 12.1.9.1. Company Overview
- 12.1.9.2. Products
- 12.1.9.3. Company Financials
- 12.1.9.4. SWOT Analysis
- 12.1.10 TALKE Group
- 12.1.10.1. Company Overview
- 12.1.10.2. Products
- 12.1.10.3. Company Financials
- 12.1.10.4. SWOT Analysis
- 12.1.1 AAA Freight Services LLC
- 12.2. Market Entropy
- 12.2.1 Company's Key Areas Served
- 12.2.2 Recent Developments
- 12.3. Company Market Share Analysis 2025
- 12.3.1 Top 5 Companies Market Share Analysis
- 12.3.2 Top 3 Companies Market Share Analysis
- 12.4. List of Potential Customers
- 13. Research Methodology
List of Figures
- Figure 1: Global GCC Dangerous Goods Freight Market Revenue Breakdown (Million, %) by Region 2025 & 2033
- Figure 2: North America GCC Dangerous Goods Freight Market Revenue (Million), by Service 2025 & 2033
- Figure 3: North America GCC Dangerous Goods Freight Market Revenue Share (%), by Service 2025 & 2033
- Figure 4: North America GCC Dangerous Goods Freight Market Revenue (Million), by Country 2025 & 2033
- Figure 5: North America GCC Dangerous Goods Freight Market Revenue Share (%), by Country 2025 & 2033
- Figure 6: South America GCC Dangerous Goods Freight Market Revenue (Million), by Service 2025 & 2033
- Figure 7: South America GCC Dangerous Goods Freight Market Revenue Share (%), by Service 2025 & 2033
- Figure 8: South America GCC Dangerous Goods Freight Market Revenue (Million), by Country 2025 & 2033
- Figure 9: South America GCC Dangerous Goods Freight Market Revenue Share (%), by Country 2025 & 2033
- Figure 10: Europe GCC Dangerous Goods Freight Market Revenue (Million), by Service 2025 & 2033
- Figure 11: Europe GCC Dangerous Goods Freight Market Revenue Share (%), by Service 2025 & 2033
- Figure 12: Europe GCC Dangerous Goods Freight Market Revenue (Million), by Country 2025 & 2033
- Figure 13: Europe GCC Dangerous Goods Freight Market Revenue Share (%), by Country 2025 & 2033
- Figure 14: Middle East & Africa GCC Dangerous Goods Freight Market Revenue (Million), by Service 2025 & 2033
- Figure 15: Middle East & Africa GCC Dangerous Goods Freight Market Revenue Share (%), by Service 2025 & 2033
- Figure 16: Middle East & Africa GCC Dangerous Goods Freight Market Revenue (Million), by Country 2025 & 2033
- Figure 17: Middle East & Africa GCC Dangerous Goods Freight Market Revenue Share (%), by Country 2025 & 2033
- Figure 18: Asia Pacific GCC Dangerous Goods Freight Market Revenue (Million), by Service 2025 & 2033
- Figure 19: Asia Pacific GCC Dangerous Goods Freight Market Revenue Share (%), by Service 2025 & 2033
- Figure 20: Asia Pacific GCC Dangerous Goods Freight Market Revenue (Million), by Country 2025 & 2033
- Figure 21: Asia Pacific GCC Dangerous Goods Freight Market Revenue Share (%), by Country 2025 & 2033
List of Tables
- Table 1: Global GCC Dangerous Goods Freight Market Revenue Million Forecast, by Service 2020 & 2033
- Table 2: Global GCC Dangerous Goods Freight Market Revenue Million Forecast, by Region 2020 & 2033
- Table 3: Global GCC Dangerous Goods Freight Market Revenue Million Forecast, by Service 2020 & 2033
- Table 4: Global GCC Dangerous Goods Freight Market Revenue Million Forecast, by Country 2020 & 2033
- Table 5: United States GCC Dangerous Goods Freight Market Revenue (Million) Forecast, by Application 2020 & 2033
- Table 6: Canada GCC Dangerous Goods Freight Market Revenue (Million) Forecast, by Application 2020 & 2033
- Table 7: Mexico GCC Dangerous Goods Freight Market Revenue (Million) Forecast, by Application 2020 & 2033
- Table 8: Global GCC Dangerous Goods Freight Market Revenue Million Forecast, by Service 2020 & 2033
- Table 9: Global GCC Dangerous Goods Freight Market Revenue Million Forecast, by Country 2020 & 2033
- Table 10: Brazil GCC Dangerous Goods Freight Market Revenue (Million) Forecast, by Application 2020 & 2033
- Table 11: Argentina GCC Dangerous Goods Freight Market Revenue (Million) Forecast, by Application 2020 & 2033
- Table 12: Rest of South America GCC Dangerous Goods Freight Market Revenue (Million) Forecast, by Application 2020 & 2033
- Table 13: Global GCC Dangerous Goods Freight Market Revenue Million Forecast, by Service 2020 & 2033
- Table 14: Global GCC Dangerous Goods Freight Market Revenue Million Forecast, by Country 2020 & 2033
- Table 15: United Kingdom GCC Dangerous Goods Freight Market Revenue (Million) Forecast, by Application 2020 & 2033
- Table 16: Germany GCC Dangerous Goods Freight Market Revenue (Million) Forecast, by Application 2020 & 2033
- Table 17: France GCC Dangerous Goods Freight Market Revenue (Million) Forecast, by Application 2020 & 2033
- Table 18: Italy GCC Dangerous Goods Freight Market Revenue (Million) Forecast, by Application 2020 & 2033
- Table 19: Spain GCC Dangerous Goods Freight Market Revenue (Million) Forecast, by Application 2020 & 2033
- Table 20: Russia GCC Dangerous Goods Freight Market Revenue (Million) Forecast, by Application 2020 & 2033
- Table 21: Benelux GCC Dangerous Goods Freight Market Revenue (Million) Forecast, by Application 2020 & 2033
- Table 22: Nordics GCC Dangerous Goods Freight Market Revenue (Million) Forecast, by Application 2020 & 2033
- Table 23: Rest of Europe GCC Dangerous Goods Freight Market Revenue (Million) Forecast, by Application 2020 & 2033
- Table 24: Global GCC Dangerous Goods Freight Market Revenue Million Forecast, by Service 2020 & 2033
- Table 25: Global GCC Dangerous Goods Freight Market Revenue Million Forecast, by Country 2020 & 2033
- Table 26: Turkey GCC Dangerous Goods Freight Market Revenue (Million) Forecast, by Application 2020 & 2033
- Table 27: Israel GCC Dangerous Goods Freight Market Revenue (Million) Forecast, by Application 2020 & 2033
- Table 28: GCC GCC Dangerous Goods Freight Market Revenue (Million) Forecast, by Application 2020 & 2033
- Table 29: North Africa GCC Dangerous Goods Freight Market Revenue (Million) Forecast, by Application 2020 & 2033
- Table 30: South Africa GCC Dangerous Goods Freight Market Revenue (Million) Forecast, by Application 2020 & 2033
- Table 31: Rest of Middle East & Africa GCC Dangerous Goods Freight Market Revenue (Million) Forecast, by Application 2020 & 2033
- Table 32: Global GCC Dangerous Goods Freight Market Revenue Million Forecast, by Service 2020 & 2033
- Table 33: Global GCC Dangerous Goods Freight Market Revenue Million Forecast, by Country 2020 & 2033
- Table 34: China GCC Dangerous Goods Freight Market Revenue (Million) Forecast, by Application 2020 & 2033
- Table 35: India GCC Dangerous Goods Freight Market Revenue (Million) Forecast, by Application 2020 & 2033
- Table 36: Japan GCC Dangerous Goods Freight Market Revenue (Million) Forecast, by Application 2020 & 2033
- Table 37: South Korea GCC Dangerous Goods Freight Market Revenue (Million) Forecast, by Application 2020 & 2033
- Table 38: ASEAN GCC Dangerous Goods Freight Market Revenue (Million) Forecast, by Application 2020 & 2033
- Table 39: Oceania GCC Dangerous Goods Freight Market Revenue (Million) Forecast, by Application 2020 & 2033
- Table 40: Rest of Asia Pacific GCC Dangerous Goods Freight Market Revenue (Million) Forecast, by Application 2020 & 2033
Frequently Asked Questions
1. What is the projected Compound Annual Growth Rate (CAGR) of the GCC Dangerous Goods Freight Market?
The projected CAGR is approximately > 5.00%.
2. Which companies are prominent players in the GCC Dangerous Goods Freight Market?
Key companies in the market include AAA Freight Services LLC, Hellmann Worldwide Logistics SE & Co, Bertschi AG, GAC, Petrochem, Agility, Al Ghazal Transport UAE**List Not Exhaustive, BDP INTERNATIONAL, Al Futtaim - Logistics, TALKE Group.
3. What are the main segments of the GCC Dangerous Goods Freight Market?
The market segments include Service.
4. Can you provide details about the market size?
The market size is estimated to be USD XX Million as of 2022.
5. What are some drivers contributing to market growth?
Growing Chemical and Refinery Industries Driving Market Growth.
6. What are the notable trends driving market growth?
Recovery of Chemical Industry.
7. Are there any restraints impacting market growth?
Challenges in Cross Boarder Shipping.
8. Can you provide examples of recent developments in the market?
June 2023: Magnate Worldwide is pleased to announce the acquisition of Cargo Logistics Group, a leading custom logistics service provider. In line with Magnate's organic and M&A growth strategy, Cargo Logistics Group is highly specialized, providing comprehensive logistics solutions for international and domestic mission-critical supply chains. CLG will become part of Masterpiece International and expand its footprint, adding a direct presence in the Baltimore and Washington DC area
9. What pricing options are available for accessing the report?
Pricing options include single-user, multi-user, and enterprise licenses priced at USD 3800, USD 4500, and USD 5800 respectively.
10. Is the market size provided in terms of value or volume?
The market size is provided in terms of value, measured in Million.
11. Are there any specific market keywords associated with the report?
Yes, the market keyword associated with the report is "GCC Dangerous Goods Freight Market," which aids in identifying and referencing the specific market segment covered.
12. How do I determine which pricing option suits my needs best?
The pricing options vary based on user requirements and access needs. Individual users may opt for single-user licenses, while businesses requiring broader access may choose multi-user or enterprise licenses for cost-effective access to the report.
13. Are there any additional resources or data provided in the GCC Dangerous Goods Freight Market report?
While the report offers comprehensive insights, it's advisable to review the specific contents or supplementary materials provided to ascertain if additional resources or data are available.
14. How can I stay updated on further developments or reports in the GCC Dangerous Goods Freight Market?
To stay informed about further developments, trends, and reports in the GCC Dangerous Goods Freight Market, consider subscribing to industry newsletters, following relevant companies and organizations, or regularly checking reputable industry news sources and publications.
Methodology
Step 1 - Identification of Relevant Samples Size from Population Database


Step 2 - Approaches for Defining Global Market Size (Value, Volume* & Price*)

Note*: In applicable scenarios
Step 3 - Data Sources
Primary Research
- Web Analytics
- Survey Reports
- Research Institute
- Latest Research Reports
- Opinion Leaders
Secondary Research
- Annual Reports
- White Paper
- Latest Press Release
- Industry Association
- Paid Database
- Investor Presentations

Step 4 - Data Triangulation
Involves using different sources of information in order to increase the validity of a study
These sources are likely to be stakeholders in a program - participants, other researchers, program staff, other community members, and so on.
Then we put all data in single framework & apply various statistical tools to find out the dynamic on the market.
During the analysis stage, feedback from the stakeholder groups would be compared to determine areas of agreement as well as areas of divergence