

Key Insights
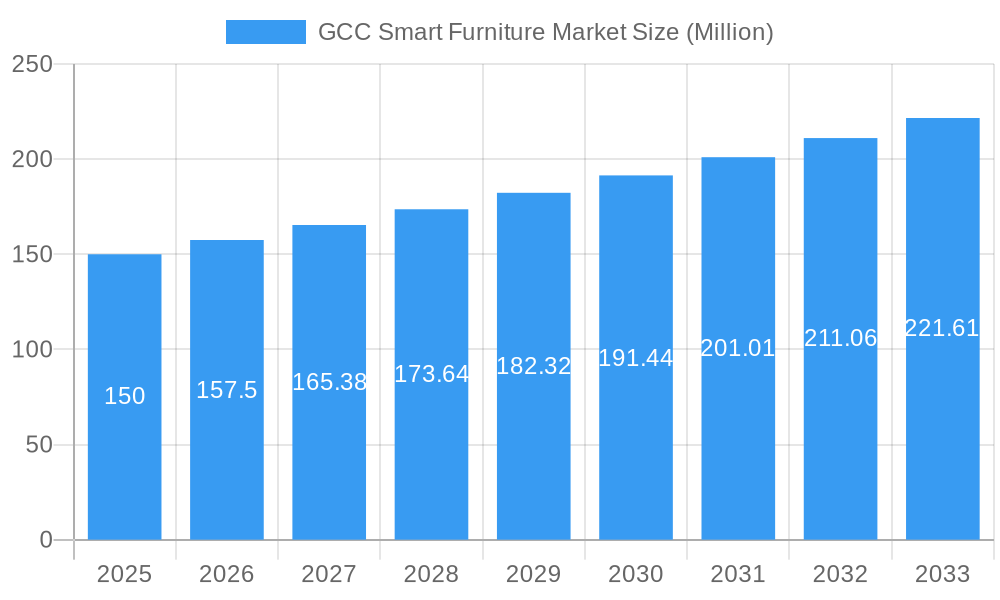
The GCC smart furniture market is experiencing significant expansion, driven by rising disposable incomes, rapid urbanization, and a growing preference for technologically advanced home furnishings. The market is projected to reach $15.61 billion by 2025, with a Compound Annual Growth Rate (CAGR) of 7.54%. Key growth drivers include the increasing adoption of smart home technologies, demand for ergonomic and customizable furniture, and the proliferation of connected devices. The residential segment currently leads market share, fueled by demand for enhanced comfort and convenience. The commercial sector is emerging as a substantial growth area, with businesses seeking smart solutions to optimize workspace efficiency. Distribution channels are shifting towards online sales, complementing traditional retail outlets. Popular product categories include smart tables, desks, chairs, beds, and sofas. Leading players like IKEA and regional brands are actively driving innovation and competition.
GCC Smart Furniture Market Market Size (In Billion)
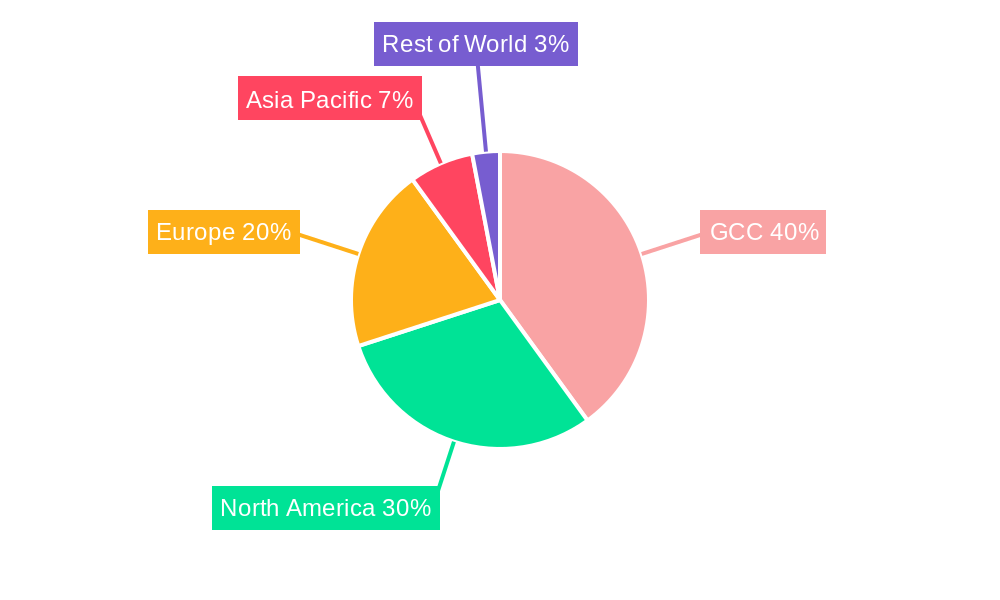
Market segmentation highlights specific opportunities. While North America and Europe are established markets, the GCC region shows surging demand due to its young, tech-savvy demographic. Successful GCC market penetration requires adapting to regional preferences, offering products aligned with local aesthetics and cultural norms, and establishing robust distribution networks. Further market growth will be driven by strategic partnerships with local retailers, collaborations with technology companies for smart integrations, and targeted marketing towards digitally engaged consumers. Competitive advantages will be derived from innovative features, superior quality, and seamless integration with smart home ecosystems.
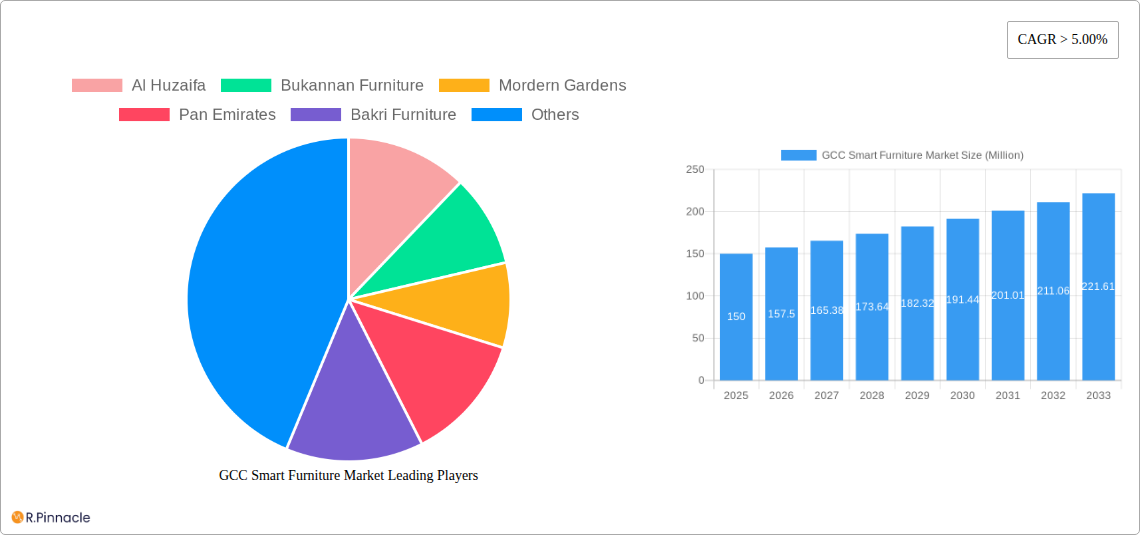
GCC Smart Furniture Market Company Market Share
GCC Smart Furniture Market: A Comprehensive Report (2019-2033)
This comprehensive report provides an in-depth analysis of the GCC smart furniture market, offering valuable insights for industry professionals, investors, and strategists. Covering the period from 2019 to 2033, with a focus on 2025, this report unveils the market's structure, dynamics, and future potential. The analysis includes detailed segmentation by end-user (residential, commercial), distribution channel (multi-brand stores, specialty stores, online, other), and product type (smart tables, smart desks, smart chairs, other smart furniture). Key players like Al Huzaifa, Bukannan Furniture, Mordern Gardens, Pan Emirates, Bakri Furniture, Schuco, Ikea, Sagtco, and Royal Furniture are profiled, providing a competitive landscape overview. The report also examines market size, growth rate (CAGR), market penetration, and key trends influencing market evolution.
GCC Smart Furniture Market Structure & Innovation Trends
This section analyzes the GCC smart furniture market's structure, highlighting market concentration, innovation drivers, and regulatory influences. We examine the competitive landscape, including market share data for key players and the impact of mergers and acquisitions (M&A) activities. The analysis includes:
- Market Concentration: The GCC smart furniture market exhibits a [xx]% concentration ratio, with [xx] players controlling [xx]% of the market share in 2025. Smaller players account for the remaining [xx]%.
- Innovation Drivers: Key drivers include advancements in IoT technology, increasing consumer demand for smart home solutions, and government initiatives promoting smart city development.
- Regulatory Framework: Regulations regarding data privacy and product safety influence market growth. [Describe specific regulations and their impact].
- Product Substitutes: Traditional furniture poses a significant competitive threat. The report analyzes the competitive pressures from these substitutes.
- End-User Demographics: The growing young population and rising disposable incomes in the GCC region fuel demand for smart furniture, particularly in residential settings.
- M&A Activities: [xx] M&A deals were recorded between [Start Year] and [End Year], with a total estimated value of [xx] Million. These deals primarily involved [describe types of deals, e.g., acquisitions of smaller players by larger firms].
GCC Smart Furniture Market Dynamics & Trends
This section delves into the market's growth drivers, technological disruptions, consumer preferences, and competitive dynamics. The analysis includes:
The GCC smart furniture market is projected to witness robust growth, driven by factors such as increasing urbanization, rising disposable incomes, and a preference for technologically advanced home furnishings. Technological advancements, including the integration of AI and IoT, are revolutionizing the industry, creating new possibilities for smart furniture functionalities and personalized user experiences. Consumer preferences are shifting towards energy efficiency, customization, and seamless integration with smart home ecosystems. The market's competitive landscape is dynamic, with both established players and new entrants vying for market share. The CAGR for the forecast period (2025-2033) is estimated at [xx]%, with market penetration reaching [xx]% by 2033. This growth is largely fueled by [specific drivers, e.g., government incentives for smart home adoption, rising adoption of smart home devices]. The competitive dynamics are marked by [e.g., strategic alliances, product differentiation, and pricing strategies].
Dominant Regions & Segments in GCC Smart Furniture Market
This section identifies the leading regions, countries, and segments within the GCC smart furniture market.
Leading Region/Country: The [Specific Country within GCC] region dominates the market, driven by factors such as:
- Strong economic growth and high disposable incomes.
- Favorable government policies promoting smart city development.
- Well-developed infrastructure and advanced technological capabilities.
Dominant Segments:
- End User: The residential segment holds the largest market share, accounting for [xx]% in 2025, due to increased demand for smart home solutions. The commercial segment is also experiencing significant growth, fueled by demand from hospitality, office spaces and other commercial setups.
- Distribution Channel: Online channels are rapidly gaining traction, contributing to [xx]% of sales in 2025, driven by increasing internet penetration and e-commerce adoption. Multi-brand stores continue to be a significant distribution channel.
- Product Type: Smart tables and smart desks are currently the leading product types, however, the segment of smart beds and sofas is projected to show the highest growth potential due to [explain the reasons behind it].
GCC Smart Furniture Market Product Innovations
Recent product innovations in the GCC smart furniture market focus on incorporating advanced technologies like AI, IoT, and voice control. These innovations deliver features such as automated adjustment, integrated lighting, charging capabilities, and enhanced ergonomics. This results in increased functionality, convenience, and aesthetic appeal, thereby enhancing market fit and competitiveness.
Report Scope & Segmentation Analysis
This report segments the GCC smart furniture market based on end-user, distribution channel, and product type. Each segment's growth projections, market size, and competitive dynamics are analyzed.
- End-User: Residential and Commercial
- Distribution Channel: Multi-brand Stores, Specialty Stores, Online, Other
- Product Type: Smart Tables, Smart Desks, Smart Chairs, Other Products (smart beds, smart sofas, etc.)
[Provide brief paragraph on each segment including market size estimations for 2025 and growth projections for the forecast period]
Key Drivers of GCC Smart Furniture Market Growth
The GCC smart furniture market is driven by several factors, including:
- Technological advancements: The integration of AI, IoT, and voice control technologies into furniture designs enhances functionality and user experience, boosting demand.
- Economic growth: Rising disposable incomes and a growing middle class in the GCC region increase spending on home improvement and smart technology, including smart furniture.
- Government initiatives: Government support for smart city development and smart home initiatives further stimulates market growth.
Challenges in the GCC Smart Furniture Market Sector
The GCC smart furniture market faces challenges such as:
- High initial investment costs: The relatively high cost of smart furniture compared to traditional furniture may limit adoption among certain consumer segments.
- Supply chain complexities: Global supply chain disruptions can impact the availability and pricing of components needed for smart furniture manufacturing.
- Competitive intensity: The market is becoming increasingly competitive, with both established and new players vying for market share.
Emerging Opportunities in GCC Smart Furniture Market
Several opportunities exist in the GCC smart furniture market, including:
- Expansion into new market segments: Targeting niche markets such as healthcare, education, and specialized commercial spaces offers significant growth potential.
- Development of innovative product features: Integrating cutting-edge technology to improve functionality and personalization further strengthens market appeal.
- Strategic partnerships: Collaborations between furniture manufacturers and technology companies facilitate the development of advanced smart furniture solutions.
Leading Players in the GCC Smart Furniture Market Market
- Al Huzaifa
- Bukannan Furniture
- Mordern Gardens
- Pan Emirates
- Bakri Furniture
- Schuco
- Ikea
- Sagtco
- Royal Furniture
Key Developments in GCC Smart Furniture Market Industry
- [Month, Year]: [Company Name] launched a new line of smart desks with integrated wireless charging capabilities.
- [Month, Year]: [Company Name] partnered with [Technology Company] to develop AI-powered smart furniture solutions.
- [Month, Year]: A major M&A deal involved [Company A] acquiring [Company B], strengthening its market position.
- [Add more bullet points as needed with specific years and months]
Future Outlook for GCC Smart Furniture Market Market
The GCC smart furniture market is poised for significant growth in the coming years, driven by technological advancements, increasing consumer demand, and supportive government policies. Strategic partnerships and innovations focusing on sustainability and enhanced user experiences will further accelerate market expansion. The market is expected to witness a considerable rise in the adoption of smart furniture, particularly within the residential sector. Continued investment in research and development will be crucial for companies to maintain a competitive edge and meet the evolving demands of consumers in this dynamic market.
GCC Smart Furniture Market Segmentation
-
1. Product Type
- 1.1. Smart Tables
- 1.2. Smart Desks
- 1.3. Smart Chairs
- 1.4. Other Products (smart beds, smart sofas, etc.)
-
2. End User
- 2.1. Residential
- 2.2. Commercial
-
3. DistributionChannel
- 3.1. Multi-brand Stores
- 3.2. Specialty Stores
- 3.3. Online
- 3.4. Other Distribution Channels
-
4. Geography
- 4.1. UAE
- 4.2. Saudi Arabia
- 4.3. Qatar
- 4.4. Kuwait
- 4.5. Rest of GCC Countries
GCC Smart Furniture Market Segmentation By Geography
- 1. UAE
- 2. Saudi Arabia
- 3. Qatar
- 4. Kuwait
- 5. Rest of GCC Countries
GCC Smart Furniture Market Regional Market Share
Geographic Coverage of GCC Smart Furniture Market
GCC Smart Furniture Market REPORT HIGHLIGHTS
| Aspects | Details |
|---|---|
| Study Period | 2020-2034 |
| Base Year | 2025 |
| Estimated Year | 2026 |
| Forecast Period | 2026-2034 |
| Historical Period | 2020-2025 |
| Growth Rate | CAGR of 7.54% from 2020-2034 |
| Segmentation |
|
Table of Contents
- 1. Introduction
- 1.1. Research Scope
- 1.2. Market Segmentation
- 1.3. Research Objective
- 1.4. Definitions and Assumptions
- 2. Executive Summary
- 2.1. Market Snapshot
- 3. Market Dynamics
- 3.1. Market Drivers
- 3.2. Market Restrains
- 3.3. Market Trends
- 3.4. Market Opportunities
- 4. Market Factor Analysis
- 4.1. Porters Five Forces
- 4.1.1. Bargaining Power of Suppliers
- 4.1.2. Bargaining Power of Buyers
- 4.1.3. Threat of New Entrants
- 4.1.4. Threat of Substitutes
- 4.1.5. Competitive Rivalry
- 4.2. PESTEL analysis
- 4.3. BCG Analysis
- 4.3.1. Stars (High Growth, High Market Share)
- 4.3.2. Cash Cows (Low Growth, High Market Share)
- 4.3.3. Question Mark (High Growth, Low Market Share)
- 4.3.4. Dogs (Low Growth, Low Market Share)
- 4.4. Ansoff Matrix Analysis
- 4.5. Supply Chain Analysis
- 4.6. Regulatory Landscape
- 4.7. Current Market Potential and Opportunity Assessment (TAM–SAM–SOM Framework)
- 4.8. PRI Analyst Note
- 4.1. Porters Five Forces
- 5. Market Analysis, Insights and Forecast 2021-2033
- 5.1. Market Analysis, Insights and Forecast - by Product Type
- 5.1.1. Smart Tables
- 5.1.2. Smart Desks
- 5.1.3. Smart Chairs
- 5.1.4. Other Products (smart beds, smart sofas, etc.)
- 5.2. Market Analysis, Insights and Forecast - by End User
- 5.2.1. Residential
- 5.2.2. Commercial
- 5.3. Market Analysis, Insights and Forecast - by DistributionChannel
- 5.3.1. Multi-brand Stores
- 5.3.2. Specialty Stores
- 5.3.3. Online
- 5.3.4. Other Distribution Channels
- 5.4. Market Analysis, Insights and Forecast - by Geography
- 5.4.1. UAE
- 5.4.2. Saudi Arabia
- 5.4.3. Qatar
- 5.4.4. Kuwait
- 5.4.5. Rest of GCC Countries
- 5.5. Market Analysis, Insights and Forecast - by Region
- 5.5.1. UAE
- 5.5.2. Saudi Arabia
- 5.5.3. Qatar
- 5.5.4. Kuwait
- 5.5.5. Rest of GCC Countries
- 5.1. Market Analysis, Insights and Forecast - by Product Type
- 6. Global GCC Smart Furniture Market Analysis, Insights and Forecast, 2021-2033
- 6.1. Market Analysis, Insights and Forecast - by Product Type
- 6.1.1. Smart Tables
- 6.1.2. Smart Desks
- 6.1.3. Smart Chairs
- 6.1.4. Other Products (smart beds, smart sofas, etc.)
- 6.2. Market Analysis, Insights and Forecast - by End User
- 6.2.1. Residential
- 6.2.2. Commercial
- 6.3. Market Analysis, Insights and Forecast - by DistributionChannel
- 6.3.1. Multi-brand Stores
- 6.3.2. Specialty Stores
- 6.3.3. Online
- 6.3.4. Other Distribution Channels
- 6.4. Market Analysis, Insights and Forecast - by Geography
- 6.4.1. UAE
- 6.4.2. Saudi Arabia
- 6.4.3. Qatar
- 6.4.4. Kuwait
- 6.4.5. Rest of GCC Countries
- 6.1. Market Analysis, Insights and Forecast - by Product Type
- 7. UAE GCC Smart Furniture Market Analysis, Insights and Forecast, 2020-2032
- 7.1. Market Analysis, Insights and Forecast - by Product Type
- 7.1.1. Smart Tables
- 7.1.2. Smart Desks
- 7.1.3. Smart Chairs
- 7.1.4. Other Products (smart beds, smart sofas, etc.)
- 7.2. Market Analysis, Insights and Forecast - by End User
- 7.2.1. Residential
- 7.2.2. Commercial
- 7.3. Market Analysis, Insights and Forecast - by DistributionChannel
- 7.3.1. Multi-brand Stores
- 7.3.2. Specialty Stores
- 7.3.3. Online
- 7.3.4. Other Distribution Channels
- 7.4. Market Analysis, Insights and Forecast - by Geography
- 7.4.1. UAE
- 7.4.2. Saudi Arabia
- 7.4.3. Qatar
- 7.4.4. Kuwait
- 7.4.5. Rest of GCC Countries
- 7.1. Market Analysis, Insights and Forecast - by Product Type
- 8. Saudi Arabia GCC Smart Furniture Market Analysis, Insights and Forecast, 2020-2032
- 8.1. Market Analysis, Insights and Forecast - by Product Type
- 8.1.1. Smart Tables
- 8.1.2. Smart Desks
- 8.1.3. Smart Chairs
- 8.1.4. Other Products (smart beds, smart sofas, etc.)
- 8.2. Market Analysis, Insights and Forecast - by End User
- 8.2.1. Residential
- 8.2.2. Commercial
- 8.3. Market Analysis, Insights and Forecast - by DistributionChannel
- 8.3.1. Multi-brand Stores
- 8.3.2. Specialty Stores
- 8.3.3. Online
- 8.3.4. Other Distribution Channels
- 8.4. Market Analysis, Insights and Forecast - by Geography
- 8.4.1. UAE
- 8.4.2. Saudi Arabia
- 8.4.3. Qatar
- 8.4.4. Kuwait
- 8.4.5. Rest of GCC Countries
- 8.1. Market Analysis, Insights and Forecast - by Product Type
- 9. Qatar GCC Smart Furniture Market Analysis, Insights and Forecast, 2020-2032
- 9.1. Market Analysis, Insights and Forecast - by Product Type
- 9.1.1. Smart Tables
- 9.1.2. Smart Desks
- 9.1.3. Smart Chairs
- 9.1.4. Other Products (smart beds, smart sofas, etc.)
- 9.2. Market Analysis, Insights and Forecast - by End User
- 9.2.1. Residential
- 9.2.2. Commercial
- 9.3. Market Analysis, Insights and Forecast - by DistributionChannel
- 9.3.1. Multi-brand Stores
- 9.3.2. Specialty Stores
- 9.3.3. Online
- 9.3.4. Other Distribution Channels
- 9.4. Market Analysis, Insights and Forecast - by Geography
- 9.4.1. UAE
- 9.4.2. Saudi Arabia
- 9.4.3. Qatar
- 9.4.4. Kuwait
- 9.4.5. Rest of GCC Countries
- 9.1. Market Analysis, Insights and Forecast - by Product Type
- 10. Kuwait GCC Smart Furniture Market Analysis, Insights and Forecast, 2020-2032
- 10.1. Market Analysis, Insights and Forecast - by Product Type
- 10.1.1. Smart Tables
- 10.1.2. Smart Desks
- 10.1.3. Smart Chairs
- 10.1.4. Other Products (smart beds, smart sofas, etc.)
- 10.2. Market Analysis, Insights and Forecast - by End User
- 10.2.1. Residential
- 10.2.2. Commercial
- 10.3. Market Analysis, Insights and Forecast - by DistributionChannel
- 10.3.1. Multi-brand Stores
- 10.3.2. Specialty Stores
- 10.3.3. Online
- 10.3.4. Other Distribution Channels
- 10.4. Market Analysis, Insights and Forecast - by Geography
- 10.4.1. UAE
- 10.4.2. Saudi Arabia
- 10.4.3. Qatar
- 10.4.4. Kuwait
- 10.4.5. Rest of GCC Countries
- 10.1. Market Analysis, Insights and Forecast - by Product Type
- 11. Rest of GCC Countries GCC Smart Furniture Market Analysis, Insights and Forecast, 2020-2032
- 11.1. Market Analysis, Insights and Forecast - by Product Type
- 11.1.1. Smart Tables
- 11.1.2. Smart Desks
- 11.1.3. Smart Chairs
- 11.1.4. Other Products (smart beds, smart sofas, etc.)
- 11.2. Market Analysis, Insights and Forecast - by End User
- 11.2.1. Residential
- 11.2.2. Commercial
- 11.3. Market Analysis, Insights and Forecast - by DistributionChannel
- 11.3.1. Multi-brand Stores
- 11.3.2. Specialty Stores
- 11.3.3. Online
- 11.3.4. Other Distribution Channels
- 11.4. Market Analysis, Insights and Forecast - by Geography
- 11.4.1. UAE
- 11.4.2. Saudi Arabia
- 11.4.3. Qatar
- 11.4.4. Kuwait
- 11.4.5. Rest of GCC Countries
- 11.1. Market Analysis, Insights and Forecast - by Product Type
- 12. Competitive Analysis
- 12.1. Company Profiles
- 12.1.1 Al Huzaifa
- 12.1.1.1. Company Overview
- 12.1.1.2. Products
- 12.1.1.3. Company Financials
- 12.1.1.4. SWOT Analysis
- 12.1.2 Bukannan Furniture
- 12.1.2.1. Company Overview
- 12.1.2.2. Products
- 12.1.2.3. Company Financials
- 12.1.2.4. SWOT Analysis
- 12.1.3 Mordern Gardens
- 12.1.3.1. Company Overview
- 12.1.3.2. Products
- 12.1.3.3. Company Financials
- 12.1.3.4. SWOT Analysis
- 12.1.4 Pan Emirates
- 12.1.4.1. Company Overview
- 12.1.4.2. Products
- 12.1.4.3. Company Financials
- 12.1.4.4. SWOT Analysis
- 12.1.5 Bakri Furniture
- 12.1.5.1. Company Overview
- 12.1.5.2. Products
- 12.1.5.3. Company Financials
- 12.1.5.4. SWOT Analysis
- 12.1.6 Schuco
- 12.1.6.1. Company Overview
- 12.1.6.2. Products
- 12.1.6.3. Company Financials
- 12.1.6.4. SWOT Analysis
- 12.1.7 Ikea
- 12.1.7.1. Company Overview
- 12.1.7.2. Products
- 12.1.7.3. Company Financials
- 12.1.7.4. SWOT Analysis
- 12.1.8 Sagtco
- 12.1.8.1. Company Overview
- 12.1.8.2. Products
- 12.1.8.3. Company Financials
- 12.1.8.4. SWOT Analysis
- 12.1.9 Royal Furniture
- 12.1.9.1. Company Overview
- 12.1.9.2. Products
- 12.1.9.3. Company Financials
- 12.1.9.4. SWOT Analysis
- 12.1.1 Al Huzaifa
- 12.2. Market Entropy
- 12.2.1 Company's Key Areas Served
- 12.2.2 Recent Developments
- 12.3. Company Market Share Analysis 2025
- 12.3.1 Top 5 Companies Market Share Analysis
- 12.3.2 Top 3 Companies Market Share Analysis
- 12.4. List of Potential Customers
- 13. Research Methodology
List of Figures
- Figure 1: Global GCC Smart Furniture Market Revenue Breakdown (billion, %) by Region 2025 & 2033
- Figure 2: Global GCC Smart Furniture Market Volume Breakdown (K Unit, %) by Region 2025 & 2033
- Figure 3: UAE GCC Smart Furniture Market Revenue (billion), by Product Type 2025 & 2033
- Figure 4: UAE GCC Smart Furniture Market Volume (K Unit), by Product Type 2025 & 2033
- Figure 5: UAE GCC Smart Furniture Market Revenue Share (%), by Product Type 2025 & 2033
- Figure 6: UAE GCC Smart Furniture Market Volume Share (%), by Product Type 2025 & 2033
- Figure 7: UAE GCC Smart Furniture Market Revenue (billion), by End User 2025 & 2033
- Figure 8: UAE GCC Smart Furniture Market Volume (K Unit), by End User 2025 & 2033
- Figure 9: UAE GCC Smart Furniture Market Revenue Share (%), by End User 2025 & 2033
- Figure 10: UAE GCC Smart Furniture Market Volume Share (%), by End User 2025 & 2033
- Figure 11: UAE GCC Smart Furniture Market Revenue (billion), by DistributionChannel 2025 & 2033
- Figure 12: UAE GCC Smart Furniture Market Volume (K Unit), by DistributionChannel 2025 & 2033
- Figure 13: UAE GCC Smart Furniture Market Revenue Share (%), by DistributionChannel 2025 & 2033
- Figure 14: UAE GCC Smart Furniture Market Volume Share (%), by DistributionChannel 2025 & 2033
- Figure 15: UAE GCC Smart Furniture Market Revenue (billion), by Geography 2025 & 2033
- Figure 16: UAE GCC Smart Furniture Market Volume (K Unit), by Geography 2025 & 2033
- Figure 17: UAE GCC Smart Furniture Market Revenue Share (%), by Geography 2025 & 2033
- Figure 18: UAE GCC Smart Furniture Market Volume Share (%), by Geography 2025 & 2033
- Figure 19: UAE GCC Smart Furniture Market Revenue (billion), by Country 2025 & 2033
- Figure 20: UAE GCC Smart Furniture Market Volume (K Unit), by Country 2025 & 2033
- Figure 21: UAE GCC Smart Furniture Market Revenue Share (%), by Country 2025 & 2033
- Figure 22: UAE GCC Smart Furniture Market Volume Share (%), by Country 2025 & 2033
- Figure 23: Saudi Arabia GCC Smart Furniture Market Revenue (billion), by Product Type 2025 & 2033
- Figure 24: Saudi Arabia GCC Smart Furniture Market Volume (K Unit), by Product Type 2025 & 2033
- Figure 25: Saudi Arabia GCC Smart Furniture Market Revenue Share (%), by Product Type 2025 & 2033
- Figure 26: Saudi Arabia GCC Smart Furniture Market Volume Share (%), by Product Type 2025 & 2033
- Figure 27: Saudi Arabia GCC Smart Furniture Market Revenue (billion), by End User 2025 & 2033
- Figure 28: Saudi Arabia GCC Smart Furniture Market Volume (K Unit), by End User 2025 & 2033
- Figure 29: Saudi Arabia GCC Smart Furniture Market Revenue Share (%), by End User 2025 & 2033
- Figure 30: Saudi Arabia GCC Smart Furniture Market Volume Share (%), by End User 2025 & 2033
- Figure 31: Saudi Arabia GCC Smart Furniture Market Revenue (billion), by DistributionChannel 2025 & 2033
- Figure 32: Saudi Arabia GCC Smart Furniture Market Volume (K Unit), by DistributionChannel 2025 & 2033
- Figure 33: Saudi Arabia GCC Smart Furniture Market Revenue Share (%), by DistributionChannel 2025 & 2033
- Figure 34: Saudi Arabia GCC Smart Furniture Market Volume Share (%), by DistributionChannel 2025 & 2033
- Figure 35: Saudi Arabia GCC Smart Furniture Market Revenue (billion), by Geography 2025 & 2033
- Figure 36: Saudi Arabia GCC Smart Furniture Market Volume (K Unit), by Geography 2025 & 2033
- Figure 37: Saudi Arabia GCC Smart Furniture Market Revenue Share (%), by Geography 2025 & 2033
- Figure 38: Saudi Arabia GCC Smart Furniture Market Volume Share (%), by Geography 2025 & 2033
- Figure 39: Saudi Arabia GCC Smart Furniture Market Revenue (billion), by Country 2025 & 2033
- Figure 40: Saudi Arabia GCC Smart Furniture Market Volume (K Unit), by Country 2025 & 2033
- Figure 41: Saudi Arabia GCC Smart Furniture Market Revenue Share (%), by Country 2025 & 2033
- Figure 42: Saudi Arabia GCC Smart Furniture Market Volume Share (%), by Country 2025 & 2033
- Figure 43: Qatar GCC Smart Furniture Market Revenue (billion), by Product Type 2025 & 2033
- Figure 44: Qatar GCC Smart Furniture Market Volume (K Unit), by Product Type 2025 & 2033
- Figure 45: Qatar GCC Smart Furniture Market Revenue Share (%), by Product Type 2025 & 2033
- Figure 46: Qatar GCC Smart Furniture Market Volume Share (%), by Product Type 2025 & 2033
- Figure 47: Qatar GCC Smart Furniture Market Revenue (billion), by End User 2025 & 2033
- Figure 48: Qatar GCC Smart Furniture Market Volume (K Unit), by End User 2025 & 2033
- Figure 49: Qatar GCC Smart Furniture Market Revenue Share (%), by End User 2025 & 2033
- Figure 50: Qatar GCC Smart Furniture Market Volume Share (%), by End User 2025 & 2033
- Figure 51: Qatar GCC Smart Furniture Market Revenue (billion), by DistributionChannel 2025 & 2033
- Figure 52: Qatar GCC Smart Furniture Market Volume (K Unit), by DistributionChannel 2025 & 2033
- Figure 53: Qatar GCC Smart Furniture Market Revenue Share (%), by DistributionChannel 2025 & 2033
- Figure 54: Qatar GCC Smart Furniture Market Volume Share (%), by DistributionChannel 2025 & 2033
- Figure 55: Qatar GCC Smart Furniture Market Revenue (billion), by Geography 2025 & 2033
- Figure 56: Qatar GCC Smart Furniture Market Volume (K Unit), by Geography 2025 & 2033
- Figure 57: Qatar GCC Smart Furniture Market Revenue Share (%), by Geography 2025 & 2033
- Figure 58: Qatar GCC Smart Furniture Market Volume Share (%), by Geography 2025 & 2033
- Figure 59: Qatar GCC Smart Furniture Market Revenue (billion), by Country 2025 & 2033
- Figure 60: Qatar GCC Smart Furniture Market Volume (K Unit), by Country 2025 & 2033
- Figure 61: Qatar GCC Smart Furniture Market Revenue Share (%), by Country 2025 & 2033
- Figure 62: Qatar GCC Smart Furniture Market Volume Share (%), by Country 2025 & 2033
- Figure 63: Kuwait GCC Smart Furniture Market Revenue (billion), by Product Type 2025 & 2033
- Figure 64: Kuwait GCC Smart Furniture Market Volume (K Unit), by Product Type 2025 & 2033
- Figure 65: Kuwait GCC Smart Furniture Market Revenue Share (%), by Product Type 2025 & 2033
- Figure 66: Kuwait GCC Smart Furniture Market Volume Share (%), by Product Type 2025 & 2033
- Figure 67: Kuwait GCC Smart Furniture Market Revenue (billion), by End User 2025 & 2033
- Figure 68: Kuwait GCC Smart Furniture Market Volume (K Unit), by End User 2025 & 2033
- Figure 69: Kuwait GCC Smart Furniture Market Revenue Share (%), by End User 2025 & 2033
- Figure 70: Kuwait GCC Smart Furniture Market Volume Share (%), by End User 2025 & 2033
- Figure 71: Kuwait GCC Smart Furniture Market Revenue (billion), by DistributionChannel 2025 & 2033
- Figure 72: Kuwait GCC Smart Furniture Market Volume (K Unit), by DistributionChannel 2025 & 2033
- Figure 73: Kuwait GCC Smart Furniture Market Revenue Share (%), by DistributionChannel 2025 & 2033
- Figure 74: Kuwait GCC Smart Furniture Market Volume Share (%), by DistributionChannel 2025 & 2033
- Figure 75: Kuwait GCC Smart Furniture Market Revenue (billion), by Geography 2025 & 2033
- Figure 76: Kuwait GCC Smart Furniture Market Volume (K Unit), by Geography 2025 & 2033
- Figure 77: Kuwait GCC Smart Furniture Market Revenue Share (%), by Geography 2025 & 2033
- Figure 78: Kuwait GCC Smart Furniture Market Volume Share (%), by Geography 2025 & 2033
- Figure 79: Kuwait GCC Smart Furniture Market Revenue (billion), by Country 2025 & 2033
- Figure 80: Kuwait GCC Smart Furniture Market Volume (K Unit), by Country 2025 & 2033
- Figure 81: Kuwait GCC Smart Furniture Market Revenue Share (%), by Country 2025 & 2033
- Figure 82: Kuwait GCC Smart Furniture Market Volume Share (%), by Country 2025 & 2033
- Figure 83: Rest of GCC Countries GCC Smart Furniture Market Revenue (billion), by Product Type 2025 & 2033
- Figure 84: Rest of GCC Countries GCC Smart Furniture Market Volume (K Unit), by Product Type 2025 & 2033
- Figure 85: Rest of GCC Countries GCC Smart Furniture Market Revenue Share (%), by Product Type 2025 & 2033
- Figure 86: Rest of GCC Countries GCC Smart Furniture Market Volume Share (%), by Product Type 2025 & 2033
- Figure 87: Rest of GCC Countries GCC Smart Furniture Market Revenue (billion), by End User 2025 & 2033
- Figure 88: Rest of GCC Countries GCC Smart Furniture Market Volume (K Unit), by End User 2025 & 2033
- Figure 89: Rest of GCC Countries GCC Smart Furniture Market Revenue Share (%), by End User 2025 & 2033
- Figure 90: Rest of GCC Countries GCC Smart Furniture Market Volume Share (%), by End User 2025 & 2033
- Figure 91: Rest of GCC Countries GCC Smart Furniture Market Revenue (billion), by DistributionChannel 2025 & 2033
- Figure 92: Rest of GCC Countries GCC Smart Furniture Market Volume (K Unit), by DistributionChannel 2025 & 2033
- Figure 93: Rest of GCC Countries GCC Smart Furniture Market Revenue Share (%), by DistributionChannel 2025 & 2033
- Figure 94: Rest of GCC Countries GCC Smart Furniture Market Volume Share (%), by DistributionChannel 2025 & 2033
- Figure 95: Rest of GCC Countries GCC Smart Furniture Market Revenue (billion), by Geography 2025 & 2033
- Figure 96: Rest of GCC Countries GCC Smart Furniture Market Volume (K Unit), by Geography 2025 & 2033
- Figure 97: Rest of GCC Countries GCC Smart Furniture Market Revenue Share (%), by Geography 2025 & 2033
- Figure 98: Rest of GCC Countries GCC Smart Furniture Market Volume Share (%), by Geography 2025 & 2033
- Figure 99: Rest of GCC Countries GCC Smart Furniture Market Revenue (billion), by Country 2025 & 2033
- Figure 100: Rest of GCC Countries GCC Smart Furniture Market Volume (K Unit), by Country 2025 & 2033
- Figure 101: Rest of GCC Countries GCC Smart Furniture Market Revenue Share (%), by Country 2025 & 2033
- Figure 102: Rest of GCC Countries GCC Smart Furniture Market Volume Share (%), by Country 2025 & 2033
List of Tables
- Table 1: Global GCC Smart Furniture Market Revenue billion Forecast, by Product Type 2020 & 2033
- Table 2: Global GCC Smart Furniture Market Volume K Unit Forecast, by Product Type 2020 & 2033
- Table 3: Global GCC Smart Furniture Market Revenue billion Forecast, by End User 2020 & 2033
- Table 4: Global GCC Smart Furniture Market Volume K Unit Forecast, by End User 2020 & 2033
- Table 5: Global GCC Smart Furniture Market Revenue billion Forecast, by DistributionChannel 2020 & 2033
- Table 6: Global GCC Smart Furniture Market Volume K Unit Forecast, by DistributionChannel 2020 & 2033
- Table 7: Global GCC Smart Furniture Market Revenue billion Forecast, by Geography 2020 & 2033
- Table 8: Global GCC Smart Furniture Market Volume K Unit Forecast, by Geography 2020 & 2033
- Table 9: Global GCC Smart Furniture Market Revenue billion Forecast, by Region 2020 & 2033
- Table 10: Global GCC Smart Furniture Market Volume K Unit Forecast, by Region 2020 & 2033
- Table 11: Global GCC Smart Furniture Market Revenue billion Forecast, by Product Type 2020 & 2033
- Table 12: Global GCC Smart Furniture Market Volume K Unit Forecast, by Product Type 2020 & 2033
- Table 13: Global GCC Smart Furniture Market Revenue billion Forecast, by End User 2020 & 2033
- Table 14: Global GCC Smart Furniture Market Volume K Unit Forecast, by End User 2020 & 2033
- Table 15: Global GCC Smart Furniture Market Revenue billion Forecast, by DistributionChannel 2020 & 2033
- Table 16: Global GCC Smart Furniture Market Volume K Unit Forecast, by DistributionChannel 2020 & 2033
- Table 17: Global GCC Smart Furniture Market Revenue billion Forecast, by Geography 2020 & 2033
- Table 18: Global GCC Smart Furniture Market Volume K Unit Forecast, by Geography 2020 & 2033
- Table 19: Global GCC Smart Furniture Market Revenue billion Forecast, by Country 2020 & 2033
- Table 20: Global GCC Smart Furniture Market Volume K Unit Forecast, by Country 2020 & 2033
- Table 21: Global GCC Smart Furniture Market Revenue billion Forecast, by Product Type 2020 & 2033
- Table 22: Global GCC Smart Furniture Market Volume K Unit Forecast, by Product Type 2020 & 2033
- Table 23: Global GCC Smart Furniture Market Revenue billion Forecast, by End User 2020 & 2033
- Table 24: Global GCC Smart Furniture Market Volume K Unit Forecast, by End User 2020 & 2033
- Table 25: Global GCC Smart Furniture Market Revenue billion Forecast, by DistributionChannel 2020 & 2033
- Table 26: Global GCC Smart Furniture Market Volume K Unit Forecast, by DistributionChannel 2020 & 2033
- Table 27: Global GCC Smart Furniture Market Revenue billion Forecast, by Geography 2020 & 2033
- Table 28: Global GCC Smart Furniture Market Volume K Unit Forecast, by Geography 2020 & 2033
- Table 29: Global GCC Smart Furniture Market Revenue billion Forecast, by Country 2020 & 2033
- Table 30: Global GCC Smart Furniture Market Volume K Unit Forecast, by Country 2020 & 2033
- Table 31: Global GCC Smart Furniture Market Revenue billion Forecast, by Product Type 2020 & 2033
- Table 32: Global GCC Smart Furniture Market Volume K Unit Forecast, by Product Type 2020 & 2033
- Table 33: Global GCC Smart Furniture Market Revenue billion Forecast, by End User 2020 & 2033
- Table 34: Global GCC Smart Furniture Market Volume K Unit Forecast, by End User 2020 & 2033
- Table 35: Global GCC Smart Furniture Market Revenue billion Forecast, by DistributionChannel 2020 & 2033
- Table 36: Global GCC Smart Furniture Market Volume K Unit Forecast, by DistributionChannel 2020 & 2033
- Table 37: Global GCC Smart Furniture Market Revenue billion Forecast, by Geography 2020 & 2033
- Table 38: Global GCC Smart Furniture Market Volume K Unit Forecast, by Geography 2020 & 2033
- Table 39: Global GCC Smart Furniture Market Revenue billion Forecast, by Country 2020 & 2033
- Table 40: Global GCC Smart Furniture Market Volume K Unit Forecast, by Country 2020 & 2033
- Table 41: Global GCC Smart Furniture Market Revenue billion Forecast, by Product Type 2020 & 2033
- Table 42: Global GCC Smart Furniture Market Volume K Unit Forecast, by Product Type 2020 & 2033
- Table 43: Global GCC Smart Furniture Market Revenue billion Forecast, by End User 2020 & 2033
- Table 44: Global GCC Smart Furniture Market Volume K Unit Forecast, by End User 2020 & 2033
- Table 45: Global GCC Smart Furniture Market Revenue billion Forecast, by DistributionChannel 2020 & 2033
- Table 46: Global GCC Smart Furniture Market Volume K Unit Forecast, by DistributionChannel 2020 & 2033
- Table 47: Global GCC Smart Furniture Market Revenue billion Forecast, by Geography 2020 & 2033
- Table 48: Global GCC Smart Furniture Market Volume K Unit Forecast, by Geography 2020 & 2033
- Table 49: Global GCC Smart Furniture Market Revenue billion Forecast, by Country 2020 & 2033
- Table 50: Global GCC Smart Furniture Market Volume K Unit Forecast, by Country 2020 & 2033
- Table 51: Global GCC Smart Furniture Market Revenue billion Forecast, by Product Type 2020 & 2033
- Table 52: Global GCC Smart Furniture Market Volume K Unit Forecast, by Product Type 2020 & 2033
- Table 53: Global GCC Smart Furniture Market Revenue billion Forecast, by End User 2020 & 2033
- Table 54: Global GCC Smart Furniture Market Volume K Unit Forecast, by End User 2020 & 2033
- Table 55: Global GCC Smart Furniture Market Revenue billion Forecast, by DistributionChannel 2020 & 2033
- Table 56: Global GCC Smart Furniture Market Volume K Unit Forecast, by DistributionChannel 2020 & 2033
- Table 57: Global GCC Smart Furniture Market Revenue billion Forecast, by Geography 2020 & 2033
- Table 58: Global GCC Smart Furniture Market Volume K Unit Forecast, by Geography 2020 & 2033
- Table 59: Global GCC Smart Furniture Market Revenue billion Forecast, by Country 2020 & 2033
- Table 60: Global GCC Smart Furniture Market Volume K Unit Forecast, by Country 2020 & 2033
Frequently Asked Questions
1. What is the projected Compound Annual Growth Rate (CAGR) of the GCC Smart Furniture Market?
The projected CAGR is approximately 7.54%.
2. Which companies are prominent players in the GCC Smart Furniture Market?
Key companies in the market include Al Huzaifa, Bukannan Furniture, Mordern Gardens, Pan Emirates, Bakri Furniture, Schuco, Ikea, Sagtco, Royal Furniture.
3. What are the main segments of the GCC Smart Furniture Market?
The market segments include Product Type, End User, DistributionChannel, Geography.
4. Can you provide details about the market size?
The market size is estimated to be USD 15.61 billion as of 2022.
5. What are some drivers contributing to market growth?
Increasing Online Sales is Driving the Market; Growing Urbanisation is Driving need for Small Appliances.
6. What are the notable trends driving market growth?
Rise in Consumer Expenditure on Home Improvement Fuels the Market.
7. Are there any restraints impacting market growth?
Changing Needs of Customers; Limited Usage of the Product.
8. Can you provide examples of recent developments in the market?
N/A
9. What pricing options are available for accessing the report?
Pricing options include single-user, multi-user, and enterprise licenses priced at USD 4750, USD 5250, and USD 8750 respectively.
10. Is the market size provided in terms of value or volume?
The market size is provided in terms of value, measured in billion and volume, measured in K Unit.
11. Are there any specific market keywords associated with the report?
Yes, the market keyword associated with the report is "GCC Smart Furniture Market," which aids in identifying and referencing the specific market segment covered.
12. How do I determine which pricing option suits my needs best?
The pricing options vary based on user requirements and access needs. Individual users may opt for single-user licenses, while businesses requiring broader access may choose multi-user or enterprise licenses for cost-effective access to the report.
13. Are there any additional resources or data provided in the GCC Smart Furniture Market report?
While the report offers comprehensive insights, it's advisable to review the specific contents or supplementary materials provided to ascertain if additional resources or data are available.
14. How can I stay updated on further developments or reports in the GCC Smart Furniture Market?
To stay informed about further developments, trends, and reports in the GCC Smart Furniture Market, consider subscribing to industry newsletters, following relevant companies and organizations, or regularly checking reputable industry news sources and publications.
Methodology
Step 1 - Identification of Relevant Samples Size from Population Database


Step 2 - Approaches for Defining Global Market Size (Value, Volume* & Price*)

Note*: In applicable scenarios
Step 3 - Data Sources
Primary Research
- Web Analytics
- Survey Reports
- Research Institute
- Latest Research Reports
- Opinion Leaders
Secondary Research
- Annual Reports
- White Paper
- Latest Press Release
- Industry Association
- Paid Database
- Investor Presentations

Step 4 - Data Triangulation
Involves using different sources of information in order to increase the validity of a study
These sources are likely to be stakeholders in a program - participants, other researchers, program staff, other community members, and so on.
Then we put all data in single framework & apply various statistical tools to find out the dynamic on the market.
During the analysis stage, feedback from the stakeholder groups would be compared to determine areas of agreement as well as areas of divergence