

Key Insights
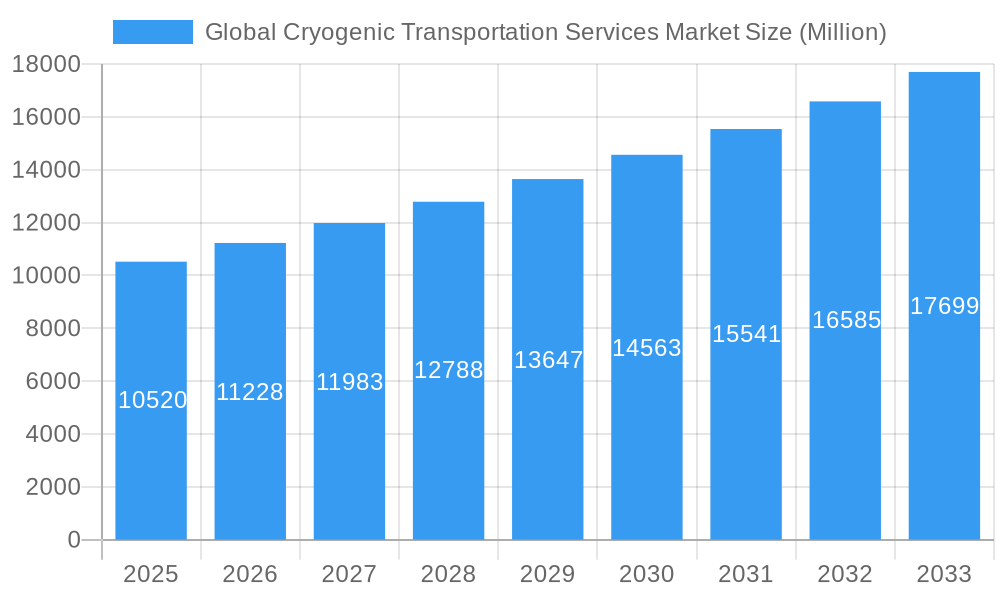
The global cryogenic transportation services market is experiencing robust growth, projected to reach a market size of $10.52 billion in 2025 and exhibiting a Compound Annual Growth Rate (CAGR) of 6.75% from 2025 to 2033. This expansion is fueled by several key drivers. The increasing demand for temperature-sensitive pharmaceuticals, particularly biologics and vaccines, is a primary catalyst. Advancements in cryogenic technologies, leading to more efficient and reliable transportation solutions, are further stimulating market growth. The rising prevalence of chronic diseases globally also contributes, necessitating greater transportation of cryogenically stored medications. Furthermore, the expansion of industrial applications, including the transportation of liquefied natural gas (LNG) and other cryogenic industrial gases, fuels market expansion. Segment-wise, truck transportation currently holds a larger market share than trailer transportation, although both are experiencing significant growth. Geographically, North America and Europe represent substantial market segments due to advanced healthcare infrastructure and strong regulatory frameworks. However, the Asia-Pacific region is expected to witness the fastest growth, driven by rising disposable incomes, expanding healthcare sectors, and increasing industrial activities. While market restraints such as high transportation costs and stringent regulatory compliance requirements exist, the overall positive trends in healthcare, industrial applications, and technological advancements are expected to outweigh these challenges, ensuring sustained market expansion in the forecast period.
Global Cryogenic Transportation Services Market Market Size (In Billion)
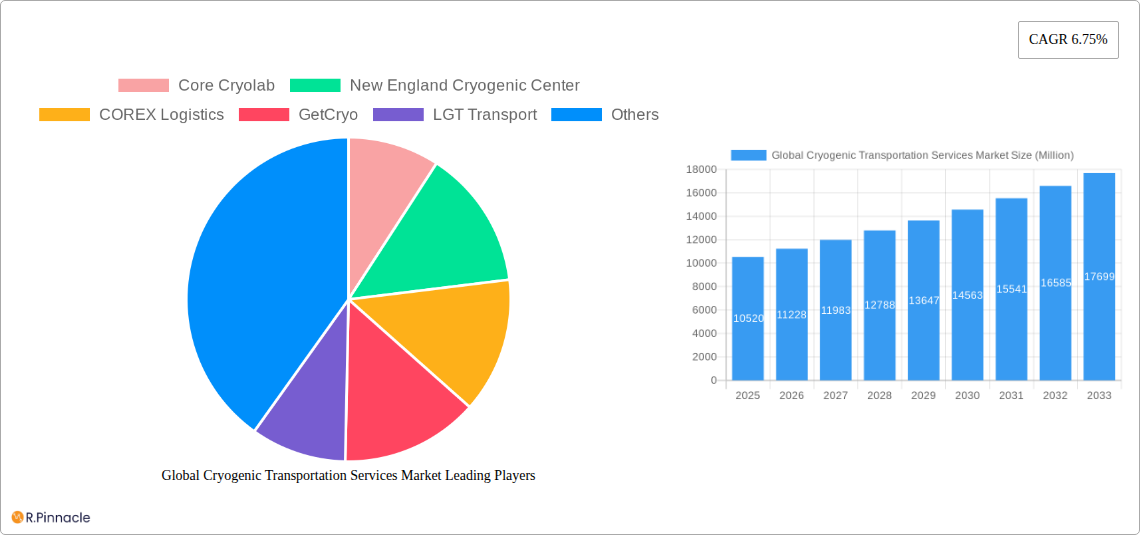
The competitive landscape is characterized by a mix of large multinational corporations and specialized regional players. Core Cryolab, New England Cryogenic Center, and other companies mentioned are actively shaping market dynamics through strategic partnerships, technological innovations, and geographic expansion. The market is likely to witness further consolidation and increased competition as the demand for efficient and reliable cryogenic transportation services continues to grow. Future growth will likely be influenced by innovations in container technology, advancements in tracking and monitoring systems, and the implementation of sustainable practices within the industry. The market's success hinges on the ability of companies to adapt to evolving regulations, offer cost-effective solutions, and guarantee the integrity and safety of temperature-sensitive materials during transit.
Global Cryogenic Transportation Services Market Company Market Share
Global Cryogenic Transportation Services Market Report: 2019-2033
This comprehensive report provides a detailed analysis of the global cryogenic transportation services market, offering actionable insights for industry professionals, investors, and stakeholders. Covering the period from 2019 to 2033, with a focus on 2025, this report examines market dynamics, key players, and future growth potential. The market is segmented by type (Trailer Transportation, Truck Transportation) and application (Chemicals, Drugs, Biological Specimens, Industrial Gases, Other Applications). The report projects a market size of xx Million by 2033, representing a CAGR of xx%.
Global Cryogenic Transportation Services Market Structure & Innovation Trends
The global cryogenic transportation services market exhibits a moderately concentrated structure, with several key players holding significant market share. Core Cryolab, New England Cryogenic Center, COREX Logistics, GetCryo, and LGT Transport are among the prominent companies shaping the market landscape. Market share data suggests that the top 5 players collectively hold approximately xx% of the market in 2025. Innovation is driven by the increasing demand for efficient and reliable cryogenic transportation solutions across various sectors, particularly in pharmaceuticals and healthcare. Regulatory frameworks, including those related to safety and environmental standards, play a crucial role in shaping market dynamics. The market is witnessing significant M&A activities, with deal values reaching xx Million in recent years. This reflects the consolidation trend within the industry and the efforts of larger players to expand their market presence. Product substitutes, such as improved insulation techniques and alternative transportation methods are impacting market growth. End-user demographics across healthcare, chemical, and industrial gas sectors significantly influence market demand and its segmentation.
- Market Concentration: Moderately concentrated, with top 5 players holding xx% market share (2025).
- Innovation Drivers: Increasing demand for efficient and reliable transportation, particularly in pharmaceuticals and healthcare.
- Regulatory Frameworks: Safety and environmental regulations influence market growth and operations.
- M&A Activity: Significant M&A activity, with deal values reaching xx Million in recent years.
- Product Substitutes: Emerging technologies like improved insulation and alternative transportation methods.
Global Cryogenic Transportation Services Market Dynamics & Trends
The global cryogenic transportation services market is experiencing robust growth, driven by several key factors. The rising demand for temperature-sensitive products, particularly in the pharmaceutical and biotechnology sectors, fuels significant market expansion. Technological advancements, such as the development of advanced cryogenic containers and improved logistics management systems, enhance transportation efficiency and safety. Consumer preference for high-quality, reliable transportation services drives market growth. Intense competition among established and emerging players further accelerates market expansion. The market's CAGR is projected at xx% during the forecast period (2025-2033), with market penetration significantly driven by the increasing adoption of cryogenic transportation solutions in emerging economies. Technological disruptions, including the adoption of IoT and AI-based solutions for monitoring and tracking shipments, are transforming the market landscape. Pricing strategies and brand recognition also contribute to the competitive dynamics.
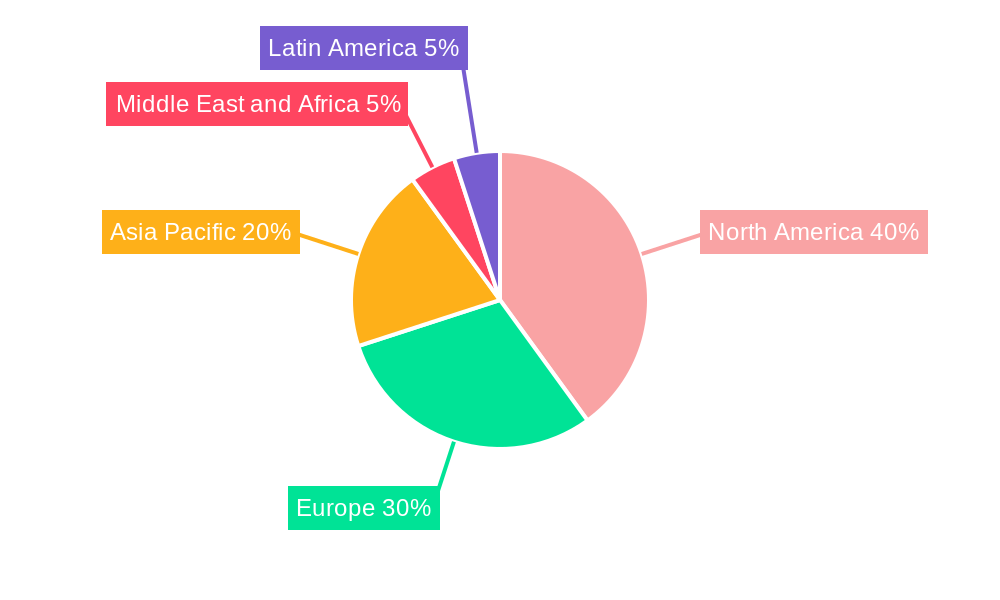
Dominant Regions & Segments in Global Cryogenic Transportation Services Market
The global cryogenic transportation services market is experiencing robust growth, with North America currently holding a dominant position. This leadership is largely attributed to the region's highly developed pharmaceutical and biotechnology sectors, which necessitate stringent temperature control for the transport of sensitive materials. Europe follows as a substantial market, propelled by its comprehensive regulatory landscape and significant investments in healthcare infrastructure and services. The Asia-Pacific region is rapidly emerging as a critical growth engine, with burgeoning demand from economies like China and India, driven by expanding industrial activities and a growing focus on healthcare advancements.
Market Segmentation by Service Type:
- Trailer Transportation: This segment continues to lead in market share, primarily due to the inherently higher payload capacities of cryogenic trailers, making them ideal for large-volume shipments and long-haul transportation.
- Truck Transportation: While generally handling smaller volumes, truck transportation is witnessing consistent growth. Its flexibility, agility, and suitability for last-mile deliveries and localized distribution networks are key to its expanding application.
Market Segmentation by Application:
- Pharmaceuticals and Healthcare: This remains the largest and most critical application segment. The increasing development and global distribution of temperature-sensitive pharmaceuticals, vaccines, and biologics, especially post-pandemic, are fueling sustained demand for reliable cryogenic transport.
- Industrial Gases: With a continuous expansion in various industrial sectors globally, including manufacturing, chemicals, and energy, the demand for the safe and efficient transportation of liquefied industrial gases like oxygen, nitrogen, and argon is substantial and growing.
- Biological Specimens and Research: This segment is exhibiting rapid expansion, driven by advancements in life sciences research, the proliferation of diagnostic testing, and the increasing need for the secure, temperature-controlled transit of biological samples for genetic sequencing, clinical trials, and advanced medical diagnostics.
Regional Dynamics and Growth Catalysts:
- North America: Key drivers include a mature pharmaceutical and biotechnology ecosystem, advanced transportation infrastructure, and rigorous regulatory standards ensuring product integrity.
- Europe: Characterized by a strong emphasis on public health, robust regulatory frameworks governing cold chain logistics, and significant healthcare expenditure, all contributing to a stable and growing demand.
- Asia-Pacific: This region is a hotbed for growth, fueled by rapid economic expansion, a burgeoning healthcare sector, increasing domestic production of temperature-sensitive goods, and a rising middle class demanding better healthcare solutions.
Global Cryogenic Transportation Services Market Product Innovations
Recent innovations focus on enhancing the efficiency, safety, and reliability of cryogenic transportation. This includes the development of advanced insulation materials, improved temperature monitoring systems, and the use of specialized containers designed to withstand various environmental conditions. The integration of IoT and AI-based technologies for real-time tracking and monitoring offers enhanced visibility and control over shipments. These innovations aim to reduce transportation costs, minimize product loss, and increase overall operational efficiency. The market fit of these innovations is particularly strong in the pharmaceutical and healthcare sectors, where product integrity and safety are paramount.
Report Scope & Segmentation Analysis
This comprehensive market report meticulously analyzes the global cryogenic transportation services market. The analysis is bifurcated by Service Type (Trailer Transportation and Truck Transportation) and Application (Chemicals, Pharmaceuticals, Biological Specimens, Industrial Gases, and Other Applications). For each segment, the report provides detailed insights into projected growth trajectories, current market valuations, and the intricate competitive landscape. The market size for Trailer Transportation is projected to reach approximately $XX Million by 2025, while Truck Transportation is estimated to be valued at $XX Million. Within applications, Pharmaceuticals is anticipated to remain the largest segment, estimated at $XX Million in 2025, closely followed by Industrial Gases, projected at $XX Million.
Key Drivers of Global Cryogenic Transportation Services Market Growth
The expansion of the global cryogenic transportation services market is underpinned by several potent growth drivers. Foremost among these is the escalating global demand for temperature-sensitive products across the pharmaceutical, biotechnology, and broader healthcare industries, a trend amplified by the increasing focus on specialized medicines and vaccines. Technological innovations are also playing a pivotal role; advancements in the design of cryogenic containers, equipped with sophisticated insulation and real-time temperature monitoring systems, are significantly enhancing the safety, reliability, and efficiency of cold chain logistics. Furthermore, supportive government initiatives and stringent regulations aimed at ensuring the integrity of cold chains and promoting safe, efficient transportation practices are providing a conducive environment for market growth. The increasing disposable income in emerging economies is also contributing to a higher demand for advanced healthcare products, consequently boosting the need for specialized cryogenic transportation services.
Challenges in the Global Cryogenic Transportation Services Market Sector
The cryogenic transportation services market faces several challenges. Stringent regulatory requirements and compliance costs can impact profitability. Supply chain disruptions, particularly those related to fuel costs and equipment availability, can affect operations. Intense competition among established and emerging players necessitates continuous innovation and efficient cost management to maintain competitiveness. The fluctuating price of cryogenic materials such as liquid nitrogen can impact the industry profitability.
Emerging Opportunities in Global Cryogenic Transportation Services Market
Emerging opportunities lie in expanding into new markets, particularly in developing economies where healthcare infrastructure is developing rapidly. The adoption of sustainable and eco-friendly cryogenic transportation solutions presents significant opportunities. The integration of advanced technologies such as AI and IoT in logistics management provides enhanced efficiency, safety, and cost savings. The development of specialized cryogenic containers for specific applications also represents a promising area for growth.
Leading Players in the Global Cryogenic Transportation Services Market Market
- Core Cryolab
- New England Cryogenic Center
- COREX Logistics
- GetCryo
- LGT Transport
- Applied Cryo Technologies
- US Cryo Carriers
- McCollister's
- Legacy Cryogenic
- KAG
- Texas Gas Transport
- 7 3 Other Companies
- Hingham Moving
- Champion Moving
Key Developments in Global Cryogenic Transportation Services Market Industry
- October 2023: COREX Logistics joined the Irish Pharmaceutical Health Association, strengthening its position in the pharmaceutical industry. This significantly impacts its market share and competitive advantage.
- September 2023: Core Cryolab opened a second state-of-the-art facility, enhancing its capacity and service capabilities, and improving its competitive positioning.
Future Outlook for Global Cryogenic Transportation Services Market Market
The global cryogenic transportation services market is poised for continued growth, driven by rising demand from various sectors, technological advancements, and expanding global healthcare infrastructure. Strategic partnerships and collaborations among players will shape the industry landscape. Focusing on sustainable practices and efficient logistics management will be critical for long-term success. The market's future growth depends on adapting to evolving regulations and technological trends.
Global Cryogenic Transportation Services Market Segmentation
-
1. Type
- 1.1. Trailer Transportation
- 1.2. Truck Transportation
-
2. Application
- 2.1. Chemicals
- 2.2. Drug
- 2.3. Biological Specimens
- 2.4. Industrial Gases
- 2.5. Other Applications
Global Cryogenic Transportation Services Market Segmentation By Geography
-
1. North America
- 1.1. United States
- 1.2. Canada
- 1.3. Mexico
-
2. Europe
- 2.1. Germany
- 2.2. France
- 2.3. Italy
- 2.4. United Kingdom
- 2.5. Spain
- 2.6. Rest of Europe
-
3. Asia Pacific
- 3.1. China
- 3.2. India
- 3.3. Japan
- 3.4. Australia
- 3.5. Singapore
- 3.6. Indonesia
- 3.7. South Korea
- 3.8. Malaysia
- 3.9. Rest of Asia Pacific
-
4. Middle East and Africa
- 4.1. Saudi Arabia
- 4.2. Qatar
- 4.3. Oman
- 4.4. Rest of Middle East and Africa
-
5. Latin America
- 5.1. Brazil
- 5.2. Argentina
- 5.3. Chile
- 5.4. Rest of Latin America
Global Cryogenic Transportation Services Market Regional Market Share
Geographic Coverage of Global Cryogenic Transportation Services Market
Global Cryogenic Transportation Services Market REPORT HIGHLIGHTS
| Aspects | Details |
|---|---|
| Study Period | 2020-2034 |
| Base Year | 2025 |
| Estimated Year | 2026 |
| Forecast Period | 2026-2034 |
| Historical Period | 2020-2025 |
| Growth Rate | CAGR of 6.75% from 2020-2034 |
| Segmentation |
|
Table of Contents
- 1. Introduction
- 1.1. Research Scope
- 1.2. Market Segmentation
- 1.3. Research Objective
- 1.4. Definitions and Assumptions
- 2. Executive Summary
- 2.1. Market Snapshot
- 3. Market Dynamics
- 3.1. Market Drivers
- 3.2. Market Restrains
- 3.3. Market Trends
- 3.4. Market Opportunities
- 4. Market Factor Analysis
- 4.1. Porters Five Forces
- 4.1.1. Bargaining Power of Suppliers
- 4.1.2. Bargaining Power of Buyers
- 4.1.3. Threat of New Entrants
- 4.1.4. Threat of Substitutes
- 4.1.5. Competitive Rivalry
- 4.2. PESTEL analysis
- 4.3. BCG Analysis
- 4.3.1. Stars (High Growth, High Market Share)
- 4.3.2. Cash Cows (Low Growth, High Market Share)
- 4.3.3. Question Mark (High Growth, Low Market Share)
- 4.3.4. Dogs (Low Growth, Low Market Share)
- 4.4. Ansoff Matrix Analysis
- 4.5. Supply Chain Analysis
- 4.6. Regulatory Landscape
- 4.7. Current Market Potential and Opportunity Assessment (TAM–SAM–SOM Framework)
- 4.8. PRI Analyst Note
- 4.1. Porters Five Forces
- 5. Market Analysis, Insights and Forecast 2021-2033
- 5.1. Market Analysis, Insights and Forecast - by Type
- 5.1.1. Trailer Transportation
- 5.1.2. Truck Transportation
- 5.2. Market Analysis, Insights and Forecast - by Application
- 5.2.1. Chemicals
- 5.2.2. Drug
- 5.2.3. Biological Specimens
- 5.2.4. Industrial Gases
- 5.2.5. Other Applications
- 5.3. Market Analysis, Insights and Forecast - by Region
- 5.3.1. North America
- 5.3.2. Europe
- 5.3.3. Asia Pacific
- 5.3.4. Middle East and Africa
- 5.3.5. Latin America
- 5.1. Market Analysis, Insights and Forecast - by Type
- 6. Global Cryogenic Transportation Services Market Analysis, Insights and Forecast, 2021-2033
- 6.1. Market Analysis, Insights and Forecast - by Type
- 6.1.1. Trailer Transportation
- 6.1.2. Truck Transportation
- 6.2. Market Analysis, Insights and Forecast - by Application
- 6.2.1. Chemicals
- 6.2.2. Drug
- 6.2.3. Biological Specimens
- 6.2.4. Industrial Gases
- 6.2.5. Other Applications
- 6.1. Market Analysis, Insights and Forecast - by Type
- 7. North America Global Cryogenic Transportation Services Market Analysis, Insights and Forecast, 2020-2032
- 7.1. Market Analysis, Insights and Forecast - by Type
- 7.1.1. Trailer Transportation
- 7.1.2. Truck Transportation
- 7.2. Market Analysis, Insights and Forecast - by Application
- 7.2.1. Chemicals
- 7.2.2. Drug
- 7.2.3. Biological Specimens
- 7.2.4. Industrial Gases
- 7.2.5. Other Applications
- 7.1. Market Analysis, Insights and Forecast - by Type
- 8. Europe Global Cryogenic Transportation Services Market Analysis, Insights and Forecast, 2020-2032
- 8.1. Market Analysis, Insights and Forecast - by Type
- 8.1.1. Trailer Transportation
- 8.1.2. Truck Transportation
- 8.2. Market Analysis, Insights and Forecast - by Application
- 8.2.1. Chemicals
- 8.2.2. Drug
- 8.2.3. Biological Specimens
- 8.2.4. Industrial Gases
- 8.2.5. Other Applications
- 8.1. Market Analysis, Insights and Forecast - by Type
- 9. Asia Pacific Global Cryogenic Transportation Services Market Analysis, Insights and Forecast, 2020-2032
- 9.1. Market Analysis, Insights and Forecast - by Type
- 9.1.1. Trailer Transportation
- 9.1.2. Truck Transportation
- 9.2. Market Analysis, Insights and Forecast - by Application
- 9.2.1. Chemicals
- 9.2.2. Drug
- 9.2.3. Biological Specimens
- 9.2.4. Industrial Gases
- 9.2.5. Other Applications
- 9.1. Market Analysis, Insights and Forecast - by Type
- 10. Middle East and Africa Global Cryogenic Transportation Services Market Analysis, Insights and Forecast, 2020-2032
- 10.1. Market Analysis, Insights and Forecast - by Type
- 10.1.1. Trailer Transportation
- 10.1.2. Truck Transportation
- 10.2. Market Analysis, Insights and Forecast - by Application
- 10.2.1. Chemicals
- 10.2.2. Drug
- 10.2.3. Biological Specimens
- 10.2.4. Industrial Gases
- 10.2.5. Other Applications
- 10.1. Market Analysis, Insights and Forecast - by Type
- 11. Latin America Global Cryogenic Transportation Services Market Analysis, Insights and Forecast, 2020-2032
- 11.1. Market Analysis, Insights and Forecast - by Type
- 11.1.1. Trailer Transportation
- 11.1.2. Truck Transportation
- 11.2. Market Analysis, Insights and Forecast - by Application
- 11.2.1. Chemicals
- 11.2.2. Drug
- 11.2.3. Biological Specimens
- 11.2.4. Industrial Gases
- 11.2.5. Other Applications
- 11.1. Market Analysis, Insights and Forecast - by Type
- 12. Competitive Analysis
- 12.1. Company Profiles
- 12.1.1 Core Cryolab
- 12.1.1.1. Company Overview
- 12.1.1.2. Products
- 12.1.1.3. Company Financials
- 12.1.1.4. SWOT Analysis
- 12.1.2 New England Cryogenic Center
- 12.1.2.1. Company Overview
- 12.1.2.2. Products
- 12.1.2.3. Company Financials
- 12.1.2.4. SWOT Analysis
- 12.1.3 COREX Logistics
- 12.1.3.1. Company Overview
- 12.1.3.2. Products
- 12.1.3.3. Company Financials
- 12.1.3.4. SWOT Analysis
- 12.1.4 GetCryo
- 12.1.4.1. Company Overview
- 12.1.4.2. Products
- 12.1.4.3. Company Financials
- 12.1.4.4. SWOT Analysis
- 12.1.5 LGT Transport
- 12.1.5.1. Company Overview
- 12.1.5.2. Products
- 12.1.5.3. Company Financials
- 12.1.5.4. SWOT Analysis
- 12.1.6 Applied Cryo Technologies
- 12.1.6.1. Company Overview
- 12.1.6.2. Products
- 12.1.6.3. Company Financials
- 12.1.6.4. SWOT Analysis
- 12.1.7 US Cryo Carriers
- 12.1.7.1. Company Overview
- 12.1.7.2. Products
- 12.1.7.3. Company Financials
- 12.1.7.4. SWOT Analysis
- 12.1.8 McCollister's
- 12.1.8.1. Company Overview
- 12.1.8.2. Products
- 12.1.8.3. Company Financials
- 12.1.8.4. SWOT Analysis
- 12.1.9 Legacy Cryogenic
- 12.1.9.1. Company Overview
- 12.1.9.2. Products
- 12.1.9.3. Company Financials
- 12.1.9.4. SWOT Analysis
- 12.1.10 KAG
- 12.1.10.1. Company Overview
- 12.1.10.2. Products
- 12.1.10.3. Company Financials
- 12.1.10.4. SWOT Analysis
- 12.1.11 Texas Gas Transport*7 3 Other Companie
- 12.1.11.1. Company Overview
- 12.1.11.2. Products
- 12.1.11.3. Company Financials
- 12.1.11.4. SWOT Analysis
- 12.1.12 Hingham Moving
- 12.1.12.1. Company Overview
- 12.1.12.2. Products
- 12.1.12.3. Company Financials
- 12.1.12.4. SWOT Analysis
- 12.1.13 Champion Moving
- 12.1.13.1. Company Overview
- 12.1.13.2. Products
- 12.1.13.3. Company Financials
- 12.1.13.4. SWOT Analysis
- 12.1.1 Core Cryolab
- 12.2. Market Entropy
- 12.2.1 Company's Key Areas Served
- 12.2.2 Recent Developments
- 12.3. Company Market Share Analysis 2025
- 12.3.1 Top 5 Companies Market Share Analysis
- 12.3.2 Top 3 Companies Market Share Analysis
- 12.4. List of Potential Customers
- 13. Research Methodology
List of Figures
- Figure 1: Global Global Cryogenic Transportation Services Market Revenue Breakdown (Million, %) by Region 2025 & 2033
- Figure 2: North America Global Cryogenic Transportation Services Market Revenue (Million), by Type 2025 & 2033
- Figure 3: North America Global Cryogenic Transportation Services Market Revenue Share (%), by Type 2025 & 2033
- Figure 4: North America Global Cryogenic Transportation Services Market Revenue (Million), by Application 2025 & 2033
- Figure 5: North America Global Cryogenic Transportation Services Market Revenue Share (%), by Application 2025 & 2033
- Figure 6: North America Global Cryogenic Transportation Services Market Revenue (Million), by Country 2025 & 2033
- Figure 7: North America Global Cryogenic Transportation Services Market Revenue Share (%), by Country 2025 & 2033
- Figure 8: Europe Global Cryogenic Transportation Services Market Revenue (Million), by Type 2025 & 2033
- Figure 9: Europe Global Cryogenic Transportation Services Market Revenue Share (%), by Type 2025 & 2033
- Figure 10: Europe Global Cryogenic Transportation Services Market Revenue (Million), by Application 2025 & 2033
- Figure 11: Europe Global Cryogenic Transportation Services Market Revenue Share (%), by Application 2025 & 2033
- Figure 12: Europe Global Cryogenic Transportation Services Market Revenue (Million), by Country 2025 & 2033
- Figure 13: Europe Global Cryogenic Transportation Services Market Revenue Share (%), by Country 2025 & 2033
- Figure 14: Asia Pacific Global Cryogenic Transportation Services Market Revenue (Million), by Type 2025 & 2033
- Figure 15: Asia Pacific Global Cryogenic Transportation Services Market Revenue Share (%), by Type 2025 & 2033
- Figure 16: Asia Pacific Global Cryogenic Transportation Services Market Revenue (Million), by Application 2025 & 2033
- Figure 17: Asia Pacific Global Cryogenic Transportation Services Market Revenue Share (%), by Application 2025 & 2033
- Figure 18: Asia Pacific Global Cryogenic Transportation Services Market Revenue (Million), by Country 2025 & 2033
- Figure 19: Asia Pacific Global Cryogenic Transportation Services Market Revenue Share (%), by Country 2025 & 2033
- Figure 20: Middle East and Africa Global Cryogenic Transportation Services Market Revenue (Million), by Type 2025 & 2033
- Figure 21: Middle East and Africa Global Cryogenic Transportation Services Market Revenue Share (%), by Type 2025 & 2033
- Figure 22: Middle East and Africa Global Cryogenic Transportation Services Market Revenue (Million), by Application 2025 & 2033
- Figure 23: Middle East and Africa Global Cryogenic Transportation Services Market Revenue Share (%), by Application 2025 & 2033
- Figure 24: Middle East and Africa Global Cryogenic Transportation Services Market Revenue (Million), by Country 2025 & 2033
- Figure 25: Middle East and Africa Global Cryogenic Transportation Services Market Revenue Share (%), by Country 2025 & 2033
- Figure 26: Latin America Global Cryogenic Transportation Services Market Revenue (Million), by Type 2025 & 2033
- Figure 27: Latin America Global Cryogenic Transportation Services Market Revenue Share (%), by Type 2025 & 2033
- Figure 28: Latin America Global Cryogenic Transportation Services Market Revenue (Million), by Application 2025 & 2033
- Figure 29: Latin America Global Cryogenic Transportation Services Market Revenue Share (%), by Application 2025 & 2033
- Figure 30: Latin America Global Cryogenic Transportation Services Market Revenue (Million), by Country 2025 & 2033
- Figure 31: Latin America Global Cryogenic Transportation Services Market Revenue Share (%), by Country 2025 & 2033
List of Tables
- Table 1: Global Cryogenic Transportation Services Market Revenue Million Forecast, by Type 2020 & 2033
- Table 2: Global Cryogenic Transportation Services Market Revenue Million Forecast, by Application 2020 & 2033
- Table 3: Global Cryogenic Transportation Services Market Revenue Million Forecast, by Region 2020 & 2033
- Table 4: Global Cryogenic Transportation Services Market Revenue Million Forecast, by Type 2020 & 2033
- Table 5: Global Cryogenic Transportation Services Market Revenue Million Forecast, by Application 2020 & 2033
- Table 6: Global Cryogenic Transportation Services Market Revenue Million Forecast, by Country 2020 & 2033
- Table 7: United States Global Cryogenic Transportation Services Market Revenue (Million) Forecast, by Application 2020 & 2033
- Table 8: Canada Global Cryogenic Transportation Services Market Revenue (Million) Forecast, by Application 2020 & 2033
- Table 9: Mexico Global Cryogenic Transportation Services Market Revenue (Million) Forecast, by Application 2020 & 2033
- Table 10: Global Cryogenic Transportation Services Market Revenue Million Forecast, by Type 2020 & 2033
- Table 11: Global Cryogenic Transportation Services Market Revenue Million Forecast, by Application 2020 & 2033
- Table 12: Global Cryogenic Transportation Services Market Revenue Million Forecast, by Country 2020 & 2033
- Table 13: Germany Global Cryogenic Transportation Services Market Revenue (Million) Forecast, by Application 2020 & 2033
- Table 14: France Global Cryogenic Transportation Services Market Revenue (Million) Forecast, by Application 2020 & 2033
- Table 15: Italy Global Cryogenic Transportation Services Market Revenue (Million) Forecast, by Application 2020 & 2033
- Table 16: United Kingdom Global Cryogenic Transportation Services Market Revenue (Million) Forecast, by Application 2020 & 2033
- Table 17: Spain Global Cryogenic Transportation Services Market Revenue (Million) Forecast, by Application 2020 & 2033
- Table 18: Rest of Europe Global Cryogenic Transportation Services Market Revenue (Million) Forecast, by Application 2020 & 2033
- Table 19: Global Cryogenic Transportation Services Market Revenue Million Forecast, by Type 2020 & 2033
- Table 20: Global Cryogenic Transportation Services Market Revenue Million Forecast, by Application 2020 & 2033
- Table 21: Global Cryogenic Transportation Services Market Revenue Million Forecast, by Country 2020 & 2033
- Table 22: China Global Cryogenic Transportation Services Market Revenue (Million) Forecast, by Application 2020 & 2033
- Table 23: India Global Cryogenic Transportation Services Market Revenue (Million) Forecast, by Application 2020 & 2033
- Table 24: Japan Global Cryogenic Transportation Services Market Revenue (Million) Forecast, by Application 2020 & 2033
- Table 25: Australia Global Cryogenic Transportation Services Market Revenue (Million) Forecast, by Application 2020 & 2033
- Table 26: Singapore Global Cryogenic Transportation Services Market Revenue (Million) Forecast, by Application 2020 & 2033
- Table 27: Indonesia Global Cryogenic Transportation Services Market Revenue (Million) Forecast, by Application 2020 & 2033
- Table 28: South Korea Global Cryogenic Transportation Services Market Revenue (Million) Forecast, by Application 2020 & 2033
- Table 29: Malaysia Global Cryogenic Transportation Services Market Revenue (Million) Forecast, by Application 2020 & 2033
- Table 30: Rest of Asia Pacific Global Cryogenic Transportation Services Market Revenue (Million) Forecast, by Application 2020 & 2033
- Table 31: Global Cryogenic Transportation Services Market Revenue Million Forecast, by Type 2020 & 2033
- Table 32: Global Cryogenic Transportation Services Market Revenue Million Forecast, by Application 2020 & 2033
- Table 33: Global Cryogenic Transportation Services Market Revenue Million Forecast, by Country 2020 & 2033
- Table 34: Saudi Arabia Global Cryogenic Transportation Services Market Revenue (Million) Forecast, by Application 2020 & 2033
- Table 35: Qatar Global Cryogenic Transportation Services Market Revenue (Million) Forecast, by Application 2020 & 2033
- Table 36: Oman Global Cryogenic Transportation Services Market Revenue (Million) Forecast, by Application 2020 & 2033
- Table 37: Rest of Middle East and Africa Global Cryogenic Transportation Services Market Revenue (Million) Forecast, by Application 2020 & 2033
- Table 38: Global Cryogenic Transportation Services Market Revenue Million Forecast, by Type 2020 & 2033
- Table 39: Global Cryogenic Transportation Services Market Revenue Million Forecast, by Application 2020 & 2033
- Table 40: Global Cryogenic Transportation Services Market Revenue Million Forecast, by Country 2020 & 2033
- Table 41: Brazil Global Cryogenic Transportation Services Market Revenue (Million) Forecast, by Application 2020 & 2033
- Table 42: Argentina Global Cryogenic Transportation Services Market Revenue (Million) Forecast, by Application 2020 & 2033
- Table 43: Chile Global Cryogenic Transportation Services Market Revenue (Million) Forecast, by Application 2020 & 2033
- Table 44: Rest of Latin America Global Cryogenic Transportation Services Market Revenue (Million) Forecast, by Application 2020 & 2033
Frequently Asked Questions
1. What is the projected Compound Annual Growth Rate (CAGR) of the Global Cryogenic Transportation Services Market?
The projected CAGR is approximately 6.75%.
2. Which companies are prominent players in the Global Cryogenic Transportation Services Market?
Key companies in the market include Core Cryolab, New England Cryogenic Center, COREX Logistics, GetCryo, LGT Transport, Applied Cryo Technologies, US Cryo Carriers, McCollister's, Legacy Cryogenic, KAG, Texas Gas Transport*7 3 Other Companie, Hingham Moving, Champion Moving.
3. What are the main segments of the Global Cryogenic Transportation Services Market?
The market segments include Type, Application.
4. Can you provide details about the market size?
The market size is estimated to be USD 10.52 Million as of 2022.
5. What are some drivers contributing to market growth?
Growth of Life Sciences and Healthcare; Expanding Food and Beverage Industry; Growing Focus on Renewable Energy.
6. What are the notable trends driving market growth?
North America Dominates the Global Market Share in the Coming Years.
7. Are there any restraints impacting market growth?
High Initial Investment Costs; Skilled Workforce Shortage; Infrastructure.
8. Can you provide examples of recent developments in the market?
October 2023: COREX Logistics has officially become a member of the Irish Pharmaceutical Health Association, joining industry giants such as Bayer, GlaxoSmithKline, and Eli Lilly in representing the international research-based pharmaceutical industry in Ireland. The members take an active part in strategy development and implementation, helping to shape policy and public debate across areas such as regulation, access, pricing, and health promotion.
9. What pricing options are available for accessing the report?
Pricing options include single-user, multi-user, and enterprise licenses priced at USD 4750, USD 5250, and USD 8750 respectively.
10. Is the market size provided in terms of value or volume?
The market size is provided in terms of value, measured in Million.
11. Are there any specific market keywords associated with the report?
Yes, the market keyword associated with the report is "Global Cryogenic Transportation Services Market," which aids in identifying and referencing the specific market segment covered.
12. How do I determine which pricing option suits my needs best?
The pricing options vary based on user requirements and access needs. Individual users may opt for single-user licenses, while businesses requiring broader access may choose multi-user or enterprise licenses for cost-effective access to the report.
13. Are there any additional resources or data provided in the Global Cryogenic Transportation Services Market report?
While the report offers comprehensive insights, it's advisable to review the specific contents or supplementary materials provided to ascertain if additional resources or data are available.
14. How can I stay updated on further developments or reports in the Global Cryogenic Transportation Services Market?
To stay informed about further developments, trends, and reports in the Global Cryogenic Transportation Services Market, consider subscribing to industry newsletters, following relevant companies and organizations, or regularly checking reputable industry news sources and publications.
Methodology
Step 1 - Identification of Relevant Samples Size from Population Database


Step 2 - Approaches for Defining Global Market Size (Value, Volume* & Price*)

Note*: In applicable scenarios
Step 3 - Data Sources
Primary Research
- Web Analytics
- Survey Reports
- Research Institute
- Latest Research Reports
- Opinion Leaders
Secondary Research
- Annual Reports
- White Paper
- Latest Press Release
- Industry Association
- Paid Database
- Investor Presentations

Step 4 - Data Triangulation
Involves using different sources of information in order to increase the validity of a study
These sources are likely to be stakeholders in a program - participants, other researchers, program staff, other community members, and so on.
Then we put all data in single framework & apply various statistical tools to find out the dynamic on the market.
During the analysis stage, feedback from the stakeholder groups would be compared to determine areas of agreement as well as areas of divergence