

Key Insights
The global glycerin market, valued at approximately 4.78 million in 2025, is projected to experience robust growth, exhibiting a Compound Annual Growth Rate (CAGR) of 4.5% from 2025 to 2033. This expansion is driven by demand from the pharmaceutical and personal care industries, leveraging glycerin's humectant and emollient properties. The increasing production of biofuels, a significant source of glycerin, further fuels market growth. Advancements in refining techniques are enhancing glycerin quality, broadening its applications in food and beverage, alkyd resins, and industrial chemicals. The market is segmented by application (Pharmaceuticals, Food & Beverage, Alkyd Resins, Personal Care & Cosmetics, Industrial Chemicals, Polyether Polyols, Tobacco Humectants, Other Applications) and grade (Crude Glycerin, Refined Glycerin), with refined glycerin offering higher purity and wider application. Glycerin sources include biodiesel production, fatty acids, and fatty alcohols. Key regions for market share are anticipated to be Asia-Pacific and North America, driven by economic development and established industries. Challenges include competitive pressures and fluctuating raw material costs. Significant investment opportunities exist in expanding production capacity and exploring innovative applications.
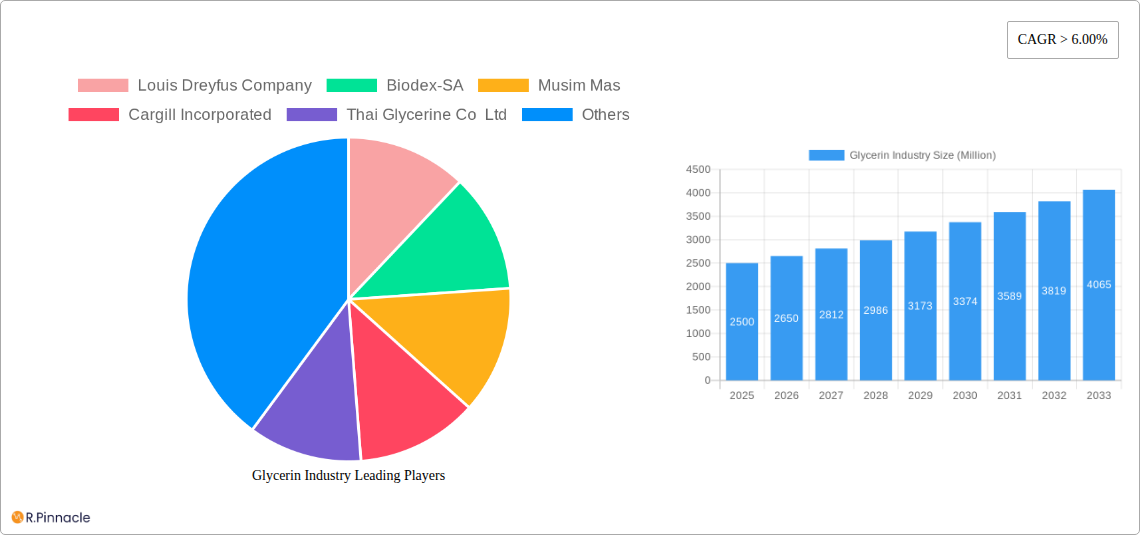
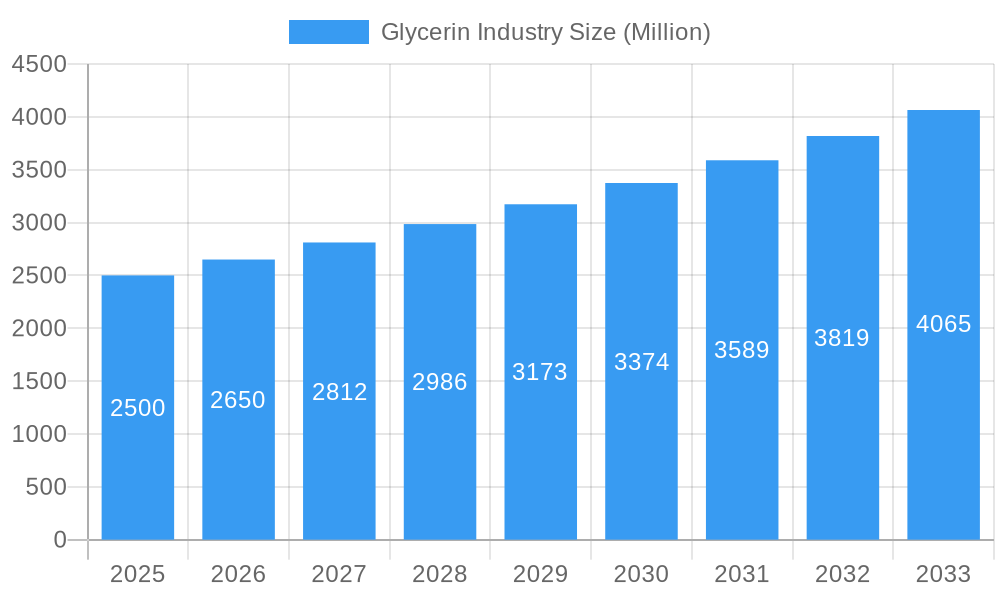
Glycerin Industry Market Size (In Million)
The glycerin market demonstrates a positive future outlook, supported by consistent demand and emerging applications. Key industry players, including Louis Dreyfus Company, Cargill Incorporated, and Wilmar International Ltd, are strategically positioned for growth. Ongoing research and development are focused on improving glycerin's functionality and cost-effectiveness. Regional growth rates will vary based on economic development, regulatory environments, and consumer preferences. Sustainably sourced glycerin is expected to gain preference due to environmental concerns.
Glycerin Industry Company Market Share
Glycerin Industry Market Report: 2019-2033
This comprehensive report provides an in-depth analysis of the global glycerin industry, covering market size, growth drivers, competitive landscape, and future outlook from 2019 to 2033. The report analyzes key segments, including application, grade, and source, offering actionable insights for industry professionals, investors, and strategic decision-makers. With a base year of 2025 and a forecast period of 2025-2033, this report is your essential guide to navigating the dynamic glycerin market. The study period covers 2019-2024 (historical period) and 2025-2033 (forecast period). Expect to find detailed analysis of market share, M&A activities, and CAGR, all presented with the clarity and precision needed for informed business decisions. The total market size is estimated to be in the Millions.
Glycerin Industry Market Structure & Innovation Trends
This section analyzes the competitive landscape of the glycerin industry, identifying key players and examining market concentration. We delve into the innovation drivers shaping the market, regulatory frameworks impacting production and sales, and the role of product substitutes. The analysis includes an overview of end-user demographics and a detailed examination of mergers and acquisitions (M&A) activities within the industry.
- Market Concentration: The glycerin market exhibits a moderately concentrated structure, with several major players holding significant market share. We analyze the market share of key players such as Cargill Incorporated, Wilmar International Ltd, and BASF SE, among others. Further, the report includes xx Million in M&A deal values observed during the study period.
- Innovation Drivers: Technological advancements in biodiesel production and refining processes are key innovation drivers, leading to increased glycerin availability and improved product quality. Research and development in new applications, especially in the bio-based chemicals sector, further contribute to innovation.
- Regulatory Frameworks: Government regulations regarding biodiesel production and waste management impact glycerin production and disposal. We analyze the influence of these regulations on market dynamics.
- Product Substitutes: While glycerin has unique properties, some applications may utilize alternative humectants or solvents. We evaluate the impact of these substitutes on market share.
- End-User Demographics: The report analyzes the end-user segments driving glycerin demand, including pharmaceuticals, personal care, food, and industrial applications. We will analyze the varying needs of each segment.
- M&A Activities: The report examines significant M&A activities in the glycerin industry, including the USD 50 Million acquisition of a blending plant by Oleon in December 2022 and other relevant transactions, providing insights into market consolidation and strategic growth strategies.
Glycerin Industry Market Dynamics & Trends
This section explores the key market dynamics and trends shaping the global glycerin industry. We examine market growth drivers, technological disruptions, evolving consumer preferences, and competitive dynamics. Specific metrics, including CAGR and market penetration for various segments will be presented. The global market value is estimated at xx Million in the estimated year and is projected to reach xx Million by 2033, demonstrating a CAGR of xx%.
(This section will contain approximately 600 words detailing the market dynamics and trends.)
Dominant Regions & Segments in Glycerin Industry
This section identifies the leading regions and segments within the glycerin market. We analyze the factors driving dominance in each segment, including application (Pharmaceuticals, Food and Beverage, Alkyd Resins, Personal Care and Cosmetics, Industrial Chemicals, Polyether Polyols, Tobacco Humectants, Other Applications), grade (Crude Glycerin, Refined Glycerin), and source (Biodiesels, Fatty Acids, Fatty Alcohols, Other Sources).
Leading Region: (Insert leading region, e.g., Asia-Pacific) is expected to dominate the market owing to (Reasons for dominance, such as: strong economic growth, increasing demand from key sectors, favorable government policies).
Key Drivers:
- Economic growth and industrial expansion.
- Increasing demand from key end-use sectors.
- Government incentives and supportive policies.
- Growing adoption of bio-based products.
- Development of advanced refining technologies.
(This section will continue with similar bullet points and paragraphs detailing the dominance of specific segments and countries in approximately 600 words.)
Glycerin Industry Product Innovations
This section summarizes recent product developments, highlighting their applications and competitive advantages. We focus on technological advancements and their impact on market fit and adoption. The industry has seen developments in refining processes, leading to higher purity glycerin with improved applications in various industries. New grades are being tailored to specific applications, enhancing performance and value.
Report Scope & Segmentation Analysis
This report segments the glycerin market based on application, grade, and source. Growth projections, market sizes, and competitive dynamics are provided for each segment.
- Application: (Each application segment will have a short paragraph describing market size, growth projections, and competitive dynamics. This will be repeated for each application.)
- Grade: (Each grade segment will have a short paragraph describing market size, growth projections, and competitive dynamics. This will be repeated for each grade.)
- Source: (Each source segment will have a short paragraph describing market size, growth projections, and competitive dynamics. This will be repeated for each source.)
Key Drivers of Glycerin Industry Growth
The glycerin industry’s growth is driven by several factors. The rising demand for bio-based products is pushing the market forward, while increased biodiesel production leads to a higher supply of glycerin. Moreover, advancements in refining techniques are improving the quality and applications of glycerin, leading to increased demand across various sectors.
Challenges in the Glycerin Industry Sector
Several challenges hinder the glycerin industry’s growth. Fluctuations in biodiesel production can impact glycerin supply, leading to price volatility. Additionally, competition from alternative humectants and solvents necessitates continuous innovation and diversification. Stringent regulations regarding waste management also pose challenges. These factors contribute to an overall unstable market. Further, the availability of crude glycerin from biodiesel production is subject to variation, affecting overall supply.
Emerging Opportunities in Glycerin Industry
The glycerin industry presents significant opportunities. Expanding applications in niche markets, like personal care and pharmaceuticals, create avenues for growth. Furthermore, advancements in glycerol derivatives and value-added products are offering enhanced revenue streams. The development of more sustainable and cost-effective production processes will further increase the growth trajectory of the glycerin industry.
Leading Players in the Glycerin Industry Market
- Cargill Incorporated
- Wilmar International Ltd
- BASF SE
- Louis Dreyfus Company
- Biodex-SA
- Musim Mas
- Thai Glycerine Co Ltd
- RB FUELS
- Vantage Specialty Chemicals
- KLK OLEO
- Sebacic India Limited
- IOI Corporation Berhad
- P&G Chemicals
- Archer Daniels Midland Company
- Emery Oleochemicals
- Dow
- Munzer Bioindustrie GmbH
- Godrej Industries Limited
- Oleon NV
- Vance Group Ltd
- Kao Corporation
- Aemetis
Key Developments in Glycerin Industry
- December 2022: Oleon acquired a blending plant in Conroe, Texas, for USD 50 Million, strengthening its oleochemicals division.
- October 2021: IOI Corporation Berhad announced the construction of a new 110,000 MT per year oleochemical plant in Prai, Penang, with a capital expenditure of MYR 220 Million.
Future Outlook for Glycerin Industry Market
The glycerin market is poised for significant growth, driven by rising demand across various sectors and advancements in production technology. Strategic partnerships and collaborations within the industry are expected to further accelerate growth. The increased focus on sustainable and renewable resources provides fertile ground for innovation and expansion. The market outlook is positive, reflecting the robust growth and the potential for expansion in both established and emerging markets.
Glycerin Industry Segmentation
-
1. Grade
- 1.1. Crude Glycerin
- 1.2. Refined Glycerin
-
2. Source
- 2.1. Biodiesels
- 2.2. Fatty Acids
- 2.3. Fatty Alcohols
- 2.4. Other Sources
-
3. Application
- 3.1. Pharmaceuticals
- 3.2. Food and Beverage
- 3.3. Alkyd Resins
- 3.4. Personal Care and Cosmetics
- 3.5. Industrial Chemicals
- 3.6. Polyether Polyols
- 3.7. Tobacco Humectants
- 3.8. Other Applications
Glycerin Industry Segmentation By Geography
-
1. Asia Pacific
- 1.1. China
- 1.2. India
- 1.3. Japan
- 1.4. South Korea
- 1.5. Rest of Asia Pacific
-
2. North America
- 2.1. United States
- 2.2. Canada
- 2.3. Mexico
- 2.4. Rest of North America
-
3. Europe
- 3.1. Germany
- 3.2. United Kingdom
- 3.3. Italy
- 3.4. France
- 3.5. Rest of Europe
-
4. South America
- 4.1. Brazil
- 4.2. Argentina
- 4.3. Rest of South America
-
5. Middle East and Africa
- 5.1. Saudi Arabia
- 5.2. South Africa
- 5.3. United Arab Emirates
- 5.4. Rest of Middle East and Africa
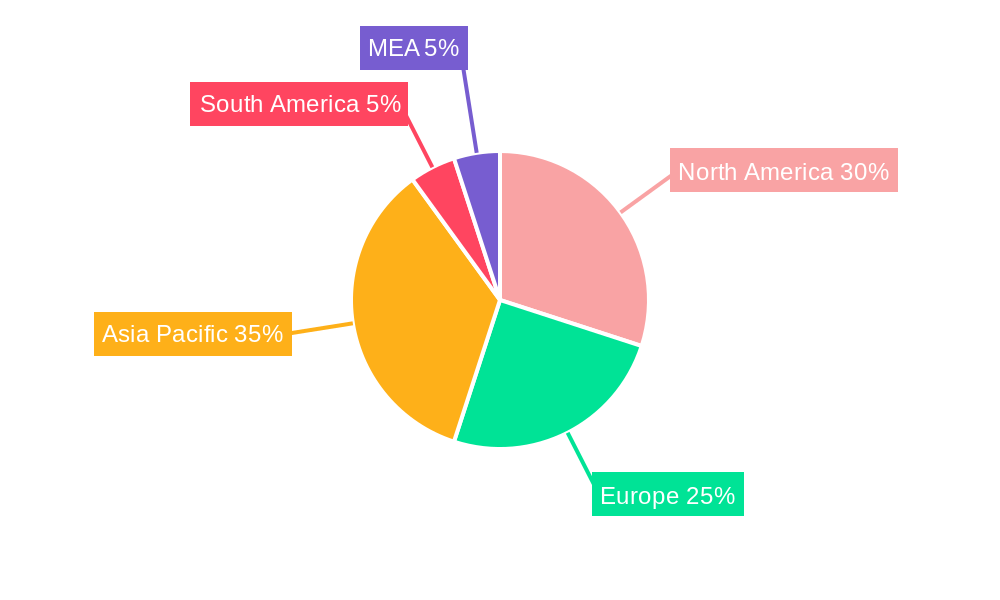
Glycerin Industry Regional Market Share
Geographic Coverage of Glycerin Industry
Glycerin Industry REPORT HIGHLIGHTS
| Aspects | Details |
|---|---|
| Study Period | 2020-2034 |
| Base Year | 2025 |
| Estimated Year | 2026 |
| Forecast Period | 2026-2034 |
| Historical Period | 2020-2025 |
| Growth Rate | CAGR of 4.5% from 2020-2034 |
| Segmentation |
|
Table of Contents
- 1. Introduction
- 1.1. Research Scope
- 1.2. Market Segmentation
- 1.3. Research Objective
- 1.4. Definitions and Assumptions
- 2. Executive Summary
- 2.1. Market Snapshot
- 3. Market Dynamics
- 3.1. Market Drivers
- 3.2. Market Restrains
- 3.3. Market Trends
- 3.4. Market Opportunities
- 4. Market Factor Analysis
- 4.1. Porters Five Forces
- 4.1.1. Bargaining Power of Suppliers
- 4.1.2. Bargaining Power of Buyers
- 4.1.3. Threat of New Entrants
- 4.1.4. Threat of Substitutes
- 4.1.5. Competitive Rivalry
- 4.2. PESTEL analysis
- 4.3. BCG Analysis
- 4.3.1. Stars (High Growth, High Market Share)
- 4.3.2. Cash Cows (Low Growth, High Market Share)
- 4.3.3. Question Mark (High Growth, Low Market Share)
- 4.3.4. Dogs (Low Growth, Low Market Share)
- 4.4. Ansoff Matrix Analysis
- 4.5. Supply Chain Analysis
- 4.6. Regulatory Landscape
- 4.7. Current Market Potential and Opportunity Assessment (TAM–SAM–SOM Framework)
- 4.8. PRI Analyst Note
- 4.1. Porters Five Forces
- 5. Market Analysis, Insights and Forecast 2021-2033
- 5.1. Market Analysis, Insights and Forecast - by Grade
- 5.1.1. Crude Glycerin
- 5.1.2. Refined Glycerin
- 5.2. Market Analysis, Insights and Forecast - by Source
- 5.2.1. Biodiesels
- 5.2.2. Fatty Acids
- 5.2.3. Fatty Alcohols
- 5.2.4. Other Sources
- 5.3. Market Analysis, Insights and Forecast - by Application
- 5.3.1. Pharmaceuticals
- 5.3.2. Food and Beverage
- 5.3.3. Alkyd Resins
- 5.3.4. Personal Care and Cosmetics
- 5.3.5. Industrial Chemicals
- 5.3.6. Polyether Polyols
- 5.3.7. Tobacco Humectants
- 5.3.8. Other Applications
- 5.4. Market Analysis, Insights and Forecast - by Region
- 5.4.1. Asia Pacific
- 5.4.2. North America
- 5.4.3. Europe
- 5.4.4. South America
- 5.4.5. Middle East and Africa
- 5.1. Market Analysis, Insights and Forecast - by Grade
- 6. Global Glycerin Industry Analysis, Insights and Forecast, 2021-2033
- 6.1. Market Analysis, Insights and Forecast - by Grade
- 6.1.1. Crude Glycerin
- 6.1.2. Refined Glycerin
- 6.2. Market Analysis, Insights and Forecast - by Source
- 6.2.1. Biodiesels
- 6.2.2. Fatty Acids
- 6.2.3. Fatty Alcohols
- 6.2.4. Other Sources
- 6.3. Market Analysis, Insights and Forecast - by Application
- 6.3.1. Pharmaceuticals
- 6.3.2. Food and Beverage
- 6.3.3. Alkyd Resins
- 6.3.4. Personal Care and Cosmetics
- 6.3.5. Industrial Chemicals
- 6.3.6. Polyether Polyols
- 6.3.7. Tobacco Humectants
- 6.3.8. Other Applications
- 6.1. Market Analysis, Insights and Forecast - by Grade
- 7. Asia Pacific Glycerin Industry Analysis, Insights and Forecast, 2020-2032
- 7.1. Market Analysis, Insights and Forecast - by Grade
- 7.1.1. Crude Glycerin
- 7.1.2. Refined Glycerin
- 7.2. Market Analysis, Insights and Forecast - by Source
- 7.2.1. Biodiesels
- 7.2.2. Fatty Acids
- 7.2.3. Fatty Alcohols
- 7.2.4. Other Sources
- 7.3. Market Analysis, Insights and Forecast - by Application
- 7.3.1. Pharmaceuticals
- 7.3.2. Food and Beverage
- 7.3.3. Alkyd Resins
- 7.3.4. Personal Care and Cosmetics
- 7.3.5. Industrial Chemicals
- 7.3.6. Polyether Polyols
- 7.3.7. Tobacco Humectants
- 7.3.8. Other Applications
- 7.1. Market Analysis, Insights and Forecast - by Grade
- 8. North America Glycerin Industry Analysis, Insights and Forecast, 2020-2032
- 8.1. Market Analysis, Insights and Forecast - by Grade
- 8.1.1. Crude Glycerin
- 8.1.2. Refined Glycerin
- 8.2. Market Analysis, Insights and Forecast - by Source
- 8.2.1. Biodiesels
- 8.2.2. Fatty Acids
- 8.2.3. Fatty Alcohols
- 8.2.4. Other Sources
- 8.3. Market Analysis, Insights and Forecast - by Application
- 8.3.1. Pharmaceuticals
- 8.3.2. Food and Beverage
- 8.3.3. Alkyd Resins
- 8.3.4. Personal Care and Cosmetics
- 8.3.5. Industrial Chemicals
- 8.3.6. Polyether Polyols
- 8.3.7. Tobacco Humectants
- 8.3.8. Other Applications
- 8.1. Market Analysis, Insights and Forecast - by Grade
- 9. Europe Glycerin Industry Analysis, Insights and Forecast, 2020-2032
- 9.1. Market Analysis, Insights and Forecast - by Grade
- 9.1.1. Crude Glycerin
- 9.1.2. Refined Glycerin
- 9.2. Market Analysis, Insights and Forecast - by Source
- 9.2.1. Biodiesels
- 9.2.2. Fatty Acids
- 9.2.3. Fatty Alcohols
- 9.2.4. Other Sources
- 9.3. Market Analysis, Insights and Forecast - by Application
- 9.3.1. Pharmaceuticals
- 9.3.2. Food and Beverage
- 9.3.3. Alkyd Resins
- 9.3.4. Personal Care and Cosmetics
- 9.3.5. Industrial Chemicals
- 9.3.6. Polyether Polyols
- 9.3.7. Tobacco Humectants
- 9.3.8. Other Applications
- 9.1. Market Analysis, Insights and Forecast - by Grade
- 10. South America Glycerin Industry Analysis, Insights and Forecast, 2020-2032
- 10.1. Market Analysis, Insights and Forecast - by Grade
- 10.1.1. Crude Glycerin
- 10.1.2. Refined Glycerin
- 10.2. Market Analysis, Insights and Forecast - by Source
- 10.2.1. Biodiesels
- 10.2.2. Fatty Acids
- 10.2.3. Fatty Alcohols
- 10.2.4. Other Sources
- 10.3. Market Analysis, Insights and Forecast - by Application
- 10.3.1. Pharmaceuticals
- 10.3.2. Food and Beverage
- 10.3.3. Alkyd Resins
- 10.3.4. Personal Care and Cosmetics
- 10.3.5. Industrial Chemicals
- 10.3.6. Polyether Polyols
- 10.3.7. Tobacco Humectants
- 10.3.8. Other Applications
- 10.1. Market Analysis, Insights and Forecast - by Grade
- 11. Middle East and Africa Glycerin Industry Analysis, Insights and Forecast, 2020-2032
- 11.1. Market Analysis, Insights and Forecast - by Grade
- 11.1.1. Crude Glycerin
- 11.1.2. Refined Glycerin
- 11.2. Market Analysis, Insights and Forecast - by Source
- 11.2.1. Biodiesels
- 11.2.2. Fatty Acids
- 11.2.3. Fatty Alcohols
- 11.2.4. Other Sources
- 11.3. Market Analysis, Insights and Forecast - by Application
- 11.3.1. Pharmaceuticals
- 11.3.2. Food and Beverage
- 11.3.3. Alkyd Resins
- 11.3.4. Personal Care and Cosmetics
- 11.3.5. Industrial Chemicals
- 11.3.6. Polyether Polyols
- 11.3.7. Tobacco Humectants
- 11.3.8. Other Applications
- 11.1. Market Analysis, Insights and Forecast - by Grade
- 12. Competitive Analysis
- 12.1. Company Profiles
- 12.1.1 Louis Dreyfus Company
- 12.1.1.1. Company Overview
- 12.1.1.2. Products
- 12.1.1.3. Company Financials
- 12.1.1.4. SWOT Analysis
- 12.1.2 Biodex-SA
- 12.1.2.1. Company Overview
- 12.1.2.2. Products
- 12.1.2.3. Company Financials
- 12.1.2.4. SWOT Analysis
- 12.1.3 Musim Mas
- 12.1.3.1. Company Overview
- 12.1.3.2. Products
- 12.1.3.3. Company Financials
- 12.1.3.4. SWOT Analysis
- 12.1.4 Cargill Incorporated
- 12.1.4.1. Company Overview
- 12.1.4.2. Products
- 12.1.4.3. Company Financials
- 12.1.4.4. SWOT Analysis
- 12.1.5 Thai Glycerine Co Ltd
- 12.1.5.1. Company Overview
- 12.1.5.2. Products
- 12.1.5.3. Company Financials
- 12.1.5.4. SWOT Analysis
- 12.1.6 RB FUELS
- 12.1.6.1. Company Overview
- 12.1.6.2. Products
- 12.1.6.3. Company Financials
- 12.1.6.4. SWOT Analysis
- 12.1.7 Vantage Specialty Chemicals
- 12.1.7.1. Company Overview
- 12.1.7.2. Products
- 12.1.7.3. Company Financials
- 12.1.7.4. SWOT Analysis
- 12.1.8 KLK OLEO
- 12.1.8.1. Company Overview
- 12.1.8.2. Products
- 12.1.8.3. Company Financials
- 12.1.8.4. SWOT Analysis
- 12.1.9 Sebacic India Limited
- 12.1.9.1. Company Overview
- 12.1.9.2. Products
- 12.1.9.3. Company Financials
- 12.1.9.4. SWOT Analysis
- 12.1.10 IOI Corporation Berhad
- 12.1.10.1. Company Overview
- 12.1.10.2. Products
- 12.1.10.3. Company Financials
- 12.1.10.4. SWOT Analysis
- 12.1.11 Wilmar International Ltd
- 12.1.11.1. Company Overview
- 12.1.11.2. Products
- 12.1.11.3. Company Financials
- 12.1.11.4. SWOT Analysis
- 12.1.12 P&G Chemicals
- 12.1.12.1. Company Overview
- 12.1.12.2. Products
- 12.1.12.3. Company Financials
- 12.1.12.4. SWOT Analysis
- 12.1.13 Archer Daniels Midland Company
- 12.1.13.1. Company Overview
- 12.1.13.2. Products
- 12.1.13.3. Company Financials
- 12.1.13.4. SWOT Analysis
- 12.1.14 Emery Oleochemicals
- 12.1.14.1. Company Overview
- 12.1.14.2. Products
- 12.1.14.3. Company Financials
- 12.1.14.4. SWOT Analysis
- 12.1.15 BASF SE
- 12.1.15.1. Company Overview
- 12.1.15.2. Products
- 12.1.15.3. Company Financials
- 12.1.15.4. SWOT Analysis
- 12.1.16 Dow
- 12.1.16.1. Company Overview
- 12.1.16.2. Products
- 12.1.16.3. Company Financials
- 12.1.16.4. SWOT Analysis
- 12.1.17 Munzer Bioindustrie GmbH
- 12.1.17.1. Company Overview
- 12.1.17.2. Products
- 12.1.17.3. Company Financials
- 12.1.17.4. SWOT Analysis
- 12.1.18 Godrej Industries Limited
- 12.1.18.1. Company Overview
- 12.1.18.2. Products
- 12.1.18.3. Company Financials
- 12.1.18.4. SWOT Analysis
- 12.1.19 Oleon NV
- 12.1.19.1. Company Overview
- 12.1.19.2. Products
- 12.1.19.3. Company Financials
- 12.1.19.4. SWOT Analysis
- 12.1.20 Vance Group Ltd
- 12.1.20.1. Company Overview
- 12.1.20.2. Products
- 12.1.20.3. Company Financials
- 12.1.20.4. SWOT Analysis
- 12.1.21 Kao Corporation
- 12.1.21.1. Company Overview
- 12.1.21.2. Products
- 12.1.21.3. Company Financials
- 12.1.21.4. SWOT Analysis
- 12.1.22 Aemetis
- 12.1.22.1. Company Overview
- 12.1.22.2. Products
- 12.1.22.3. Company Financials
- 12.1.22.4. SWOT Analysis
- 12.1.1 Louis Dreyfus Company
- 12.2. Market Entropy
- 12.2.1 Company's Key Areas Served
- 12.2.2 Recent Developments
- 12.3. Company Market Share Analysis 2025
- 12.3.1 Top 5 Companies Market Share Analysis
- 12.3.2 Top 3 Companies Market Share Analysis
- 12.4. List of Potential Customers
- 13. Research Methodology
List of Figures
- Figure 1: Global Glycerin Industry Revenue Breakdown (million, %) by Region 2025 & 2033
- Figure 2: Global Glycerin Industry Volume Breakdown (K Tons, %) by Region 2025 & 2033
- Figure 3: Asia Pacific Glycerin Industry Revenue (million), by Grade 2025 & 2033
- Figure 4: Asia Pacific Glycerin Industry Volume (K Tons), by Grade 2025 & 2033
- Figure 5: Asia Pacific Glycerin Industry Revenue Share (%), by Grade 2025 & 2033
- Figure 6: Asia Pacific Glycerin Industry Volume Share (%), by Grade 2025 & 2033
- Figure 7: Asia Pacific Glycerin Industry Revenue (million), by Source 2025 & 2033
- Figure 8: Asia Pacific Glycerin Industry Volume (K Tons), by Source 2025 & 2033
- Figure 9: Asia Pacific Glycerin Industry Revenue Share (%), by Source 2025 & 2033
- Figure 10: Asia Pacific Glycerin Industry Volume Share (%), by Source 2025 & 2033
- Figure 11: Asia Pacific Glycerin Industry Revenue (million), by Application 2025 & 2033
- Figure 12: Asia Pacific Glycerin Industry Volume (K Tons), by Application 2025 & 2033
- Figure 13: Asia Pacific Glycerin Industry Revenue Share (%), by Application 2025 & 2033
- Figure 14: Asia Pacific Glycerin Industry Volume Share (%), by Application 2025 & 2033
- Figure 15: Asia Pacific Glycerin Industry Revenue (million), by Country 2025 & 2033
- Figure 16: Asia Pacific Glycerin Industry Volume (K Tons), by Country 2025 & 2033
- Figure 17: Asia Pacific Glycerin Industry Revenue Share (%), by Country 2025 & 2033
- Figure 18: Asia Pacific Glycerin Industry Volume Share (%), by Country 2025 & 2033
- Figure 19: North America Glycerin Industry Revenue (million), by Grade 2025 & 2033
- Figure 20: North America Glycerin Industry Volume (K Tons), by Grade 2025 & 2033
- Figure 21: North America Glycerin Industry Revenue Share (%), by Grade 2025 & 2033
- Figure 22: North America Glycerin Industry Volume Share (%), by Grade 2025 & 2033
- Figure 23: North America Glycerin Industry Revenue (million), by Source 2025 & 2033
- Figure 24: North America Glycerin Industry Volume (K Tons), by Source 2025 & 2033
- Figure 25: North America Glycerin Industry Revenue Share (%), by Source 2025 & 2033
- Figure 26: North America Glycerin Industry Volume Share (%), by Source 2025 & 2033
- Figure 27: North America Glycerin Industry Revenue (million), by Application 2025 & 2033
- Figure 28: North America Glycerin Industry Volume (K Tons), by Application 2025 & 2033
- Figure 29: North America Glycerin Industry Revenue Share (%), by Application 2025 & 2033
- Figure 30: North America Glycerin Industry Volume Share (%), by Application 2025 & 2033
- Figure 31: North America Glycerin Industry Revenue (million), by Country 2025 & 2033
- Figure 32: North America Glycerin Industry Volume (K Tons), by Country 2025 & 2033
- Figure 33: North America Glycerin Industry Revenue Share (%), by Country 2025 & 2033
- Figure 34: North America Glycerin Industry Volume Share (%), by Country 2025 & 2033
- Figure 35: Europe Glycerin Industry Revenue (million), by Grade 2025 & 2033
- Figure 36: Europe Glycerin Industry Volume (K Tons), by Grade 2025 & 2033
- Figure 37: Europe Glycerin Industry Revenue Share (%), by Grade 2025 & 2033
- Figure 38: Europe Glycerin Industry Volume Share (%), by Grade 2025 & 2033
- Figure 39: Europe Glycerin Industry Revenue (million), by Source 2025 & 2033
- Figure 40: Europe Glycerin Industry Volume (K Tons), by Source 2025 & 2033
- Figure 41: Europe Glycerin Industry Revenue Share (%), by Source 2025 & 2033
- Figure 42: Europe Glycerin Industry Volume Share (%), by Source 2025 & 2033
- Figure 43: Europe Glycerin Industry Revenue (million), by Application 2025 & 2033
- Figure 44: Europe Glycerin Industry Volume (K Tons), by Application 2025 & 2033
- Figure 45: Europe Glycerin Industry Revenue Share (%), by Application 2025 & 2033
- Figure 46: Europe Glycerin Industry Volume Share (%), by Application 2025 & 2033
- Figure 47: Europe Glycerin Industry Revenue (million), by Country 2025 & 2033
- Figure 48: Europe Glycerin Industry Volume (K Tons), by Country 2025 & 2033
- Figure 49: Europe Glycerin Industry Revenue Share (%), by Country 2025 & 2033
- Figure 50: Europe Glycerin Industry Volume Share (%), by Country 2025 & 2033
- Figure 51: South America Glycerin Industry Revenue (million), by Grade 2025 & 2033
- Figure 52: South America Glycerin Industry Volume (K Tons), by Grade 2025 & 2033
- Figure 53: South America Glycerin Industry Revenue Share (%), by Grade 2025 & 2033
- Figure 54: South America Glycerin Industry Volume Share (%), by Grade 2025 & 2033
- Figure 55: South America Glycerin Industry Revenue (million), by Source 2025 & 2033
- Figure 56: South America Glycerin Industry Volume (K Tons), by Source 2025 & 2033
- Figure 57: South America Glycerin Industry Revenue Share (%), by Source 2025 & 2033
- Figure 58: South America Glycerin Industry Volume Share (%), by Source 2025 & 2033
- Figure 59: South America Glycerin Industry Revenue (million), by Application 2025 & 2033
- Figure 60: South America Glycerin Industry Volume (K Tons), by Application 2025 & 2033
- Figure 61: South America Glycerin Industry Revenue Share (%), by Application 2025 & 2033
- Figure 62: South America Glycerin Industry Volume Share (%), by Application 2025 & 2033
- Figure 63: South America Glycerin Industry Revenue (million), by Country 2025 & 2033
- Figure 64: South America Glycerin Industry Volume (K Tons), by Country 2025 & 2033
- Figure 65: South America Glycerin Industry Revenue Share (%), by Country 2025 & 2033
- Figure 66: South America Glycerin Industry Volume Share (%), by Country 2025 & 2033
- Figure 67: Middle East and Africa Glycerin Industry Revenue (million), by Grade 2025 & 2033
- Figure 68: Middle East and Africa Glycerin Industry Volume (K Tons), by Grade 2025 & 2033
- Figure 69: Middle East and Africa Glycerin Industry Revenue Share (%), by Grade 2025 & 2033
- Figure 70: Middle East and Africa Glycerin Industry Volume Share (%), by Grade 2025 & 2033
- Figure 71: Middle East and Africa Glycerin Industry Revenue (million), by Source 2025 & 2033
- Figure 72: Middle East and Africa Glycerin Industry Volume (K Tons), by Source 2025 & 2033
- Figure 73: Middle East and Africa Glycerin Industry Revenue Share (%), by Source 2025 & 2033
- Figure 74: Middle East and Africa Glycerin Industry Volume Share (%), by Source 2025 & 2033
- Figure 75: Middle East and Africa Glycerin Industry Revenue (million), by Application 2025 & 2033
- Figure 76: Middle East and Africa Glycerin Industry Volume (K Tons), by Application 2025 & 2033
- Figure 77: Middle East and Africa Glycerin Industry Revenue Share (%), by Application 2025 & 2033
- Figure 78: Middle East and Africa Glycerin Industry Volume Share (%), by Application 2025 & 2033
- Figure 79: Middle East and Africa Glycerin Industry Revenue (million), by Country 2025 & 2033
- Figure 80: Middle East and Africa Glycerin Industry Volume (K Tons), by Country 2025 & 2033
- Figure 81: Middle East and Africa Glycerin Industry Revenue Share (%), by Country 2025 & 2033
- Figure 82: Middle East and Africa Glycerin Industry Volume Share (%), by Country 2025 & 2033
List of Tables
- Table 1: Global Glycerin Industry Revenue million Forecast, by Grade 2020 & 2033
- Table 2: Global Glycerin Industry Volume K Tons Forecast, by Grade 2020 & 2033
- Table 3: Global Glycerin Industry Revenue million Forecast, by Source 2020 & 2033
- Table 4: Global Glycerin Industry Volume K Tons Forecast, by Source 2020 & 2033
- Table 5: Global Glycerin Industry Revenue million Forecast, by Application 2020 & 2033
- Table 6: Global Glycerin Industry Volume K Tons Forecast, by Application 2020 & 2033
- Table 7: Global Glycerin Industry Revenue million Forecast, by Region 2020 & 2033
- Table 8: Global Glycerin Industry Volume K Tons Forecast, by Region 2020 & 2033
- Table 9: Global Glycerin Industry Revenue million Forecast, by Grade 2020 & 2033
- Table 10: Global Glycerin Industry Volume K Tons Forecast, by Grade 2020 & 2033
- Table 11: Global Glycerin Industry Revenue million Forecast, by Source 2020 & 2033
- Table 12: Global Glycerin Industry Volume K Tons Forecast, by Source 2020 & 2033
- Table 13: Global Glycerin Industry Revenue million Forecast, by Application 2020 & 2033
- Table 14: Global Glycerin Industry Volume K Tons Forecast, by Application 2020 & 2033
- Table 15: Global Glycerin Industry Revenue million Forecast, by Country 2020 & 2033
- Table 16: Global Glycerin Industry Volume K Tons Forecast, by Country 2020 & 2033
- Table 17: China Glycerin Industry Revenue (million) Forecast, by Application 2020 & 2033
- Table 18: China Glycerin Industry Volume (K Tons) Forecast, by Application 2020 & 2033
- Table 19: India Glycerin Industry Revenue (million) Forecast, by Application 2020 & 2033
- Table 20: India Glycerin Industry Volume (K Tons) Forecast, by Application 2020 & 2033
- Table 21: Japan Glycerin Industry Revenue (million) Forecast, by Application 2020 & 2033
- Table 22: Japan Glycerin Industry Volume (K Tons) Forecast, by Application 2020 & 2033
- Table 23: South Korea Glycerin Industry Revenue (million) Forecast, by Application 2020 & 2033
- Table 24: South Korea Glycerin Industry Volume (K Tons) Forecast, by Application 2020 & 2033
- Table 25: Rest of Asia Pacific Glycerin Industry Revenue (million) Forecast, by Application 2020 & 2033
- Table 26: Rest of Asia Pacific Glycerin Industry Volume (K Tons) Forecast, by Application 2020 & 2033
- Table 27: Global Glycerin Industry Revenue million Forecast, by Grade 2020 & 2033
- Table 28: Global Glycerin Industry Volume K Tons Forecast, by Grade 2020 & 2033
- Table 29: Global Glycerin Industry Revenue million Forecast, by Source 2020 & 2033
- Table 30: Global Glycerin Industry Volume K Tons Forecast, by Source 2020 & 2033
- Table 31: Global Glycerin Industry Revenue million Forecast, by Application 2020 & 2033
- Table 32: Global Glycerin Industry Volume K Tons Forecast, by Application 2020 & 2033
- Table 33: Global Glycerin Industry Revenue million Forecast, by Country 2020 & 2033
- Table 34: Global Glycerin Industry Volume K Tons Forecast, by Country 2020 & 2033
- Table 35: United States Glycerin Industry Revenue (million) Forecast, by Application 2020 & 2033
- Table 36: United States Glycerin Industry Volume (K Tons) Forecast, by Application 2020 & 2033
- Table 37: Canada Glycerin Industry Revenue (million) Forecast, by Application 2020 & 2033
- Table 38: Canada Glycerin Industry Volume (K Tons) Forecast, by Application 2020 & 2033
- Table 39: Mexico Glycerin Industry Revenue (million) Forecast, by Application 2020 & 2033
- Table 40: Mexico Glycerin Industry Volume (K Tons) Forecast, by Application 2020 & 2033
- Table 41: Rest of North America Glycerin Industry Revenue (million) Forecast, by Application 2020 & 2033
- Table 42: Rest of North America Glycerin Industry Volume (K Tons) Forecast, by Application 2020 & 2033
- Table 43: Global Glycerin Industry Revenue million Forecast, by Grade 2020 & 2033
- Table 44: Global Glycerin Industry Volume K Tons Forecast, by Grade 2020 & 2033
- Table 45: Global Glycerin Industry Revenue million Forecast, by Source 2020 & 2033
- Table 46: Global Glycerin Industry Volume K Tons Forecast, by Source 2020 & 2033
- Table 47: Global Glycerin Industry Revenue million Forecast, by Application 2020 & 2033
- Table 48: Global Glycerin Industry Volume K Tons Forecast, by Application 2020 & 2033
- Table 49: Global Glycerin Industry Revenue million Forecast, by Country 2020 & 2033
- Table 50: Global Glycerin Industry Volume K Tons Forecast, by Country 2020 & 2033
- Table 51: Germany Glycerin Industry Revenue (million) Forecast, by Application 2020 & 2033
- Table 52: Germany Glycerin Industry Volume (K Tons) Forecast, by Application 2020 & 2033
- Table 53: United Kingdom Glycerin Industry Revenue (million) Forecast, by Application 2020 & 2033
- Table 54: United Kingdom Glycerin Industry Volume (K Tons) Forecast, by Application 2020 & 2033
- Table 55: Italy Glycerin Industry Revenue (million) Forecast, by Application 2020 & 2033
- Table 56: Italy Glycerin Industry Volume (K Tons) Forecast, by Application 2020 & 2033
- Table 57: France Glycerin Industry Revenue (million) Forecast, by Application 2020 & 2033
- Table 58: France Glycerin Industry Volume (K Tons) Forecast, by Application 2020 & 2033
- Table 59: Rest of Europe Glycerin Industry Revenue (million) Forecast, by Application 2020 & 2033
- Table 60: Rest of Europe Glycerin Industry Volume (K Tons) Forecast, by Application 2020 & 2033
- Table 61: Global Glycerin Industry Revenue million Forecast, by Grade 2020 & 2033
- Table 62: Global Glycerin Industry Volume K Tons Forecast, by Grade 2020 & 2033
- Table 63: Global Glycerin Industry Revenue million Forecast, by Source 2020 & 2033
- Table 64: Global Glycerin Industry Volume K Tons Forecast, by Source 2020 & 2033
- Table 65: Global Glycerin Industry Revenue million Forecast, by Application 2020 & 2033
- Table 66: Global Glycerin Industry Volume K Tons Forecast, by Application 2020 & 2033
- Table 67: Global Glycerin Industry Revenue million Forecast, by Country 2020 & 2033
- Table 68: Global Glycerin Industry Volume K Tons Forecast, by Country 2020 & 2033
- Table 69: Brazil Glycerin Industry Revenue (million) Forecast, by Application 2020 & 2033
- Table 70: Brazil Glycerin Industry Volume (K Tons) Forecast, by Application 2020 & 2033
- Table 71: Argentina Glycerin Industry Revenue (million) Forecast, by Application 2020 & 2033
- Table 72: Argentina Glycerin Industry Volume (K Tons) Forecast, by Application 2020 & 2033
- Table 73: Rest of South America Glycerin Industry Revenue (million) Forecast, by Application 2020 & 2033
- Table 74: Rest of South America Glycerin Industry Volume (K Tons) Forecast, by Application 2020 & 2033
- Table 75: Global Glycerin Industry Revenue million Forecast, by Grade 2020 & 2033
- Table 76: Global Glycerin Industry Volume K Tons Forecast, by Grade 2020 & 2033
- Table 77: Global Glycerin Industry Revenue million Forecast, by Source 2020 & 2033
- Table 78: Global Glycerin Industry Volume K Tons Forecast, by Source 2020 & 2033
- Table 79: Global Glycerin Industry Revenue million Forecast, by Application 2020 & 2033
- Table 80: Global Glycerin Industry Volume K Tons Forecast, by Application 2020 & 2033
- Table 81: Global Glycerin Industry Revenue million Forecast, by Country 2020 & 2033
- Table 82: Global Glycerin Industry Volume K Tons Forecast, by Country 2020 & 2033
- Table 83: Saudi Arabia Glycerin Industry Revenue (million) Forecast, by Application 2020 & 2033
- Table 84: Saudi Arabia Glycerin Industry Volume (K Tons) Forecast, by Application 2020 & 2033
- Table 85: South Africa Glycerin Industry Revenue (million) Forecast, by Application 2020 & 2033
- Table 86: South Africa Glycerin Industry Volume (K Tons) Forecast, by Application 2020 & 2033
- Table 87: United Arab Emirates Glycerin Industry Revenue (million) Forecast, by Application 2020 & 2033
- Table 88: United Arab Emirates Glycerin Industry Volume (K Tons) Forecast, by Application 2020 & 2033
- Table 89: Rest of Middle East and Africa Glycerin Industry Revenue (million) Forecast, by Application 2020 & 2033
- Table 90: Rest of Middle East and Africa Glycerin Industry Volume (K Tons) Forecast, by Application 2020 & 2033
Frequently Asked Questions
1. What is the projected Compound Annual Growth Rate (CAGR) of the Glycerin Industry?
The projected CAGR is approximately 4.5%.
2. Which companies are prominent players in the Glycerin Industry?
Key companies in the market include Louis Dreyfus Company, Biodex-SA, Musim Mas, Cargill Incorporated, Thai Glycerine Co Ltd, RB FUELS, Vantage Specialty Chemicals, KLK OLEO, Sebacic India Limited, IOI Corporation Berhad, Wilmar International Ltd, P&G Chemicals, Archer Daniels Midland Company, Emery Oleochemicals, BASF SE, Dow, Munzer Bioindustrie GmbH, Godrej Industries Limited, Oleon NV, Vance Group Ltd, Kao Corporation, Aemetis.
3. What are the main segments of the Glycerin Industry?
The market segments include Grade, Source, Application.
4. Can you provide details about the market size?
The market size is estimated to be USD 4.78 million as of 2022.
5. What are some drivers contributing to market growth?
Strong Demand from the Pharmaceutical Industry; Increasing Use in the Personal Care and Cosmetics Industries.
6. What are the notable trends driving market growth?
Personal Care and Cosmetics Application to Dominate the Market Growth.
7. Are there any restraints impacting market growth?
Availability of Substitutes; Other Restraints.
8. Can you provide examples of recent developments in the market?
In December 2022, Oleochemical producer Oleon announced the acquisition of a blending plant in Conroe, Texas, by investing USD 50 million. The company strengthened its oleochemicals division which includes the production of glycerin.
9. What pricing options are available for accessing the report?
Pricing options include single-user, multi-user, and enterprise licenses priced at USD 4750, USD 5250, and USD 8750 respectively.
10. Is the market size provided in terms of value or volume?
The market size is provided in terms of value, measured in million and volume, measured in K Tons.
11. Are there any specific market keywords associated with the report?
Yes, the market keyword associated with the report is "Glycerin Industry," which aids in identifying and referencing the specific market segment covered.
12. How do I determine which pricing option suits my needs best?
The pricing options vary based on user requirements and access needs. Individual users may opt for single-user licenses, while businesses requiring broader access may choose multi-user or enterprise licenses for cost-effective access to the report.
13. Are there any additional resources or data provided in the Glycerin Industry report?
While the report offers comprehensive insights, it's advisable to review the specific contents or supplementary materials provided to ascertain if additional resources or data are available.
14. How can I stay updated on further developments or reports in the Glycerin Industry?
To stay informed about further developments, trends, and reports in the Glycerin Industry, consider subscribing to industry newsletters, following relevant companies and organizations, or regularly checking reputable industry news sources and publications.
Methodology
Step 1 - Identification of Relevant Samples Size from Population Database


Step 2 - Approaches for Defining Global Market Size (Value, Volume* & Price*)

Note*: In applicable scenarios
Step 3 - Data Sources
Primary Research
- Web Analytics
- Survey Reports
- Research Institute
- Latest Research Reports
- Opinion Leaders
Secondary Research
- Annual Reports
- White Paper
- Latest Press Release
- Industry Association
- Paid Database
- Investor Presentations

Step 4 - Data Triangulation
Involves using different sources of information in order to increase the validity of a study
These sources are likely to be stakeholders in a program - participants, other researchers, program staff, other community members, and so on.
Then we put all data in single framework & apply various statistical tools to find out the dynamic on the market.
During the analysis stage, feedback from the stakeholder groups would be compared to determine areas of agreement as well as areas of divergence