Key Insights
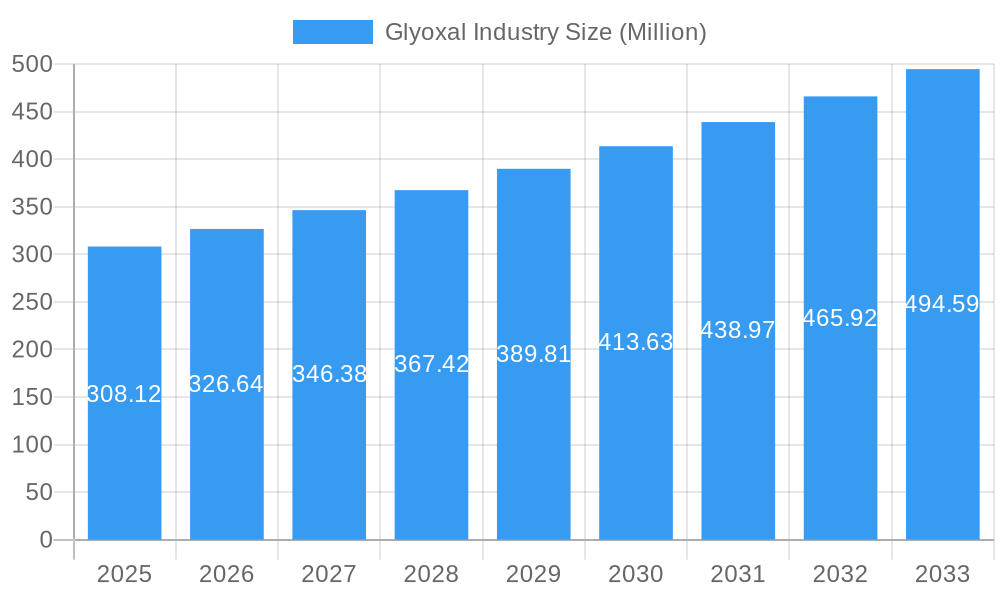
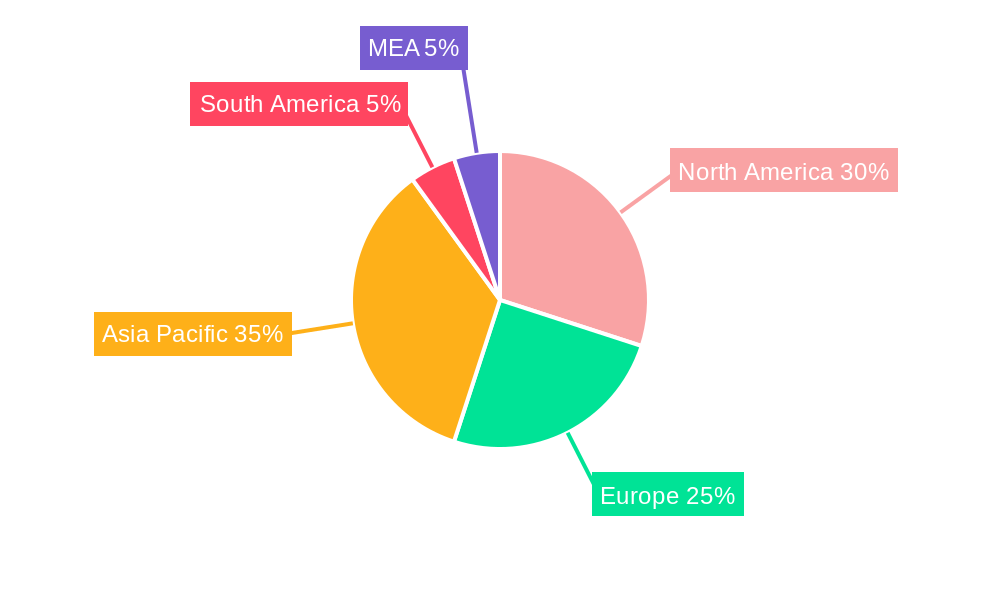
The global glyoxal market, projected to reach $368.1 million by 2025, is poised for substantial growth. Driven by increasing demand across key sectors including adhesives and sealants, textiles, and resins & polymers, the market is expected to grow at a Compound Annual Growth Rate (CAGR) of 5.9%. Glyoxal's application as a cross-linking agent in textiles enhances fabric durability and wrinkle resistance, significantly contributing to market expansion. Its role as an intermediate in chemical synthesis further bolsters demand. The growing preference for sustainable and eco-friendly solutions in industries like paper packaging also presents a positive growth driver. While regulatory constraints and substitute materials pose challenges, glyoxal's versatility and performance advantages ensure a positive market outlook. North America and Asia Pacific are anticipated to lead market share due to robust industrial activity and manufacturing capabilities. Key players such as BASF SE and INEOS are investing in R&D to meet evolving market needs. Direct sales currently dominate, with indirect sales expected to grow as distribution networks expand.
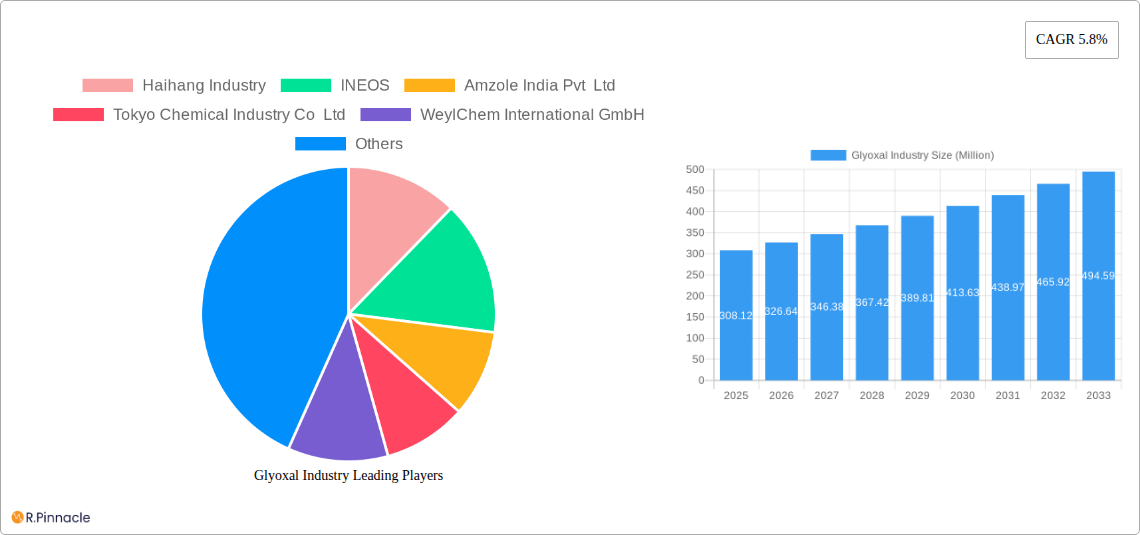
Glyoxal Industry Market Size (In Million)
The competitive landscape is characterized by multinational corporations and regional entities. Future market expansion will be influenced by technological advancements in production efficiency and cost-effectiveness, alongside stringent environmental regulations and consumer demand for sustainable products. Growth in end-use industries and increased R&D investments will fuel continued market expansion throughout the forecast period. Strategic partnerships and product diversification will be critical competitive factors.
Glyoxal Industry Company Market Share
This report delivers an in-depth analysis of the global glyoxal industry, providing actionable insights for professionals, investors, and decision-makers. Covering the period from 2019 to 2033, with a base year of 2025 and a forecast period of 2025-2033, the report offers comprehensive market sizing, segmentation, and competitive analysis to navigate this dynamic market effectively.
Glyoxal Industry Market Structure & Innovation Trends
The global glyoxal market exhibits a moderately consolidated structure, with key players such as BASF SE, INEOS, and Haihang Industry holding significant market share. The exact market share distribution in 2025 is estimated at: BASF SE (20%), INEOS (18%), Haihang Industry (15%), with the remaining 47% distributed across other players. Innovation is driven by the increasing demand for high-performance adhesives and sealants, necessitating the development of more efficient and sustainable glyoxal production methods. Regulatory frameworks, particularly concerning environmental regulations and safety standards, significantly influence market dynamics. Product substitutes, while limited, include other cross-linking agents, posing a competitive challenge. End-user demographics are evolving, with a rising demand from emerging economies. M&A activity has been moderate in recent years, with a total estimated value of xx Million in deals over the past five years. For instance, a notable acquisition was reported to be valued at xx Million in 2022.
Glyoxal Industry Market Dynamics & Trends
The glyoxal market is projected to witness a CAGR of xx% during the forecast period (2025-2033). Key growth drivers include increasing demand from the textile, paper packaging, and resin & polymers industries. Technological disruptions, particularly in production processes, are enhancing efficiency and reducing costs. Consumer preferences are shifting towards eco-friendly and sustainable products, prompting manufacturers to adopt more environmentally conscious practices. Competitive dynamics are shaped by pricing strategies, product differentiation, and geographical expansion. Market penetration in developing economies is anticipated to increase significantly driven by rapid industrialization. Specific metrics around market penetration will be detailed within the full report.
Dominant Regions & Segments in Glyoxal Industry
- Leading Region: Asia-Pacific is projected to dominate the glyoxal market throughout the forecast period, driven by robust economic growth and expanding industrial sectors. China, in particular, is expected to maintain its leading position.
- Leading Application Segment: The adhesives and sealants segment is expected to hold the largest market share in 2025, driven by the booming construction and automotive industries. The growth of the segment is fuelled by demand for stronger and more durable adhesives.
- Leading End-Use Industry: The Resin & Polymers industry will be the dominant end-use segment, with its high demand for cross-linking agents within the plastics and composites sector.
- Leading Sales Channel: Indirect sales channels are currently prominent, utilizing a network of distributors and wholesalers to reach diverse customer segments. The direct sales model is expected to gain traction as companies invest in customer relationship management (CRM).
Key drivers in the Asia-Pacific region include favorable government policies promoting industrial growth, improving infrastructure, and a strong manufacturing base. The dominance of specific segments is further analyzed within the comprehensive report.
Glyoxal Industry Product Innovations
Recent innovations in glyoxal production focus on improving efficiency, reducing environmental impact, and enhancing product performance. New formulations are tailored to specific applications, addressing the need for higher purity and improved stability. Technological advancements, including the adoption of advanced catalysts and process optimization, are crucial in driving innovation. The market is seeing the development of glyoxal derivatives with enhanced properties, expanding applications into niche sectors.
Report Scope & Segmentation Analysis
This report segments the glyoxal market by application (adhesives and sealants, cross-linking, intermediate, others), end-use industry (textile, leather, resin & polymers, cosmetics & personal care, paper packaging, oil & gas, others), and sales channel (direct sales, indirect sales). Each segment is analyzed in detail, providing market size, growth projections, and competitive dynamics. Growth projections vary across segments, with adhesives and sealants anticipated to exhibit strong growth throughout the forecast period.
Key Drivers of Glyoxal Industry Growth
The glyoxal industry's growth is propelled by several factors, including:
- Rising demand from various end-use sectors: The construction, textile, and paper industries are major consumers of glyoxal.
- Technological advancements: Innovations in production processes enhance efficiency and reduce costs.
- Favorable government regulations: Policies supporting industrial growth in certain regions drive demand.
Challenges in the Glyoxal Industry Sector
The glyoxal industry faces challenges including:
- Fluctuations in raw material prices: Glyoxal production depends on readily available and affordable raw materials.
- Stringent environmental regulations: Compliance requirements can impact profitability.
- Intense competition: The market is competitive, necessitating strategic pricing and differentiation.
Emerging Opportunities in Glyoxal Industry
Emerging opportunities include:
- Expansion into new markets: Untapped potential exists in developing economies.
- Development of novel applications: Research and development efforts can unlock new market segments.
- Focus on sustainability: Demand for eco-friendly glyoxal is growing.
Leading Players in the Glyoxal Industry Market
- Haihang Industry
- INEOS
- Amzole India Pvt Ltd
- Tokyo Chemical Industry Co Ltd
- WeylChem International GmbH
- BASF SE
- Hubei Hongyuan Pharmaceutical Technology Co Ltd
- Toronto Research Chemicals
- Zhonglan Industry Co Ltd
- Thermo Fisher Scientific
Key Developments in Glyoxal Industry
- 2022 Q3: BASF SE announced a new production facility expansion in China.
- 2021 Q4: INEOS acquired a smaller glyoxal producer, strengthening its market position.
- 2020 Q1: New environmental regulations in Europe impacted production costs for several companies. (Further details will be provided in the full report.)
Future Outlook for Glyoxal Industry Market
The glyoxal market is poised for continued growth, driven by increasing demand, technological advancements, and expansion into new applications. Strategic opportunities lie in product diversification, sustainable production methods, and market penetration in high-growth regions. The industry's future is bright, with significant potential for expansion and innovation.
Glyoxal Industry Segmentation
-
1. Application
- 1.1. Adhesives and Sealants
- 1.2. Intermediates
- 1.3. Oil and Gas Exploration
- 1.4. Paints and Coatings
- 1.5. Textile
- 1.6. Other Applications
Glyoxal Industry Segmentation By Geography
-
1. Asia Pacific
- 1.1. China
- 1.2. India
- 1.3. Japan
- 1.4. South Korea
- 1.5. Rest of Asia Pacific
-
2. North America
- 2.1. United States
- 2.2. Canada
- 2.3. Mexico
-
3. Europe
- 3.1. Germany
- 3.2. United Kingdom
- 3.3. Italy
- 3.4. France
- 3.5. Rest of Europe
-
4. South America
- 4.1. Brazil
- 4.2. Argentina
- 4.3. Rest of South America
- 5. Middle East
-
6. Saudi Arabia
- 6.1. South Africa
- 6.2. Rest of Middle East
Glyoxal Industry Regional Market Share
Geographic Coverage of Glyoxal Industry
Glyoxal Industry REPORT HIGHLIGHTS
| Aspects | Details |
|---|---|
| Study Period | 2020-2034 |
| Base Year | 2025 |
| Estimated Year | 2026 |
| Forecast Period | 2026-2034 |
| Historical Period | 2020-2025 |
| Growth Rate | CAGR of 5.9% from 2020-2034 |
| Segmentation |
|
Table of Contents
- 1. Introduction
- 1.1. Research Scope
- 1.2. Market Segmentation
- 1.3. Research Objective
- 1.4. Definitions and Assumptions
- 2. Executive Summary
- 2.1. Market Snapshot
- 3. Market Dynamics
- 3.1. Market Drivers
- 3.2. Market Restrains
- 3.3. Market Trends
- 3.4. Market Opportunities
- 4. Market Factor Analysis
- 4.1. Porters Five Forces
- 4.1.1. Bargaining Power of Suppliers
- 4.1.2. Bargaining Power of Buyers
- 4.1.3. Threat of New Entrants
- 4.1.4. Threat of Substitutes
- 4.1.5. Competitive Rivalry
- 4.2. PESTEL analysis
- 4.3. BCG Analysis
- 4.3.1. Stars (High Growth, High Market Share)
- 4.3.2. Cash Cows (Low Growth, High Market Share)
- 4.3.3. Question Mark (High Growth, Low Market Share)
- 4.3.4. Dogs (Low Growth, Low Market Share)
- 4.4. Ansoff Matrix Analysis
- 4.5. Supply Chain Analysis
- 4.6. Regulatory Landscape
- 4.7. Current Market Potential and Opportunity Assessment (TAM–SAM–SOM Framework)
- 4.8. PRI Analyst Note
- 4.1. Porters Five Forces
- 5. Market Analysis, Insights and Forecast 2021-2033
- 5.1. Market Analysis, Insights and Forecast - by Application
- 5.1.1. Adhesives and Sealants
- 5.1.2. Intermediates
- 5.1.3. Oil and Gas Exploration
- 5.1.4. Paints and Coatings
- 5.1.5. Textile
- 5.1.6. Other Applications
- 5.2. Market Analysis, Insights and Forecast - by Region
- 5.2.1. Asia Pacific
- 5.2.2. North America
- 5.2.3. Europe
- 5.2.4. South America
- 5.2.5. Middle East
- 5.2.6. Saudi Arabia
- 5.1. Market Analysis, Insights and Forecast - by Application
- 6. Global Glyoxal Industry Analysis, Insights and Forecast, 2021-2033
- 6.1. Market Analysis, Insights and Forecast - by Application
- 6.1.1. Adhesives and Sealants
- 6.1.2. Intermediates
- 6.1.3. Oil and Gas Exploration
- 6.1.4. Paints and Coatings
- 6.1.5. Textile
- 6.1.6. Other Applications
- 6.1. Market Analysis, Insights and Forecast - by Application
- 7. Asia Pacific Glyoxal Industry Analysis, Insights and Forecast, 2020-2032
- 7.1. Market Analysis, Insights and Forecast - by Application
- 7.1.1. Adhesives and Sealants
- 7.1.2. Intermediates
- 7.1.3. Oil and Gas Exploration
- 7.1.4. Paints and Coatings
- 7.1.5. Textile
- 7.1.6. Other Applications
- 7.1. Market Analysis, Insights and Forecast - by Application
- 8. North America Glyoxal Industry Analysis, Insights and Forecast, 2020-2032
- 8.1. Market Analysis, Insights and Forecast - by Application
- 8.1.1. Adhesives and Sealants
- 8.1.2. Intermediates
- 8.1.3. Oil and Gas Exploration
- 8.1.4. Paints and Coatings
- 8.1.5. Textile
- 8.1.6. Other Applications
- 8.1. Market Analysis, Insights and Forecast - by Application
- 9. Europe Glyoxal Industry Analysis, Insights and Forecast, 2020-2032
- 9.1. Market Analysis, Insights and Forecast - by Application
- 9.1.1. Adhesives and Sealants
- 9.1.2. Intermediates
- 9.1.3. Oil and Gas Exploration
- 9.1.4. Paints and Coatings
- 9.1.5. Textile
- 9.1.6. Other Applications
- 9.1. Market Analysis, Insights and Forecast - by Application
- 10. South America Glyoxal Industry Analysis, Insights and Forecast, 2020-2032
- 10.1. Market Analysis, Insights and Forecast - by Application
- 10.1.1. Adhesives and Sealants
- 10.1.2. Intermediates
- 10.1.3. Oil and Gas Exploration
- 10.1.4. Paints and Coatings
- 10.1.5. Textile
- 10.1.6. Other Applications
- 10.1. Market Analysis, Insights and Forecast - by Application
- 11. Middle East Glyoxal Industry Analysis, Insights and Forecast, 2020-2032
- 11.1. Market Analysis, Insights and Forecast - by Application
- 11.1.1. Adhesives and Sealants
- 11.1.2. Intermediates
- 11.1.3. Oil and Gas Exploration
- 11.1.4. Paints and Coatings
- 11.1.5. Textile
- 11.1.6. Other Applications
- 11.1. Market Analysis, Insights and Forecast - by Application
- 12. Saudi Arabia Glyoxal Industry Analysis, Insights and Forecast, 2020-2032
- 12.1. Market Analysis, Insights and Forecast - by Application
- 12.1.1. Adhesives and Sealants
- 12.1.2. Intermediates
- 12.1.3. Oil and Gas Exploration
- 12.1.4. Paints and Coatings
- 12.1.5. Textile
- 12.1.6. Other Applications
- 12.1. Market Analysis, Insights and Forecast - by Application
- 13. Competitive Analysis
- 13.1. Company Profiles
- 13.1.1 Haihang Industry
- 13.1.1.1. Company Overview
- 13.1.1.2. Products
- 13.1.1.3. Company Financials
- 13.1.1.4. SWOT Analysis
- 13.1.2 INEOS
- 13.1.2.1. Company Overview
- 13.1.2.2. Products
- 13.1.2.3. Company Financials
- 13.1.2.4. SWOT Analysis
- 13.1.3 Amzole India Pvt Ltd
- 13.1.3.1. Company Overview
- 13.1.3.2. Products
- 13.1.3.3. Company Financials
- 13.1.3.4. SWOT Analysis
- 13.1.4 Tokyo Chemical Industry Co Ltd
- 13.1.4.1. Company Overview
- 13.1.4.2. Products
- 13.1.4.3. Company Financials
- 13.1.4.4. SWOT Analysis
- 13.1.5 WeylChem International GmbH
- 13.1.5.1. Company Overview
- 13.1.5.2. Products
- 13.1.5.3. Company Financials
- 13.1.5.4. SWOT Analysis
- 13.1.6 BASF SE
- 13.1.6.1. Company Overview
- 13.1.6.2. Products
- 13.1.6.3. Company Financials
- 13.1.6.4. SWOT Analysis
- 13.1.7 Hubei Hongyuan Pharmaceutical Technology Co Ltd
- 13.1.7.1. Company Overview
- 13.1.7.2. Products
- 13.1.7.3. Company Financials
- 13.1.7.4. SWOT Analysis
- 13.1.8 Toronto Research Chemicals
- 13.1.8.1. Company Overview
- 13.1.8.2. Products
- 13.1.8.3. Company Financials
- 13.1.8.4. SWOT Analysis
- 13.1.9 Zhonglan Industry Co Ltd
- 13.1.9.1. Company Overview
- 13.1.9.2. Products
- 13.1.9.3. Company Financials
- 13.1.9.4. SWOT Analysis
- 13.1.10 Thermo Fisher Scientific
- 13.1.10.1. Company Overview
- 13.1.10.2. Products
- 13.1.10.3. Company Financials
- 13.1.10.4. SWOT Analysis
- 13.1.1 Haihang Industry
- 13.2. Market Entropy
- 13.2.1 Company's Key Areas Served
- 13.2.2 Recent Developments
- 13.3. Company Market Share Analysis 2025
- 13.3.1 Top 5 Companies Market Share Analysis
- 13.3.2 Top 3 Companies Market Share Analysis
- 13.4. List of Potential Customers
- 14. Research Methodology
List of Figures
- Figure 1: Global Glyoxal Industry Revenue Breakdown (million, %) by Region 2025 & 2033
- Figure 2: Global Glyoxal Industry Volume Breakdown (K Tons, %) by Region 2025 & 2033
- Figure 3: Asia Pacific Glyoxal Industry Revenue (million), by Application 2025 & 2033
- Figure 4: Asia Pacific Glyoxal Industry Volume (K Tons), by Application 2025 & 2033
- Figure 5: Asia Pacific Glyoxal Industry Revenue Share (%), by Application 2025 & 2033
- Figure 6: Asia Pacific Glyoxal Industry Volume Share (%), by Application 2025 & 2033
- Figure 7: Asia Pacific Glyoxal Industry Revenue (million), by Country 2025 & 2033
- Figure 8: Asia Pacific Glyoxal Industry Volume (K Tons), by Country 2025 & 2033
- Figure 9: Asia Pacific Glyoxal Industry Revenue Share (%), by Country 2025 & 2033
- Figure 10: Asia Pacific Glyoxal Industry Volume Share (%), by Country 2025 & 2033
- Figure 11: North America Glyoxal Industry Revenue (million), by Application 2025 & 2033
- Figure 12: North America Glyoxal Industry Volume (K Tons), by Application 2025 & 2033
- Figure 13: North America Glyoxal Industry Revenue Share (%), by Application 2025 & 2033
- Figure 14: North America Glyoxal Industry Volume Share (%), by Application 2025 & 2033
- Figure 15: North America Glyoxal Industry Revenue (million), by Country 2025 & 2033
- Figure 16: North America Glyoxal Industry Volume (K Tons), by Country 2025 & 2033
- Figure 17: North America Glyoxal Industry Revenue Share (%), by Country 2025 & 2033
- Figure 18: North America Glyoxal Industry Volume Share (%), by Country 2025 & 2033
- Figure 19: Europe Glyoxal Industry Revenue (million), by Application 2025 & 2033
- Figure 20: Europe Glyoxal Industry Volume (K Tons), by Application 2025 & 2033
- Figure 21: Europe Glyoxal Industry Revenue Share (%), by Application 2025 & 2033
- Figure 22: Europe Glyoxal Industry Volume Share (%), by Application 2025 & 2033
- Figure 23: Europe Glyoxal Industry Revenue (million), by Country 2025 & 2033
- Figure 24: Europe Glyoxal Industry Volume (K Tons), by Country 2025 & 2033
- Figure 25: Europe Glyoxal Industry Revenue Share (%), by Country 2025 & 2033
- Figure 26: Europe Glyoxal Industry Volume Share (%), by Country 2025 & 2033
- Figure 27: South America Glyoxal Industry Revenue (million), by Application 2025 & 2033
- Figure 28: South America Glyoxal Industry Volume (K Tons), by Application 2025 & 2033
- Figure 29: South America Glyoxal Industry Revenue Share (%), by Application 2025 & 2033
- Figure 30: South America Glyoxal Industry Volume Share (%), by Application 2025 & 2033
- Figure 31: South America Glyoxal Industry Revenue (million), by Country 2025 & 2033
- Figure 32: South America Glyoxal Industry Volume (K Tons), by Country 2025 & 2033
- Figure 33: South America Glyoxal Industry Revenue Share (%), by Country 2025 & 2033
- Figure 34: South America Glyoxal Industry Volume Share (%), by Country 2025 & 2033
- Figure 35: Middle East Glyoxal Industry Revenue (million), by Application 2025 & 2033
- Figure 36: Middle East Glyoxal Industry Volume (K Tons), by Application 2025 & 2033
- Figure 37: Middle East Glyoxal Industry Revenue Share (%), by Application 2025 & 2033
- Figure 38: Middle East Glyoxal Industry Volume Share (%), by Application 2025 & 2033
- Figure 39: Middle East Glyoxal Industry Revenue (million), by Country 2025 & 2033
- Figure 40: Middle East Glyoxal Industry Volume (K Tons), by Country 2025 & 2033
- Figure 41: Middle East Glyoxal Industry Revenue Share (%), by Country 2025 & 2033
- Figure 42: Middle East Glyoxal Industry Volume Share (%), by Country 2025 & 2033
- Figure 43: Saudi Arabia Glyoxal Industry Revenue (million), by Application 2025 & 2033
- Figure 44: Saudi Arabia Glyoxal Industry Volume (K Tons), by Application 2025 & 2033
- Figure 45: Saudi Arabia Glyoxal Industry Revenue Share (%), by Application 2025 & 2033
- Figure 46: Saudi Arabia Glyoxal Industry Volume Share (%), by Application 2025 & 2033
- Figure 47: Saudi Arabia Glyoxal Industry Revenue (million), by Country 2025 & 2033
- Figure 48: Saudi Arabia Glyoxal Industry Volume (K Tons), by Country 2025 & 2033
- Figure 49: Saudi Arabia Glyoxal Industry Revenue Share (%), by Country 2025 & 2033
- Figure 50: Saudi Arabia Glyoxal Industry Volume Share (%), by Country 2025 & 2033
List of Tables
- Table 1: Global Glyoxal Industry Revenue million Forecast, by Application 2020 & 2033
- Table 2: Global Glyoxal Industry Volume K Tons Forecast, by Application 2020 & 2033
- Table 3: Global Glyoxal Industry Revenue million Forecast, by Region 2020 & 2033
- Table 4: Global Glyoxal Industry Volume K Tons Forecast, by Region 2020 & 2033
- Table 5: Global Glyoxal Industry Revenue million Forecast, by Application 2020 & 2033
- Table 6: Global Glyoxal Industry Volume K Tons Forecast, by Application 2020 & 2033
- Table 7: Global Glyoxal Industry Revenue million Forecast, by Country 2020 & 2033
- Table 8: Global Glyoxal Industry Volume K Tons Forecast, by Country 2020 & 2033
- Table 9: China Glyoxal Industry Revenue (million) Forecast, by Application 2020 & 2033
- Table 10: China Glyoxal Industry Volume (K Tons) Forecast, by Application 2020 & 2033
- Table 11: India Glyoxal Industry Revenue (million) Forecast, by Application 2020 & 2033
- Table 12: India Glyoxal Industry Volume (K Tons) Forecast, by Application 2020 & 2033
- Table 13: Japan Glyoxal Industry Revenue (million) Forecast, by Application 2020 & 2033
- Table 14: Japan Glyoxal Industry Volume (K Tons) Forecast, by Application 2020 & 2033
- Table 15: South Korea Glyoxal Industry Revenue (million) Forecast, by Application 2020 & 2033
- Table 16: South Korea Glyoxal Industry Volume (K Tons) Forecast, by Application 2020 & 2033
- Table 17: Rest of Asia Pacific Glyoxal Industry Revenue (million) Forecast, by Application 2020 & 2033
- Table 18: Rest of Asia Pacific Glyoxal Industry Volume (K Tons) Forecast, by Application 2020 & 2033
- Table 19: Global Glyoxal Industry Revenue million Forecast, by Application 2020 & 2033
- Table 20: Global Glyoxal Industry Volume K Tons Forecast, by Application 2020 & 2033
- Table 21: Global Glyoxal Industry Revenue million Forecast, by Country 2020 & 2033
- Table 22: Global Glyoxal Industry Volume K Tons Forecast, by Country 2020 & 2033
- Table 23: United States Glyoxal Industry Revenue (million) Forecast, by Application 2020 & 2033
- Table 24: United States Glyoxal Industry Volume (K Tons) Forecast, by Application 2020 & 2033
- Table 25: Canada Glyoxal Industry Revenue (million) Forecast, by Application 2020 & 2033
- Table 26: Canada Glyoxal Industry Volume (K Tons) Forecast, by Application 2020 & 2033
- Table 27: Mexico Glyoxal Industry Revenue (million) Forecast, by Application 2020 & 2033
- Table 28: Mexico Glyoxal Industry Volume (K Tons) Forecast, by Application 2020 & 2033
- Table 29: Global Glyoxal Industry Revenue million Forecast, by Application 2020 & 2033
- Table 30: Global Glyoxal Industry Volume K Tons Forecast, by Application 2020 & 2033
- Table 31: Global Glyoxal Industry Revenue million Forecast, by Country 2020 & 2033
- Table 32: Global Glyoxal Industry Volume K Tons Forecast, by Country 2020 & 2033
- Table 33: Germany Glyoxal Industry Revenue (million) Forecast, by Application 2020 & 2033
- Table 34: Germany Glyoxal Industry Volume (K Tons) Forecast, by Application 2020 & 2033
- Table 35: United Kingdom Glyoxal Industry Revenue (million) Forecast, by Application 2020 & 2033
- Table 36: United Kingdom Glyoxal Industry Volume (K Tons) Forecast, by Application 2020 & 2033
- Table 37: Italy Glyoxal Industry Revenue (million) Forecast, by Application 2020 & 2033
- Table 38: Italy Glyoxal Industry Volume (K Tons) Forecast, by Application 2020 & 2033
- Table 39: France Glyoxal Industry Revenue (million) Forecast, by Application 2020 & 2033
- Table 40: France Glyoxal Industry Volume (K Tons) Forecast, by Application 2020 & 2033
- Table 41: Rest of Europe Glyoxal Industry Revenue (million) Forecast, by Application 2020 & 2033
- Table 42: Rest of Europe Glyoxal Industry Volume (K Tons) Forecast, by Application 2020 & 2033
- Table 43: Global Glyoxal Industry Revenue million Forecast, by Application 2020 & 2033
- Table 44: Global Glyoxal Industry Volume K Tons Forecast, by Application 2020 & 2033
- Table 45: Global Glyoxal Industry Revenue million Forecast, by Country 2020 & 2033
- Table 46: Global Glyoxal Industry Volume K Tons Forecast, by Country 2020 & 2033
- Table 47: Brazil Glyoxal Industry Revenue (million) Forecast, by Application 2020 & 2033
- Table 48: Brazil Glyoxal Industry Volume (K Tons) Forecast, by Application 2020 & 2033
- Table 49: Argentina Glyoxal Industry Revenue (million) Forecast, by Application 2020 & 2033
- Table 50: Argentina Glyoxal Industry Volume (K Tons) Forecast, by Application 2020 & 2033
- Table 51: Rest of South America Glyoxal Industry Revenue (million) Forecast, by Application 2020 & 2033
- Table 52: Rest of South America Glyoxal Industry Volume (K Tons) Forecast, by Application 2020 & 2033
- Table 53: Global Glyoxal Industry Revenue million Forecast, by Application 2020 & 2033
- Table 54: Global Glyoxal Industry Volume K Tons Forecast, by Application 2020 & 2033
- Table 55: Global Glyoxal Industry Revenue million Forecast, by Country 2020 & 2033
- Table 56: Global Glyoxal Industry Volume K Tons Forecast, by Country 2020 & 2033
- Table 57: Global Glyoxal Industry Revenue million Forecast, by Application 2020 & 2033
- Table 58: Global Glyoxal Industry Volume K Tons Forecast, by Application 2020 & 2033
- Table 59: Global Glyoxal Industry Revenue million Forecast, by Country 2020 & 2033
- Table 60: Global Glyoxal Industry Volume K Tons Forecast, by Country 2020 & 2033
- Table 61: South Africa Glyoxal Industry Revenue (million) Forecast, by Application 2020 & 2033
- Table 62: South Africa Glyoxal Industry Volume (K Tons) Forecast, by Application 2020 & 2033
- Table 63: Rest of Middle East Glyoxal Industry Revenue (million) Forecast, by Application 2020 & 2033
- Table 64: Rest of Middle East Glyoxal Industry Volume (K Tons) Forecast, by Application 2020 & 2033
Frequently Asked Questions
1. What is the projected Compound Annual Growth Rate (CAGR) of the Glyoxal Industry?
The projected CAGR is approximately 5.9%.
2. Which companies are prominent players in the Glyoxal Industry?
Key companies in the market include Haihang Industry, INEOS, Amzole India Pvt Ltd, Tokyo Chemical Industry Co Ltd, WeylChem International GmbH, BASF SE, Hubei Hongyuan Pharmaceutical Technology Co Ltd, Toronto Research Chemicals, Zhonglan Industry Co Ltd, Thermo Fisher Scientific.
3. What are the main segments of the Glyoxal Industry?
The market segments include Application.
4. Can you provide details about the market size?
The market size is estimated to be USD 368.1 million as of 2022.
5. What are some drivers contributing to market growth?
; Increasing Applications of Glyoxal in Fabrics; Growing Demand for Glyoxal as an Intermediate.
6. What are the notable trends driving market growth?
Increasing Demand for Glyoxal as an Intermediate and Crosslinkers.
7. Are there any restraints impacting market growth?
; Associated Health Issues; Unfavorable Conditions Arising due to the Impact of COVID-19; Other Restraints.
8. Can you provide examples of recent developments in the market?
N/A
9. What pricing options are available for accessing the report?
Pricing options include single-user, multi-user, and enterprise licenses priced at USD 4750, USD 5250, and USD 8750 respectively.
10. Is the market size provided in terms of value or volume?
The market size is provided in terms of value, measured in million and volume, measured in K Tons.
11. Are there any specific market keywords associated with the report?
Yes, the market keyword associated with the report is "Glyoxal Industry," which aids in identifying and referencing the specific market segment covered.
12. How do I determine which pricing option suits my needs best?
The pricing options vary based on user requirements and access needs. Individual users may opt for single-user licenses, while businesses requiring broader access may choose multi-user or enterprise licenses for cost-effective access to the report.
13. Are there any additional resources or data provided in the Glyoxal Industry report?
While the report offers comprehensive insights, it's advisable to review the specific contents or supplementary materials provided to ascertain if additional resources or data are available.
14. How can I stay updated on further developments or reports in the Glyoxal Industry?
To stay informed about further developments, trends, and reports in the Glyoxal Industry, consider subscribing to industry newsletters, following relevant companies and organizations, or regularly checking reputable industry news sources and publications.
Methodology
Step 1 - Identification of Relevant Samples Size from Population Database


Step 2 - Approaches for Defining Global Market Size (Value, Volume* & Price*)

Note*: In applicable scenarios
Step 3 - Data Sources
Primary Research
- Web Analytics
- Survey Reports
- Research Institute
- Latest Research Reports
- Opinion Leaders
Secondary Research
- Annual Reports
- White Paper
- Latest Press Release
- Industry Association
- Paid Database
- Investor Presentations

Step 4 - Data Triangulation
Involves using different sources of information in order to increase the validity of a study
These sources are likely to be stakeholders in a program - participants, other researchers, program staff, other community members, and so on.
Then we put all data in single framework & apply various statistical tools to find out the dynamic on the market.
During the analysis stage, feedback from the stakeholder groups would be compared to determine areas of agreement as well as areas of divergence

