

Key Insights
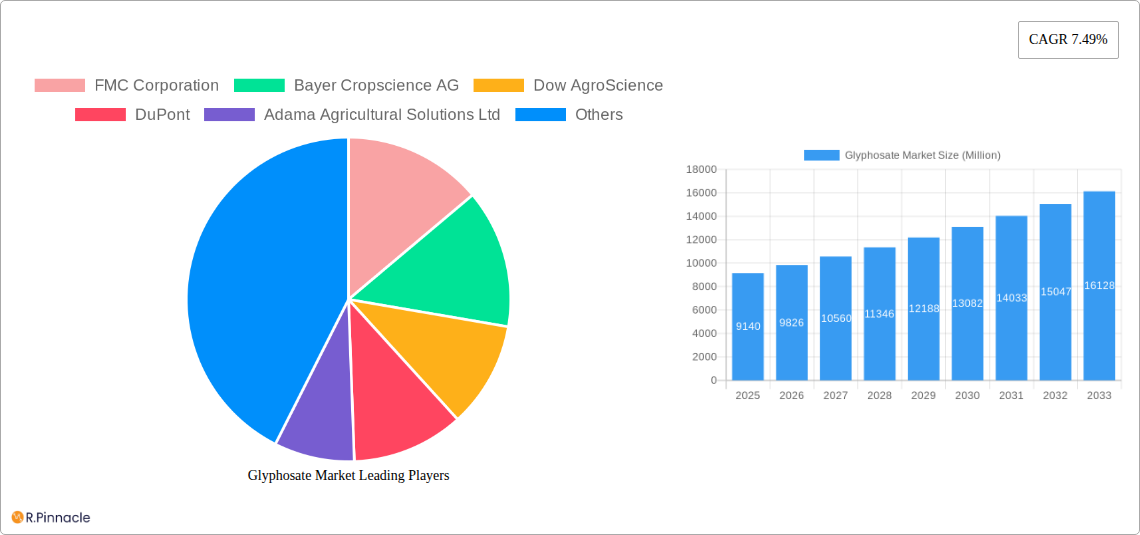
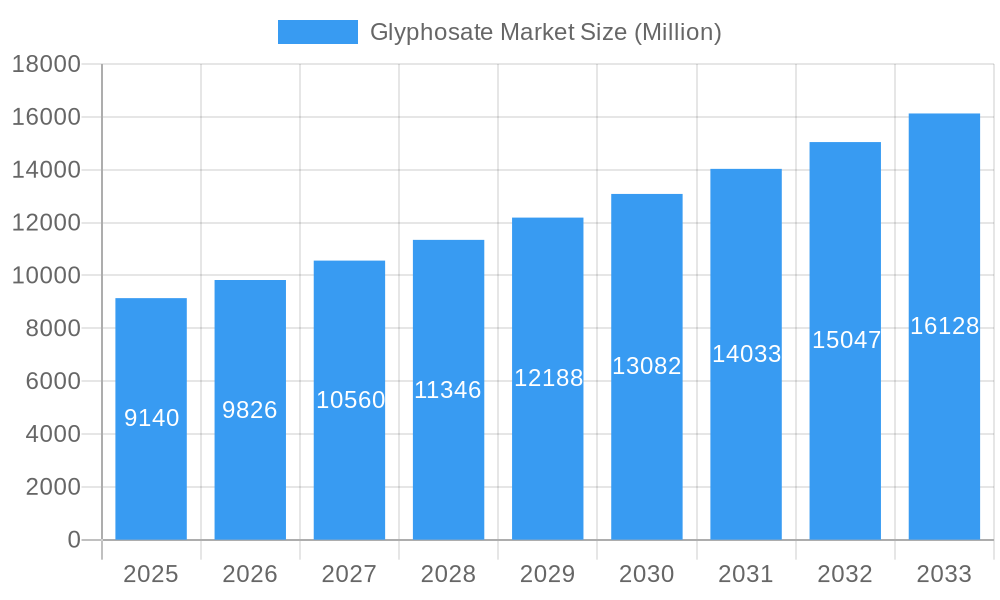
The glyphosate market, valued at $9.14 billion in 2025, is projected to experience robust growth, driven by the increasing demand for high-yield crops and the continued prevalence of herbicide-resistant weeds. The market's Compound Annual Growth Rate (CAGR) of 7.49% from 2025 to 2033 indicates a significant expansion over the forecast period. Key drivers include the rising global population requiring enhanced agricultural productivity, the expanding acreage under cultivation of genetically modified (GM) crops tolerant to glyphosate, and the persistent need for effective weed control in various cropping systems. Market segmentation reveals a substantial demand across diverse applications including grains and cereals, pulses and oilseeds, fruits and vegetables, and commercial crops. While the prevalence of GM crops significantly contributes to glyphosate demand, the non-GM segment remains substantial, reflecting the broad utility of glyphosate in conventional agriculture. Regional variations in market share are expected, with North America and Asia-Pacific likely maintaining leading positions due to significant agricultural activities and adoption rates of glyphosate-based herbicides. However, regulatory scrutiny and concerns regarding environmental impact pose potential restraints on market growth, necessitating sustainable application practices and the development of more environmentally friendly alternatives. Leading companies such as FMC Corporation, Bayer, and Syngenta will continue to play a crucial role in shaping the market through innovation, product development, and market penetration.
Glyphosate Market Market Size (In Billion)
The future of the glyphosate market is intertwined with global food security and sustainable agricultural practices. The market's sustained growth is anticipated, albeit potentially tempered by evolving regulatory landscapes and growing consumer awareness of environmental and health concerns. The industry's response to these challenges will be key to ensuring the long-term viability and responsible use of glyphosate, focusing on innovation within the realm of sustainable weed management strategies. This will involve promoting precise application techniques, integrated pest management strategies, and the development of less environmentally impactful alternatives. Investing in research and development of novel herbicides and exploring integrated weed management approaches will be critical for the responsible management of glyphosate's impact on the environment.
Glyphosate Market Company Market Share
Glyphosate Market Report: A Comprehensive Analysis (2019-2033)
This comprehensive report provides an in-depth analysis of the global glyphosate market, offering invaluable insights for industry professionals, investors, and stakeholders. Covering the period from 2019 to 2033, with a focus on 2025, this report dissects market dynamics, competitive landscapes, and future growth potential. The study period spans 2019-2024 (Historical Period), with 2025 as the base and estimated year, and a forecast period extending to 2033. Expect detailed segmentation analysis, key player profiles, and crucial market trend identification to aid strategic decision-making.
Glyphosate Market Structure & Innovation Trends
This section analyzes the glyphosate market's competitive landscape, encompassing market concentration, innovation drivers, regulatory frameworks, and M&A activities. The report will detail market share held by key players like FMC Corporation, Bayer Cropscience AG, Dow AgroScience, DuPont, Adama Agricultural Solutions Ltd, Nufarm Limited, Zhejiang Xinan Chemical Industrial Group Company Ltd, UPL Limited, Syngenta International, and BASF SE. We'll explore the impact of regulatory changes on market growth and the role of technological advancements in shaping product innovation. Analysis will include:
- Market Concentration: Assessment of market share distribution among leading players and identification of dominant players. Specific market share figures (e.g., Company X holds xx% of the market) will be provided.
- Innovation Drivers: Discussion of factors driving innovation, such as the need for enhanced weed control efficacy, increased resistance to glyphosate, and the demand for sustainable agricultural practices.
- Regulatory Frameworks: Evaluation of the impact of existing and anticipated regulations on market growth and product development. This will include analysis of potential impacts of regional regulations on market expansion.
- Product Substitutes: Examination of alternative herbicides and their potential impact on glyphosate demand. The report will quantify the market share of key substitutes.
- End-User Demographics: Profiling of end-users, including their preferences, needs, and geographical distribution. Data on agricultural practices in different regions and their impact on glyphosate consumption will be included.
- M&A Activities: Analysis of recent mergers and acquisitions in the glyphosate market, their impact on market structure, and projected future M&A activity. Specific deal values (e.g., acquisition of Company Y for xx Million) will be provided where available.
Glyphosate Market Dynamics & Trends
This section examines the market's growth drivers, technological advancements, consumer preferences, and competitive dynamics. It will present a comprehensive overview of the market's evolution, highlighting factors impacting its growth trajectory. This section features:
- Market Growth Drivers: Detailed explanation of factors driving market growth, including the rising global demand for food, advancements in agricultural technologies, and increasing adoption of glyphosate in various applications.
- Technological Disruptions: Analysis of emerging technologies impacting glyphosate production and application, such as precision agriculture techniques and the development of glyphosate-resistant crops.
- Consumer Preferences: Exploration of evolving consumer preferences regarding pesticide use, particularly regarding sustainability concerns and the demand for environmentally friendly solutions.
- Competitive Dynamics: Comprehensive analysis of the competitive landscape, including pricing strategies, market share competition, and the impact of new entrants. The report will include CAGR and market penetration rates to illustrate market growth and adoption.
Dominant Regions & Segments in Glyphosate Market
This section identifies the leading regions, countries, and segments within the glyphosate market. Analysis will cover both Type (GM Crops, Non-GM Crops) and Application (Grains and Cereals, Pulses and Oilseeds, Fruits and Vegetables, Commercial Crops, Other Crop Types) segments.
- Key Drivers: This section will use bullet points to highlight key regional drivers for each segment including economic policies, infrastructure, agricultural practices, and regulatory landscapes.
- Dominance Analysis: Detailed paragraphs will provide a thorough analysis of market dominance within each region and segment, explaining the reasons behind their leadership positions. This will include assessment of factors like climate suitability, agricultural practices, and government policies.
Glyphosate Market Product Innovations
This section summarizes recent product developments, highlighting technological advancements and their market fit. The discussion will focus on innovations improving efficacy, reducing environmental impact, and enhancing application methods. Examples will include specifics on new formulations, improved delivery systems, and other relevant technological advances.
Report Scope & Segmentation Analysis
This section details the market segmentation by Type (GM Crops, Non-GM Crops) and Application (Grains and Cereals, Pulses and Oilseeds, Fruits and Vegetables, Commercial Crops, Other Crop Types). Each segment will receive a dedicated paragraph outlining its size, growth projections, and competitive dynamics. Specific market size values (e.g., The Grains and Cereals segment is expected to reach xx Million by 2033) will be provided for each segment.
Key Drivers of Glyphosate Market Growth
This section outlines the primary growth drivers, including technological advancements, economic factors, and regulatory influences shaping the market's expansion. Specific examples will be used to illustrate each driver's contribution to growth.
Challenges in the Glyphosate Market Sector
This section identifies and analyzes the major challenges faced by the glyphosate market, including regulatory hurdles, supply chain disruptions, and competitive pressures. The report will quantify the impact of these challenges wherever possible (e.g., Regulatory restrictions have reduced market growth by xx%).
Emerging Opportunities in Glyphosate Market
This section highlights emerging opportunities for growth, such as new markets, technological advancements, and evolving consumer preferences. Specific examples of potential opportunities will be given.
Leading Players in the Glyphosate Market Market
- FMC Corporation
- Bayer Cropscience AG
- Dow AgroScience
- DuPont
- Adama Agricultural Solutions Ltd
- Nufarm Limited
- Zhejiang Xinan Chemical Industrial Group Company Ltd
- UPL Limited
- Syngenta International
- BASF SE
Key Developments in Glyphosate Market Industry
- August 2022: BASF and Corteva Agriscience announced a collaboration to develop new soybean weed control solutions, including glyphosate-tolerant soybean traits. This development is expected to significantly impact the soybean weed management market and boost demand for glyphosate-tolerant seeds.
- January 2021: Syngenta launched Kesuda, a new glyphosate product in the Chinese market, addressing challenges associated with conventional glyphosate products such as low-temperature instability. This launch expands market access and demonstrates innovation in glyphosate technology.
Future Outlook for Glyphosate Market Market
This section summarizes the future market potential and identifies strategic opportunities for growth. The analysis will incorporate projected market size, anticipated technological advancements, and changing consumer demands to forecast future market trends. The report will offer an outlook on the continued role of glyphosate in agriculture, considering the emergence of alternative solutions and evolving regulatory environments.
Glyphosate Market Segmentation
-
1. Type
- 1.1. GM Crops
- 1.2. Non-GM Crops
-
2. Application
- 2.1. Grains and Cereals
- 2.2. Pulses and Oilseeds
- 2.3. Fruits and Vegetables
- 2.4. Commercial Crops
- 2.5. Other Crop Types
-
3. Type
- 3.1. GM Crops
- 3.2. Non-GM Crops
-
4. Application
- 4.1. Grains and Cereals
- 4.2. Pulses and Oilseeds
- 4.3. Fruits and Vegetables
- 4.4. Commercial Crops
- 4.5. Other Crop Types
Glyphosate Market Segmentation By Geography
-
1. North America
- 1.1. United States
- 1.2. Canada
- 1.3. Mexico
- 1.4. Rest of North America
-
2. Europe
- 2.1. Spain
- 2.2. Italy
- 2.3. France
- 2.4. Germany
- 2.5. Russia
- 2.6. United Kingdom
- 2.7. Rest of Europe
-
3. Asia Pacific
- 3.1. India
- 3.2. China
- 3.3. Japan
- 3.4. Australia
- 3.5. Rest of Asia Pacific
-
4. South America
- 4.1. Brazil
- 4.2. Argentina
- 4.3. Rest of South America
-
5. Africa
- 5.1. South Africa
- 5.2. Rest of Africa
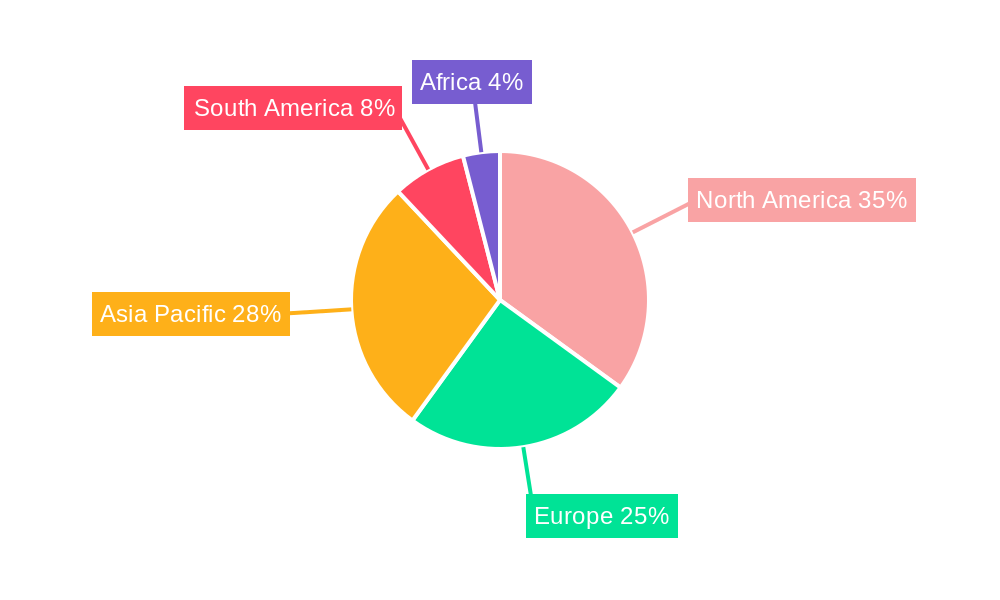
Glyphosate Market Regional Market Share
Geographic Coverage of Glyphosate Market
Glyphosate Market REPORT HIGHLIGHTS
| Aspects | Details |
|---|---|
| Study Period | 2020-2034 |
| Base Year | 2025 |
| Estimated Year | 2026 |
| Forecast Period | 2026-2034 |
| Historical Period | 2020-2025 |
| Growth Rate | CAGR of 7.49% from 2020-2034 |
| Segmentation |
|
Table of Contents
- 1. Introduction
- 1.1. Research Scope
- 1.2. Market Segmentation
- 1.3. Research Objective
- 1.4. Definitions and Assumptions
- 2. Executive Summary
- 2.1. Market Snapshot
- 3. Market Dynamics
- 3.1. Market Drivers
- 3.2. Market Restrains
- 3.3. Market Trends
- 3.4. Market Opportunities
- 4. Market Factor Analysis
- 4.1. Porters Five Forces
- 4.1.1. Bargaining Power of Suppliers
- 4.1.2. Bargaining Power of Buyers
- 4.1.3. Threat of New Entrants
- 4.1.4. Threat of Substitutes
- 4.1.5. Competitive Rivalry
- 4.2. PESTEL analysis
- 4.3. BCG Analysis
- 4.3.1. Stars (High Growth, High Market Share)
- 4.3.2. Cash Cows (Low Growth, High Market Share)
- 4.3.3. Question Mark (High Growth, Low Market Share)
- 4.3.4. Dogs (Low Growth, Low Market Share)
- 4.4. Ansoff Matrix Analysis
- 4.5. Supply Chain Analysis
- 4.6. Regulatory Landscape
- 4.7. Current Market Potential and Opportunity Assessment (TAM–SAM–SOM Framework)
- 4.8. PRI Analyst Note
- 4.1. Porters Five Forces
- 5. Market Analysis, Insights and Forecast 2021-2033
- 5.1. Market Analysis, Insights and Forecast - by Type
- 5.1.1. GM Crops
- 5.1.2. Non-GM Crops
- 5.2. Market Analysis, Insights and Forecast - by Application
- 5.2.1. Grains and Cereals
- 5.2.2. Pulses and Oilseeds
- 5.2.3. Fruits and Vegetables
- 5.2.4. Commercial Crops
- 5.2.5. Other Crop Types
- 5.3. Market Analysis, Insights and Forecast - by Type
- 5.3.1. GM Crops
- 5.3.2. Non-GM Crops
- 5.4. Market Analysis, Insights and Forecast - by Application
- 5.4.1. Grains and Cereals
- 5.4.2. Pulses and Oilseeds
- 5.4.3. Fruits and Vegetables
- 5.4.4. Commercial Crops
- 5.4.5. Other Crop Types
- 5.5. Market Analysis, Insights and Forecast - by Region
- 5.5.1. North America
- 5.5.2. Europe
- 5.5.3. Asia Pacific
- 5.5.4. South America
- 5.5.5. Africa
- 5.1. Market Analysis, Insights and Forecast - by Type
- 6. Global Glyphosate Market Analysis, Insights and Forecast, 2021-2033
- 6.1. Market Analysis, Insights and Forecast - by Type
- 6.1.1. GM Crops
- 6.1.2. Non-GM Crops
- 6.2. Market Analysis, Insights and Forecast - by Application
- 6.2.1. Grains and Cereals
- 6.2.2. Pulses and Oilseeds
- 6.2.3. Fruits and Vegetables
- 6.2.4. Commercial Crops
- 6.2.5. Other Crop Types
- 6.3. Market Analysis, Insights and Forecast - by Type
- 6.3.1. GM Crops
- 6.3.2. Non-GM Crops
- 6.4. Market Analysis, Insights and Forecast - by Application
- 6.4.1. Grains and Cereals
- 6.4.2. Pulses and Oilseeds
- 6.4.3. Fruits and Vegetables
- 6.4.4. Commercial Crops
- 6.4.5. Other Crop Types
- 6.1. Market Analysis, Insights and Forecast - by Type
- 7. North America Glyphosate Market Analysis, Insights and Forecast, 2020-2032
- 7.1. Market Analysis, Insights and Forecast - by Type
- 7.1.1. GM Crops
- 7.1.2. Non-GM Crops
- 7.2. Market Analysis, Insights and Forecast - by Application
- 7.2.1. Grains and Cereals
- 7.2.2. Pulses and Oilseeds
- 7.2.3. Fruits and Vegetables
- 7.2.4. Commercial Crops
- 7.2.5. Other Crop Types
- 7.3. Market Analysis, Insights and Forecast - by Type
- 7.3.1. GM Crops
- 7.3.2. Non-GM Crops
- 7.4. Market Analysis, Insights and Forecast - by Application
- 7.4.1. Grains and Cereals
- 7.4.2. Pulses and Oilseeds
- 7.4.3. Fruits and Vegetables
- 7.4.4. Commercial Crops
- 7.4.5. Other Crop Types
- 7.1. Market Analysis, Insights and Forecast - by Type
- 8. Europe Glyphosate Market Analysis, Insights and Forecast, 2020-2032
- 8.1. Market Analysis, Insights and Forecast - by Type
- 8.1.1. GM Crops
- 8.1.2. Non-GM Crops
- 8.2. Market Analysis, Insights and Forecast - by Application
- 8.2.1. Grains and Cereals
- 8.2.2. Pulses and Oilseeds
- 8.2.3. Fruits and Vegetables
- 8.2.4. Commercial Crops
- 8.2.5. Other Crop Types
- 8.3. Market Analysis, Insights and Forecast - by Type
- 8.3.1. GM Crops
- 8.3.2. Non-GM Crops
- 8.4. Market Analysis, Insights and Forecast - by Application
- 8.4.1. Grains and Cereals
- 8.4.2. Pulses and Oilseeds
- 8.4.3. Fruits and Vegetables
- 8.4.4. Commercial Crops
- 8.4.5. Other Crop Types
- 8.1. Market Analysis, Insights and Forecast - by Type
- 9. Asia Pacific Glyphosate Market Analysis, Insights and Forecast, 2020-2032
- 9.1. Market Analysis, Insights and Forecast - by Type
- 9.1.1. GM Crops
- 9.1.2. Non-GM Crops
- 9.2. Market Analysis, Insights and Forecast - by Application
- 9.2.1. Grains and Cereals
- 9.2.2. Pulses and Oilseeds
- 9.2.3. Fruits and Vegetables
- 9.2.4. Commercial Crops
- 9.2.5. Other Crop Types
- 9.3. Market Analysis, Insights and Forecast - by Type
- 9.3.1. GM Crops
- 9.3.2. Non-GM Crops
- 9.4. Market Analysis, Insights and Forecast - by Application
- 9.4.1. Grains and Cereals
- 9.4.2. Pulses and Oilseeds
- 9.4.3. Fruits and Vegetables
- 9.4.4. Commercial Crops
- 9.4.5. Other Crop Types
- 9.1. Market Analysis, Insights and Forecast - by Type
- 10. South America Glyphosate Market Analysis, Insights and Forecast, 2020-2032
- 10.1. Market Analysis, Insights and Forecast - by Type
- 10.1.1. GM Crops
- 10.1.2. Non-GM Crops
- 10.2. Market Analysis, Insights and Forecast - by Application
- 10.2.1. Grains and Cereals
- 10.2.2. Pulses and Oilseeds
- 10.2.3. Fruits and Vegetables
- 10.2.4. Commercial Crops
- 10.2.5. Other Crop Types
- 10.3. Market Analysis, Insights and Forecast - by Type
- 10.3.1. GM Crops
- 10.3.2. Non-GM Crops
- 10.4. Market Analysis, Insights and Forecast - by Application
- 10.4.1. Grains and Cereals
- 10.4.2. Pulses and Oilseeds
- 10.4.3. Fruits and Vegetables
- 10.4.4. Commercial Crops
- 10.4.5. Other Crop Types
- 10.1. Market Analysis, Insights and Forecast - by Type
- 11. Africa Glyphosate Market Analysis, Insights and Forecast, 2020-2032
- 11.1. Market Analysis, Insights and Forecast - by Type
- 11.1.1. GM Crops
- 11.1.2. Non-GM Crops
- 11.2. Market Analysis, Insights and Forecast - by Application
- 11.2.1. Grains and Cereals
- 11.2.2. Pulses and Oilseeds
- 11.2.3. Fruits and Vegetables
- 11.2.4. Commercial Crops
- 11.2.5. Other Crop Types
- 11.3. Market Analysis, Insights and Forecast - by Type
- 11.3.1. GM Crops
- 11.3.2. Non-GM Crops
- 11.4. Market Analysis, Insights and Forecast - by Application
- 11.4.1. Grains and Cereals
- 11.4.2. Pulses and Oilseeds
- 11.4.3. Fruits and Vegetables
- 11.4.4. Commercial Crops
- 11.4.5. Other Crop Types
- 11.1. Market Analysis, Insights and Forecast - by Type
- 12. Competitive Analysis
- 12.1. Company Profiles
- 12.1.1 FMC Corporation
- 12.1.1.1. Company Overview
- 12.1.1.2. Products
- 12.1.1.3. Company Financials
- 12.1.1.4. SWOT Analysis
- 12.1.2 Bayer Cropscience AG
- 12.1.2.1. Company Overview
- 12.1.2.2. Products
- 12.1.2.3. Company Financials
- 12.1.2.4. SWOT Analysis
- 12.1.3 Dow AgroScience
- 12.1.3.1. Company Overview
- 12.1.3.2. Products
- 12.1.3.3. Company Financials
- 12.1.3.4. SWOT Analysis
- 12.1.4 DuPont
- 12.1.4.1. Company Overview
- 12.1.4.2. Products
- 12.1.4.3. Company Financials
- 12.1.4.4. SWOT Analysis
- 12.1.5 Adama Agricultural Solutions Ltd
- 12.1.5.1. Company Overview
- 12.1.5.2. Products
- 12.1.5.3. Company Financials
- 12.1.5.4. SWOT Analysis
- 12.1.6 Nufarm Limited
- 12.1.6.1. Company Overview
- 12.1.6.2. Products
- 12.1.6.3. Company Financials
- 12.1.6.4. SWOT Analysis
- 12.1.7 Zhejiang Xinan Chemical Industrial Group Company Ltd
- 12.1.7.1. Company Overview
- 12.1.7.2. Products
- 12.1.7.3. Company Financials
- 12.1.7.4. SWOT Analysis
- 12.1.8 UPL Limited
- 12.1.8.1. Company Overview
- 12.1.8.2. Products
- 12.1.8.3. Company Financials
- 12.1.8.4. SWOT Analysis
- 12.1.9 Syngenta International
- 12.1.9.1. Company Overview
- 12.1.9.2. Products
- 12.1.9.3. Company Financials
- 12.1.9.4. SWOT Analysis
- 12.1.10 BASF SE
- 12.1.10.1. Company Overview
- 12.1.10.2. Products
- 12.1.10.3. Company Financials
- 12.1.10.4. SWOT Analysis
- 12.1.1 FMC Corporation
- 12.2. Market Entropy
- 12.2.1 Company's Key Areas Served
- 12.2.2 Recent Developments
- 12.3. Company Market Share Analysis 2025
- 12.3.1 Top 5 Companies Market Share Analysis
- 12.3.2 Top 3 Companies Market Share Analysis
- 12.4. List of Potential Customers
- 13. Research Methodology
List of Figures
- Figure 1: Global Glyphosate Market Revenue Breakdown (Million, %) by Region 2025 & 2033
- Figure 2: Global Glyphosate Market Volume Breakdown (Kiloton, %) by Region 2025 & 2033
- Figure 3: North America Glyphosate Market Revenue (Million), by Type 2025 & 2033
- Figure 4: North America Glyphosate Market Volume (Kiloton), by Type 2025 & 2033
- Figure 5: North America Glyphosate Market Revenue Share (%), by Type 2025 & 2033
- Figure 6: North America Glyphosate Market Volume Share (%), by Type 2025 & 2033
- Figure 7: North America Glyphosate Market Revenue (Million), by Application 2025 & 2033
- Figure 8: North America Glyphosate Market Volume (Kiloton), by Application 2025 & 2033
- Figure 9: North America Glyphosate Market Revenue Share (%), by Application 2025 & 2033
- Figure 10: North America Glyphosate Market Volume Share (%), by Application 2025 & 2033
- Figure 11: North America Glyphosate Market Revenue (Million), by Type 2025 & 2033
- Figure 12: North America Glyphosate Market Volume (Kiloton), by Type 2025 & 2033
- Figure 13: North America Glyphosate Market Revenue Share (%), by Type 2025 & 2033
- Figure 14: North America Glyphosate Market Volume Share (%), by Type 2025 & 2033
- Figure 15: North America Glyphosate Market Revenue (Million), by Application 2025 & 2033
- Figure 16: North America Glyphosate Market Volume (Kiloton), by Application 2025 & 2033
- Figure 17: North America Glyphosate Market Revenue Share (%), by Application 2025 & 2033
- Figure 18: North America Glyphosate Market Volume Share (%), by Application 2025 & 2033
- Figure 19: North America Glyphosate Market Revenue (Million), by Country 2025 & 2033
- Figure 20: North America Glyphosate Market Volume (Kiloton), by Country 2025 & 2033
- Figure 21: North America Glyphosate Market Revenue Share (%), by Country 2025 & 2033
- Figure 22: North America Glyphosate Market Volume Share (%), by Country 2025 & 2033
- Figure 23: Europe Glyphosate Market Revenue (Million), by Type 2025 & 2033
- Figure 24: Europe Glyphosate Market Volume (Kiloton), by Type 2025 & 2033
- Figure 25: Europe Glyphosate Market Revenue Share (%), by Type 2025 & 2033
- Figure 26: Europe Glyphosate Market Volume Share (%), by Type 2025 & 2033
- Figure 27: Europe Glyphosate Market Revenue (Million), by Application 2025 & 2033
- Figure 28: Europe Glyphosate Market Volume (Kiloton), by Application 2025 & 2033
- Figure 29: Europe Glyphosate Market Revenue Share (%), by Application 2025 & 2033
- Figure 30: Europe Glyphosate Market Volume Share (%), by Application 2025 & 2033
- Figure 31: Europe Glyphosate Market Revenue (Million), by Type 2025 & 2033
- Figure 32: Europe Glyphosate Market Volume (Kiloton), by Type 2025 & 2033
- Figure 33: Europe Glyphosate Market Revenue Share (%), by Type 2025 & 2033
- Figure 34: Europe Glyphosate Market Volume Share (%), by Type 2025 & 2033
- Figure 35: Europe Glyphosate Market Revenue (Million), by Application 2025 & 2033
- Figure 36: Europe Glyphosate Market Volume (Kiloton), by Application 2025 & 2033
- Figure 37: Europe Glyphosate Market Revenue Share (%), by Application 2025 & 2033
- Figure 38: Europe Glyphosate Market Volume Share (%), by Application 2025 & 2033
- Figure 39: Europe Glyphosate Market Revenue (Million), by Country 2025 & 2033
- Figure 40: Europe Glyphosate Market Volume (Kiloton), by Country 2025 & 2033
- Figure 41: Europe Glyphosate Market Revenue Share (%), by Country 2025 & 2033
- Figure 42: Europe Glyphosate Market Volume Share (%), by Country 2025 & 2033
- Figure 43: Asia Pacific Glyphosate Market Revenue (Million), by Type 2025 & 2033
- Figure 44: Asia Pacific Glyphosate Market Volume (Kiloton), by Type 2025 & 2033
- Figure 45: Asia Pacific Glyphosate Market Revenue Share (%), by Type 2025 & 2033
- Figure 46: Asia Pacific Glyphosate Market Volume Share (%), by Type 2025 & 2033
- Figure 47: Asia Pacific Glyphosate Market Revenue (Million), by Application 2025 & 2033
- Figure 48: Asia Pacific Glyphosate Market Volume (Kiloton), by Application 2025 & 2033
- Figure 49: Asia Pacific Glyphosate Market Revenue Share (%), by Application 2025 & 2033
- Figure 50: Asia Pacific Glyphosate Market Volume Share (%), by Application 2025 & 2033
- Figure 51: Asia Pacific Glyphosate Market Revenue (Million), by Type 2025 & 2033
- Figure 52: Asia Pacific Glyphosate Market Volume (Kiloton), by Type 2025 & 2033
- Figure 53: Asia Pacific Glyphosate Market Revenue Share (%), by Type 2025 & 2033
- Figure 54: Asia Pacific Glyphosate Market Volume Share (%), by Type 2025 & 2033
- Figure 55: Asia Pacific Glyphosate Market Revenue (Million), by Application 2025 & 2033
- Figure 56: Asia Pacific Glyphosate Market Volume (Kiloton), by Application 2025 & 2033
- Figure 57: Asia Pacific Glyphosate Market Revenue Share (%), by Application 2025 & 2033
- Figure 58: Asia Pacific Glyphosate Market Volume Share (%), by Application 2025 & 2033
- Figure 59: Asia Pacific Glyphosate Market Revenue (Million), by Country 2025 & 2033
- Figure 60: Asia Pacific Glyphosate Market Volume (Kiloton), by Country 2025 & 2033
- Figure 61: Asia Pacific Glyphosate Market Revenue Share (%), by Country 2025 & 2033
- Figure 62: Asia Pacific Glyphosate Market Volume Share (%), by Country 2025 & 2033
- Figure 63: South America Glyphosate Market Revenue (Million), by Type 2025 & 2033
- Figure 64: South America Glyphosate Market Volume (Kiloton), by Type 2025 & 2033
- Figure 65: South America Glyphosate Market Revenue Share (%), by Type 2025 & 2033
- Figure 66: South America Glyphosate Market Volume Share (%), by Type 2025 & 2033
- Figure 67: South America Glyphosate Market Revenue (Million), by Application 2025 & 2033
- Figure 68: South America Glyphosate Market Volume (Kiloton), by Application 2025 & 2033
- Figure 69: South America Glyphosate Market Revenue Share (%), by Application 2025 & 2033
- Figure 70: South America Glyphosate Market Volume Share (%), by Application 2025 & 2033
- Figure 71: South America Glyphosate Market Revenue (Million), by Type 2025 & 2033
- Figure 72: South America Glyphosate Market Volume (Kiloton), by Type 2025 & 2033
- Figure 73: South America Glyphosate Market Revenue Share (%), by Type 2025 & 2033
- Figure 74: South America Glyphosate Market Volume Share (%), by Type 2025 & 2033
- Figure 75: South America Glyphosate Market Revenue (Million), by Application 2025 & 2033
- Figure 76: South America Glyphosate Market Volume (Kiloton), by Application 2025 & 2033
- Figure 77: South America Glyphosate Market Revenue Share (%), by Application 2025 & 2033
- Figure 78: South America Glyphosate Market Volume Share (%), by Application 2025 & 2033
- Figure 79: South America Glyphosate Market Revenue (Million), by Country 2025 & 2033
- Figure 80: South America Glyphosate Market Volume (Kiloton), by Country 2025 & 2033
- Figure 81: South America Glyphosate Market Revenue Share (%), by Country 2025 & 2033
- Figure 82: South America Glyphosate Market Volume Share (%), by Country 2025 & 2033
- Figure 83: Africa Glyphosate Market Revenue (Million), by Type 2025 & 2033
- Figure 84: Africa Glyphosate Market Volume (Kiloton), by Type 2025 & 2033
- Figure 85: Africa Glyphosate Market Revenue Share (%), by Type 2025 & 2033
- Figure 86: Africa Glyphosate Market Volume Share (%), by Type 2025 & 2033
- Figure 87: Africa Glyphosate Market Revenue (Million), by Application 2025 & 2033
- Figure 88: Africa Glyphosate Market Volume (Kiloton), by Application 2025 & 2033
- Figure 89: Africa Glyphosate Market Revenue Share (%), by Application 2025 & 2033
- Figure 90: Africa Glyphosate Market Volume Share (%), by Application 2025 & 2033
- Figure 91: Africa Glyphosate Market Revenue (Million), by Type 2025 & 2033
- Figure 92: Africa Glyphosate Market Volume (Kiloton), by Type 2025 & 2033
- Figure 93: Africa Glyphosate Market Revenue Share (%), by Type 2025 & 2033
- Figure 94: Africa Glyphosate Market Volume Share (%), by Type 2025 & 2033
- Figure 95: Africa Glyphosate Market Revenue (Million), by Application 2025 & 2033
- Figure 96: Africa Glyphosate Market Volume (Kiloton), by Application 2025 & 2033
- Figure 97: Africa Glyphosate Market Revenue Share (%), by Application 2025 & 2033
- Figure 98: Africa Glyphosate Market Volume Share (%), by Application 2025 & 2033
- Figure 99: Africa Glyphosate Market Revenue (Million), by Country 2025 & 2033
- Figure 100: Africa Glyphosate Market Volume (Kiloton), by Country 2025 & 2033
- Figure 101: Africa Glyphosate Market Revenue Share (%), by Country 2025 & 2033
- Figure 102: Africa Glyphosate Market Volume Share (%), by Country 2025 & 2033
List of Tables
- Table 1: Global Glyphosate Market Revenue Million Forecast, by Type 2020 & 2033
- Table 2: Global Glyphosate Market Volume Kiloton Forecast, by Type 2020 & 2033
- Table 3: Global Glyphosate Market Revenue Million Forecast, by Application 2020 & 2033
- Table 4: Global Glyphosate Market Volume Kiloton Forecast, by Application 2020 & 2033
- Table 5: Global Glyphosate Market Revenue Million Forecast, by Type 2020 & 2033
- Table 6: Global Glyphosate Market Volume Kiloton Forecast, by Type 2020 & 2033
- Table 7: Global Glyphosate Market Revenue Million Forecast, by Application 2020 & 2033
- Table 8: Global Glyphosate Market Volume Kiloton Forecast, by Application 2020 & 2033
- Table 9: Global Glyphosate Market Revenue Million Forecast, by Region 2020 & 2033
- Table 10: Global Glyphosate Market Volume Kiloton Forecast, by Region 2020 & 2033
- Table 11: Global Glyphosate Market Revenue Million Forecast, by Type 2020 & 2033
- Table 12: Global Glyphosate Market Volume Kiloton Forecast, by Type 2020 & 2033
- Table 13: Global Glyphosate Market Revenue Million Forecast, by Application 2020 & 2033
- Table 14: Global Glyphosate Market Volume Kiloton Forecast, by Application 2020 & 2033
- Table 15: Global Glyphosate Market Revenue Million Forecast, by Type 2020 & 2033
- Table 16: Global Glyphosate Market Volume Kiloton Forecast, by Type 2020 & 2033
- Table 17: Global Glyphosate Market Revenue Million Forecast, by Application 2020 & 2033
- Table 18: Global Glyphosate Market Volume Kiloton Forecast, by Application 2020 & 2033
- Table 19: Global Glyphosate Market Revenue Million Forecast, by Country 2020 & 2033
- Table 20: Global Glyphosate Market Volume Kiloton Forecast, by Country 2020 & 2033
- Table 21: United States Glyphosate Market Revenue (Million) Forecast, by Application 2020 & 2033
- Table 22: United States Glyphosate Market Volume (Kiloton) Forecast, by Application 2020 & 2033
- Table 23: Canada Glyphosate Market Revenue (Million) Forecast, by Application 2020 & 2033
- Table 24: Canada Glyphosate Market Volume (Kiloton) Forecast, by Application 2020 & 2033
- Table 25: Mexico Glyphosate Market Revenue (Million) Forecast, by Application 2020 & 2033
- Table 26: Mexico Glyphosate Market Volume (Kiloton) Forecast, by Application 2020 & 2033
- Table 27: Rest of North America Glyphosate Market Revenue (Million) Forecast, by Application 2020 & 2033
- Table 28: Rest of North America Glyphosate Market Volume (Kiloton) Forecast, by Application 2020 & 2033
- Table 29: Global Glyphosate Market Revenue Million Forecast, by Type 2020 & 2033
- Table 30: Global Glyphosate Market Volume Kiloton Forecast, by Type 2020 & 2033
- Table 31: Global Glyphosate Market Revenue Million Forecast, by Application 2020 & 2033
- Table 32: Global Glyphosate Market Volume Kiloton Forecast, by Application 2020 & 2033
- Table 33: Global Glyphosate Market Revenue Million Forecast, by Type 2020 & 2033
- Table 34: Global Glyphosate Market Volume Kiloton Forecast, by Type 2020 & 2033
- Table 35: Global Glyphosate Market Revenue Million Forecast, by Application 2020 & 2033
- Table 36: Global Glyphosate Market Volume Kiloton Forecast, by Application 2020 & 2033
- Table 37: Global Glyphosate Market Revenue Million Forecast, by Country 2020 & 2033
- Table 38: Global Glyphosate Market Volume Kiloton Forecast, by Country 2020 & 2033
- Table 39: Spain Glyphosate Market Revenue (Million) Forecast, by Application 2020 & 2033
- Table 40: Spain Glyphosate Market Volume (Kiloton) Forecast, by Application 2020 & 2033
- Table 41: Italy Glyphosate Market Revenue (Million) Forecast, by Application 2020 & 2033
- Table 42: Italy Glyphosate Market Volume (Kiloton) Forecast, by Application 2020 & 2033
- Table 43: France Glyphosate Market Revenue (Million) Forecast, by Application 2020 & 2033
- Table 44: France Glyphosate Market Volume (Kiloton) Forecast, by Application 2020 & 2033
- Table 45: Germany Glyphosate Market Revenue (Million) Forecast, by Application 2020 & 2033
- Table 46: Germany Glyphosate Market Volume (Kiloton) Forecast, by Application 2020 & 2033
- Table 47: Russia Glyphosate Market Revenue (Million) Forecast, by Application 2020 & 2033
- Table 48: Russia Glyphosate Market Volume (Kiloton) Forecast, by Application 2020 & 2033
- Table 49: United Kingdom Glyphosate Market Revenue (Million) Forecast, by Application 2020 & 2033
- Table 50: United Kingdom Glyphosate Market Volume (Kiloton) Forecast, by Application 2020 & 2033
- Table 51: Rest of Europe Glyphosate Market Revenue (Million) Forecast, by Application 2020 & 2033
- Table 52: Rest of Europe Glyphosate Market Volume (Kiloton) Forecast, by Application 2020 & 2033
- Table 53: Global Glyphosate Market Revenue Million Forecast, by Type 2020 & 2033
- Table 54: Global Glyphosate Market Volume Kiloton Forecast, by Type 2020 & 2033
- Table 55: Global Glyphosate Market Revenue Million Forecast, by Application 2020 & 2033
- Table 56: Global Glyphosate Market Volume Kiloton Forecast, by Application 2020 & 2033
- Table 57: Global Glyphosate Market Revenue Million Forecast, by Type 2020 & 2033
- Table 58: Global Glyphosate Market Volume Kiloton Forecast, by Type 2020 & 2033
- Table 59: Global Glyphosate Market Revenue Million Forecast, by Application 2020 & 2033
- Table 60: Global Glyphosate Market Volume Kiloton Forecast, by Application 2020 & 2033
- Table 61: Global Glyphosate Market Revenue Million Forecast, by Country 2020 & 2033
- Table 62: Global Glyphosate Market Volume Kiloton Forecast, by Country 2020 & 2033
- Table 63: India Glyphosate Market Revenue (Million) Forecast, by Application 2020 & 2033
- Table 64: India Glyphosate Market Volume (Kiloton) Forecast, by Application 2020 & 2033
- Table 65: China Glyphosate Market Revenue (Million) Forecast, by Application 2020 & 2033
- Table 66: China Glyphosate Market Volume (Kiloton) Forecast, by Application 2020 & 2033
- Table 67: Japan Glyphosate Market Revenue (Million) Forecast, by Application 2020 & 2033
- Table 68: Japan Glyphosate Market Volume (Kiloton) Forecast, by Application 2020 & 2033
- Table 69: Australia Glyphosate Market Revenue (Million) Forecast, by Application 2020 & 2033
- Table 70: Australia Glyphosate Market Volume (Kiloton) Forecast, by Application 2020 & 2033
- Table 71: Rest of Asia Pacific Glyphosate Market Revenue (Million) Forecast, by Application 2020 & 2033
- Table 72: Rest of Asia Pacific Glyphosate Market Volume (Kiloton) Forecast, by Application 2020 & 2033
- Table 73: Global Glyphosate Market Revenue Million Forecast, by Type 2020 & 2033
- Table 74: Global Glyphosate Market Volume Kiloton Forecast, by Type 2020 & 2033
- Table 75: Global Glyphosate Market Revenue Million Forecast, by Application 2020 & 2033
- Table 76: Global Glyphosate Market Volume Kiloton Forecast, by Application 2020 & 2033
- Table 77: Global Glyphosate Market Revenue Million Forecast, by Type 2020 & 2033
- Table 78: Global Glyphosate Market Volume Kiloton Forecast, by Type 2020 & 2033
- Table 79: Global Glyphosate Market Revenue Million Forecast, by Application 2020 & 2033
- Table 80: Global Glyphosate Market Volume Kiloton Forecast, by Application 2020 & 2033
- Table 81: Global Glyphosate Market Revenue Million Forecast, by Country 2020 & 2033
- Table 82: Global Glyphosate Market Volume Kiloton Forecast, by Country 2020 & 2033
- Table 83: Brazil Glyphosate Market Revenue (Million) Forecast, by Application 2020 & 2033
- Table 84: Brazil Glyphosate Market Volume (Kiloton) Forecast, by Application 2020 & 2033
- Table 85: Argentina Glyphosate Market Revenue (Million) Forecast, by Application 2020 & 2033
- Table 86: Argentina Glyphosate Market Volume (Kiloton) Forecast, by Application 2020 & 2033
- Table 87: Rest of South America Glyphosate Market Revenue (Million) Forecast, by Application 2020 & 2033
- Table 88: Rest of South America Glyphosate Market Volume (Kiloton) Forecast, by Application 2020 & 2033
- Table 89: Global Glyphosate Market Revenue Million Forecast, by Type 2020 & 2033
- Table 90: Global Glyphosate Market Volume Kiloton Forecast, by Type 2020 & 2033
- Table 91: Global Glyphosate Market Revenue Million Forecast, by Application 2020 & 2033
- Table 92: Global Glyphosate Market Volume Kiloton Forecast, by Application 2020 & 2033
- Table 93: Global Glyphosate Market Revenue Million Forecast, by Type 2020 & 2033
- Table 94: Global Glyphosate Market Volume Kiloton Forecast, by Type 2020 & 2033
- Table 95: Global Glyphosate Market Revenue Million Forecast, by Application 2020 & 2033
- Table 96: Global Glyphosate Market Volume Kiloton Forecast, by Application 2020 & 2033
- Table 97: Global Glyphosate Market Revenue Million Forecast, by Country 2020 & 2033
- Table 98: Global Glyphosate Market Volume Kiloton Forecast, by Country 2020 & 2033
- Table 99: South Africa Glyphosate Market Revenue (Million) Forecast, by Application 2020 & 2033
- Table 100: South Africa Glyphosate Market Volume (Kiloton) Forecast, by Application 2020 & 2033
- Table 101: Rest of Africa Glyphosate Market Revenue (Million) Forecast, by Application 2020 & 2033
- Table 102: Rest of Africa Glyphosate Market Volume (Kiloton) Forecast, by Application 2020 & 2033
Frequently Asked Questions
1. What is the projected Compound Annual Growth Rate (CAGR) of the Glyphosate Market?
The projected CAGR is approximately 7.49%.
2. Which companies are prominent players in the Glyphosate Market?
Key companies in the market include FMC Corporation, Bayer Cropscience AG, Dow AgroScience, DuPont, Adama Agricultural Solutions Ltd, Nufarm Limited, Zhejiang Xinan Chemical Industrial Group Company Ltd, UPL Limited, Syngenta International, BASF SE.
3. What are the main segments of the Glyphosate Market?
The market segments include Type, Application, Type, Application.
4. Can you provide details about the market size?
The market size is estimated to be USD 9.14 Million as of 2022.
5. What are some drivers contributing to market growth?
Seed Treatment As A Solution To Enhance Yield; Growing Awareness For Seed Treatment Among The Farmers; Rising Trend Of Organic Farming.
6. What are the notable trends driving market growth?
Commercialization of Genetically Engineered Herbicide-tolerant Crops.
7. Are there any restraints impacting market growth?
Limitations Across Farm-Level Seed Treatment; Rising Environmental Concerns.
8. Can you provide examples of recent developments in the market?
August 2022: BASF and Corteva Agriscience entered a collaboration deal to develop new soybean weed control solutions for farmers around the world, and the companies agreed to cross-license soybean traits while developing complementary herbicide technologies (which will include tolerance to glyphosate), enabling both companies to offer innovative soybean weed management solutions.
9. What pricing options are available for accessing the report?
Pricing options include single-user, multi-user, and enterprise licenses priced at USD 4750, USD 5250, and USD 8750 respectively.
10. Is the market size provided in terms of value or volume?
The market size is provided in terms of value, measured in Million and volume, measured in Kiloton.
11. Are there any specific market keywords associated with the report?
Yes, the market keyword associated with the report is "Glyphosate Market," which aids in identifying and referencing the specific market segment covered.
12. How do I determine which pricing option suits my needs best?
The pricing options vary based on user requirements and access needs. Individual users may opt for single-user licenses, while businesses requiring broader access may choose multi-user or enterprise licenses for cost-effective access to the report.
13. Are there any additional resources or data provided in the Glyphosate Market report?
While the report offers comprehensive insights, it's advisable to review the specific contents or supplementary materials provided to ascertain if additional resources or data are available.
14. How can I stay updated on further developments or reports in the Glyphosate Market?
To stay informed about further developments, trends, and reports in the Glyphosate Market, consider subscribing to industry newsletters, following relevant companies and organizations, or regularly checking reputable industry news sources and publications.
Methodology
Step 1 - Identification of Relevant Samples Size from Population Database


Step 2 - Approaches for Defining Global Market Size (Value, Volume* & Price*)

Note*: In applicable scenarios
Step 3 - Data Sources
Primary Research
- Web Analytics
- Survey Reports
- Research Institute
- Latest Research Reports
- Opinion Leaders
Secondary Research
- Annual Reports
- White Paper
- Latest Press Release
- Industry Association
- Paid Database
- Investor Presentations

Step 4 - Data Triangulation
Involves using different sources of information in order to increase the validity of a study
These sources are likely to be stakeholders in a program - participants, other researchers, program staff, other community members, and so on.
Then we put all data in single framework & apply various statistical tools to find out the dynamic on the market.
During the analysis stage, feedback from the stakeholder groups would be compared to determine areas of agreement as well as areas of divergence