Key Insights
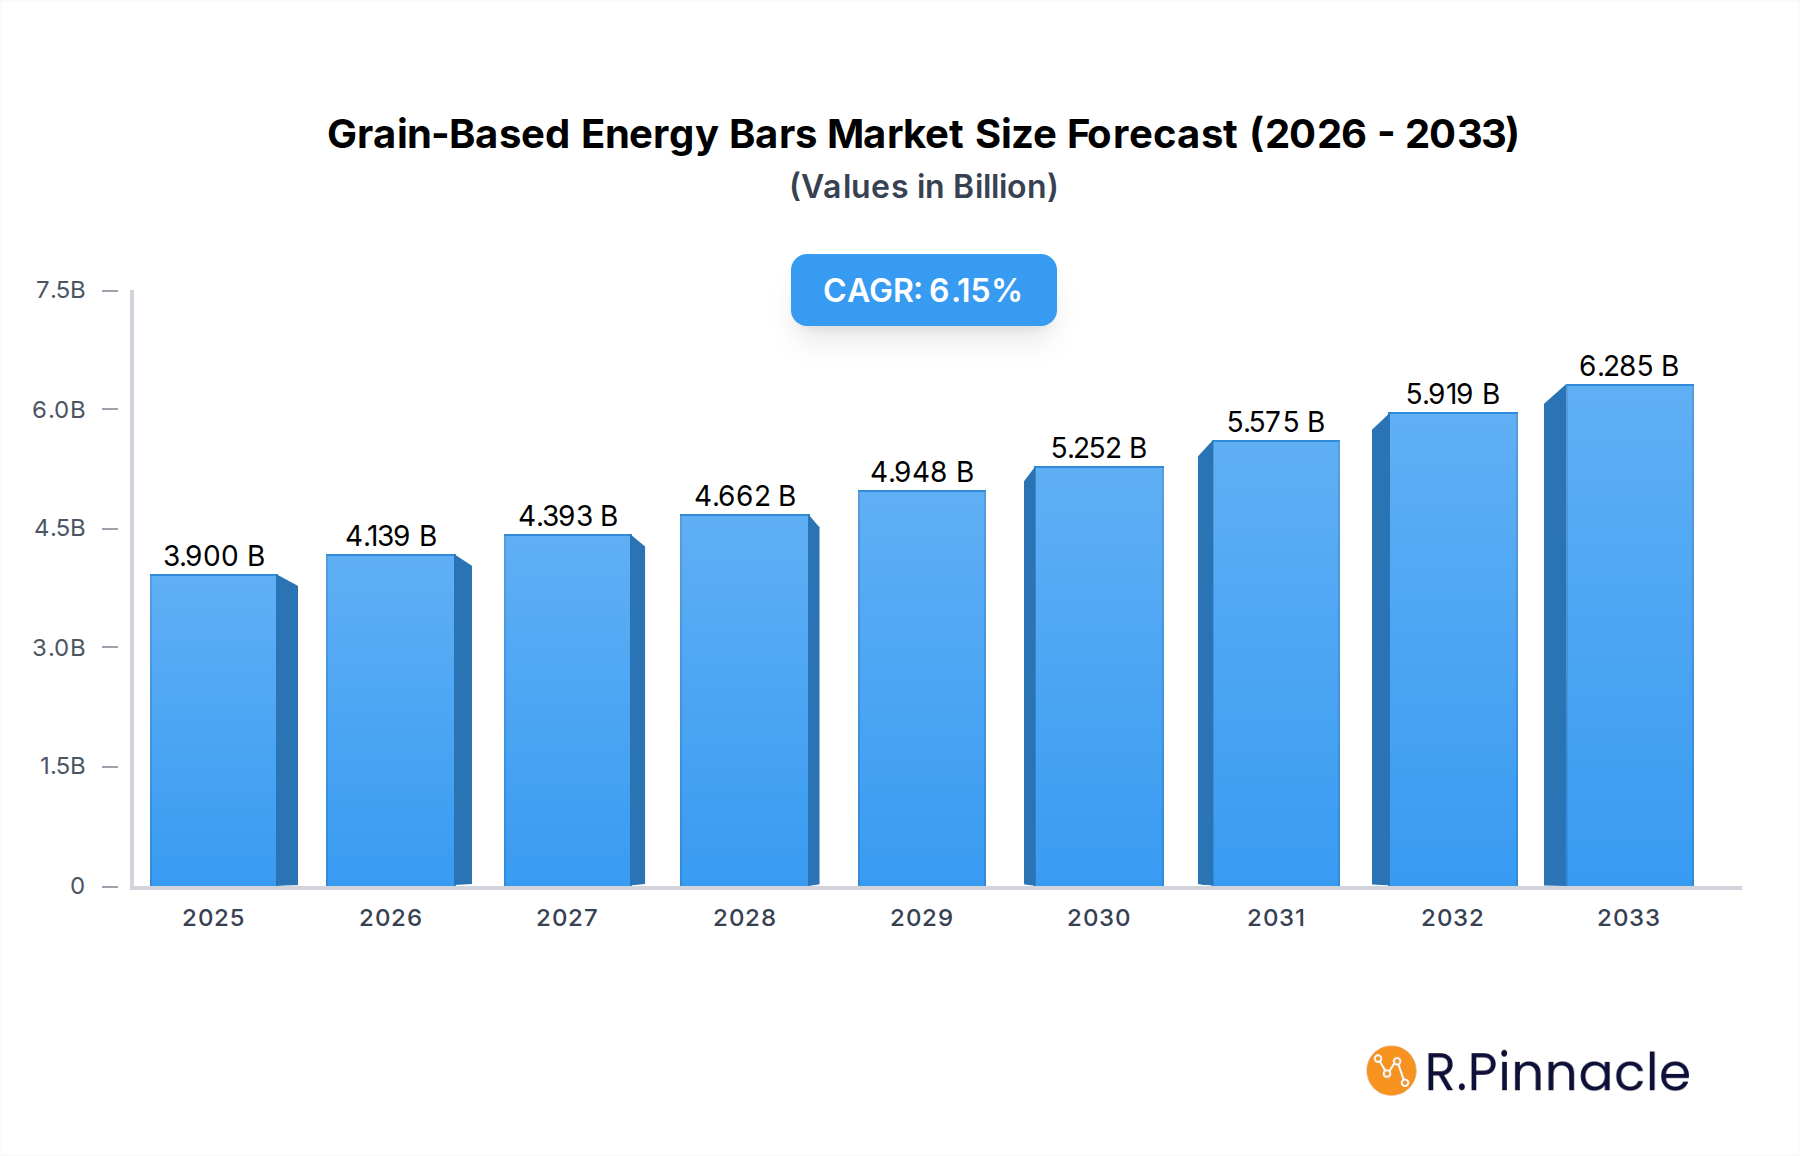
The global grain-based energy bar market is projected for robust expansion, reaching an estimated USD 3.9 billion in 2025. This growth is fueled by a significant CAGR of 5.6% anticipated over the forecast period. The increasing consumer focus on health and wellness, coupled with the demand for convenient and nutritious snack options, is a primary driver. Busy lifestyles, growing participation in sports and fitness activities, and the rising disposable income in developing economies further contribute to market traction. Consumers are increasingly seeking out products that offer sustained energy release and functional benefits, positioning grain-based energy bars as a go-to choice for on-the-go nutrition.

Grain-Based Energy Bars Market Size (In Billion)
The market segmentation reveals a dynamic landscape, with online sales channels exhibiting rapid growth, mirroring broader e-commerce trends. Within product types, High Protein and High Fiber bars are particularly in demand, aligning with prevailing dietary preferences and the desire for satiating and health-promoting snacks. Key players like KIND Snacks, Clif Bar & Company, and RXBAR are actively innovating, introducing new formulations and flavors to cater to evolving consumer tastes. While the market demonstrates strong upward momentum, potential restraints such as fluctuating raw material prices and intense competition could pose challenges. However, strategic product development and effective marketing initiatives are expected to mitigate these concerns, ensuring continued market vitality.
Grain-Based Energy Bars Company Market Share
Grain-Based Energy Bars Market Report: Strategic Insights and Growth Trajectories
Unlock the future of the grain-based energy bars market with this comprehensive, data-driven report. Delve into intricate market dynamics, emerging trends, and strategic opportunities shaping the global landscape. This analysis, spanning the Historical Period (2019–2024) and projecting to 2033 with a Base Year of 2025, offers unparalleled insights for industry professionals, manufacturers, and investors. Discover the strategies of leading companies like KIND Snacks, Clif Bar & Company, RXBAR, LÄRABAR, GoMacro, Bob’s Red Mill, Quest Nutrition, Zing Bars, NuGo Nutrition, and General Mills.
Grain-Based Energy Bars Market Structure & Innovation Trends
The global grain-based energy bars market exhibits a moderately concentrated structure, with key players like KIND Snacks and Clif Bar & Company holding significant market share, estimated to be over 40% combined. Innovation is a primary driver, fueled by consumer demand for healthier, more functional ingredients and diverse flavor profiles. Regulatory frameworks, particularly those concerning labeling and nutritional claims, play a crucial role in shaping product development. While product substitutes like protein powders and fruit snacks exist, grain-based energy bars maintain a strong foothold due to their convenience and perceived nutritional benefits. End-user demographics are expanding, encompassing athletes, busy professionals, and health-conscious individuals of all ages. Merger and acquisition (M&A) activities have been moderate, with deal values in the hundreds of billions of dollars, indicating strategic consolidation and expansion efforts by larger entities seeking to broaden their product portfolios or gain market access.
Grain-Based Energy Bars Market Dynamics & Trends
The grain-based energy bars market is experiencing robust growth, driven by an increasing consumer focus on health and wellness, and a growing demand for convenient, on-the-go nutrition. The market penetration for these bars is estimated to reach over 70% within the forecast period. A significant growth driver is the evolving consumer preference towards natural, organic, and plant-based ingredients. This trend is compelling manufacturers to reformulate products, reducing artificial additives and incorporating superfoods. Technological disruptions are evident in the advancements in processing techniques that allow for extended shelf life and improved texture without compromising nutritional value. The competitive dynamics are intensifying, with both established brands and emerging startups vying for market share. This is leading to aggressive marketing campaigns, product diversification, and strategic partnerships. The Compound Annual Growth Rate (CAGR) for the global grain-based energy bars market is projected to be approximately 8.5% from 2025 to 2033. The increasing prevalence of lifestyle diseases and the growing awareness of the importance of a balanced diet further bolster the demand for functional food products like energy bars. Moreover, the expansion of e-commerce platforms has made these products more accessible to a wider consumer base, contributing significantly to market expansion. The focus on sustainable sourcing of ingredients and eco-friendly packaging is also becoming a critical trend, influencing brand perception and consumer loyalty.
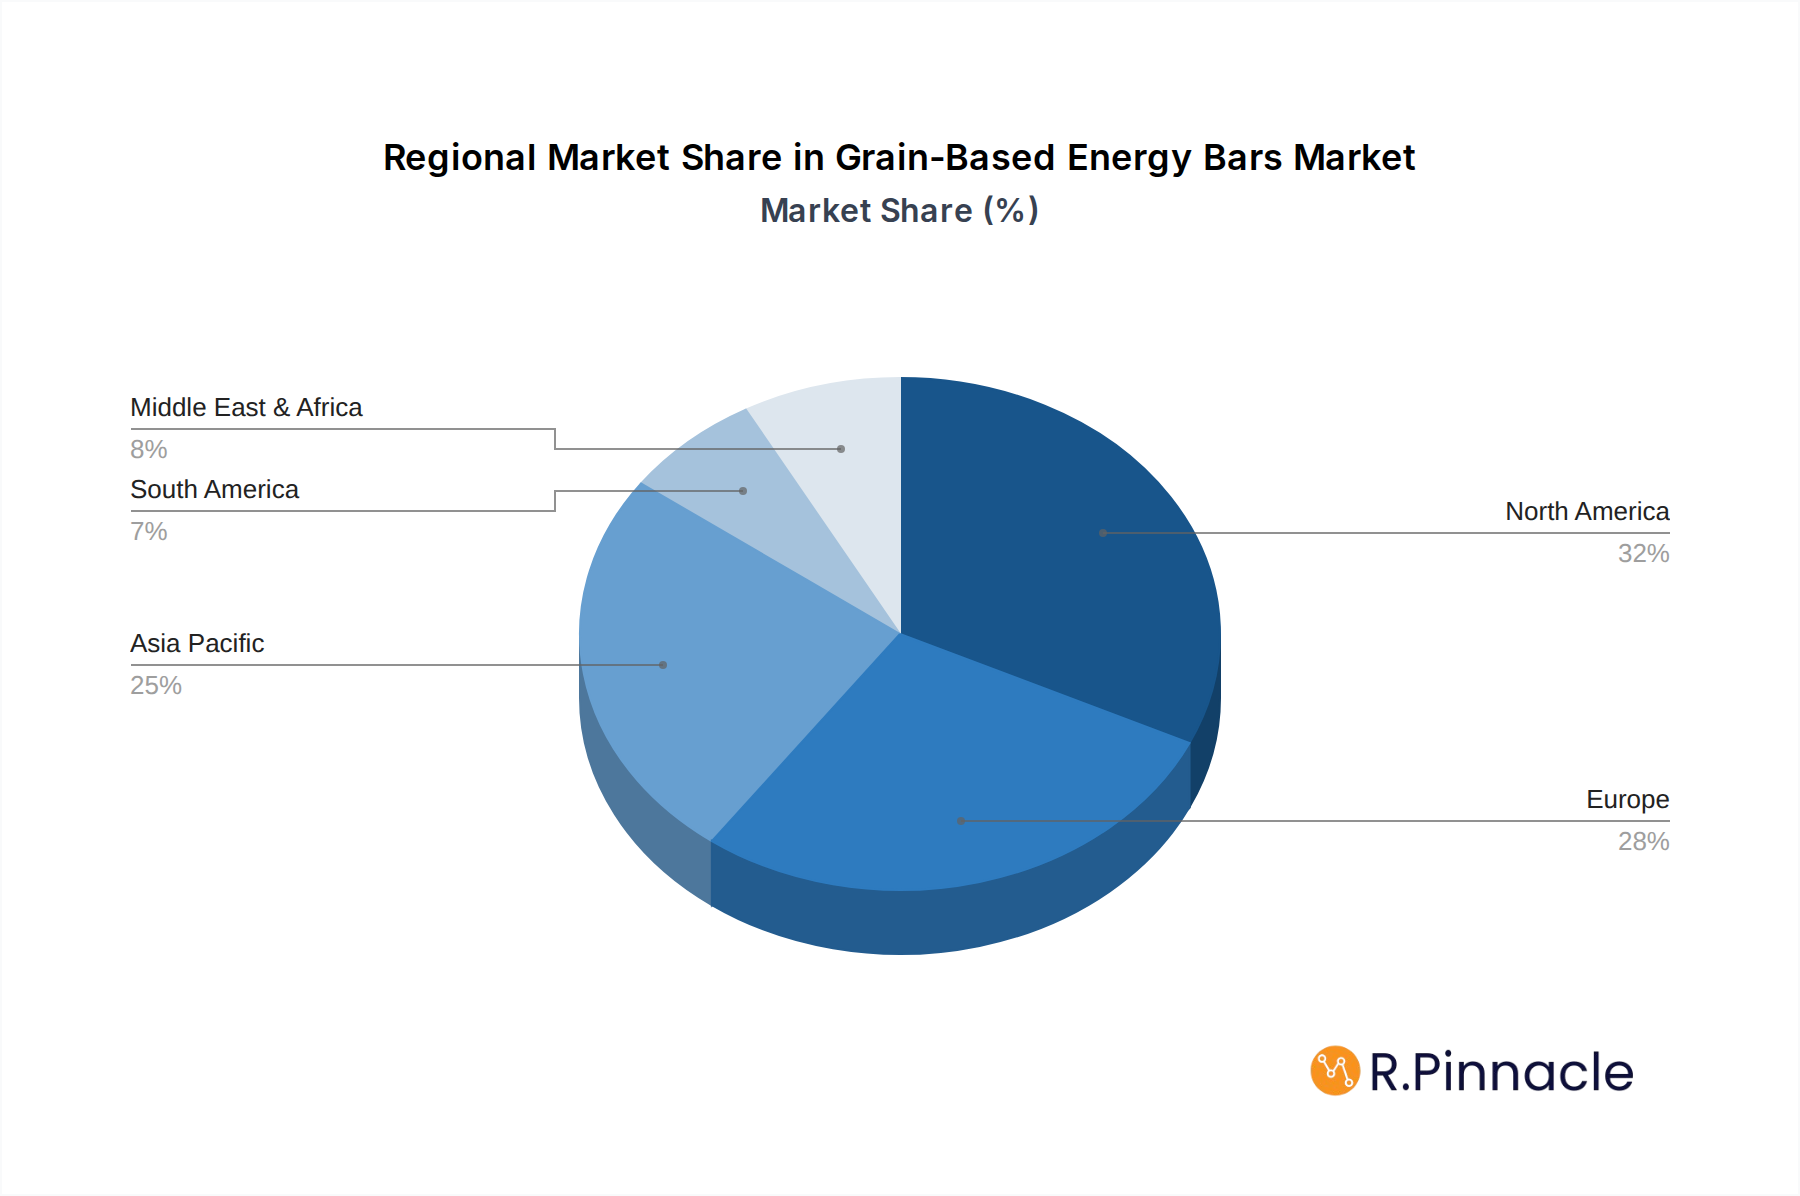
Dominant Regions & Segments in Grain-Based Energy Bars
North America currently dominates the grain-based energy bars market, primarily driven by the United States. This dominance is attributed to high disposable incomes, a strong health and wellness culture, and significant investment in marketing and product innovation by leading companies.
- Application: Offline Sales remains the leading sales channel, accounting for an estimated 65% of the market. Key drivers include widespread availability in supermarkets, convenience stores, and specialty health food stores. The in-store visibility and impulse purchase potential contribute significantly to this segment's strength.
- Application: Online Sales is experiencing rapid growth, projected to capture a substantial market share by 2033. Factors fueling this include the convenience of e-commerce, the availability of a wider product selection, and competitive pricing offered by online retailers. The increasing adoption of digital platforms by consumers across all demographics further accelerates this trend.
- Types: High Protein bars are a dominant category, catering to athletes and fitness enthusiasts seeking muscle recovery and satiety. The growing popularity of protein-centric diets and the clear labeling of protein content contribute to this segment's success.
- Types: High Fiber bars are also experiencing significant traction. Consumers are increasingly aware of the digestive health benefits of fiber, leading to a demand for products that support a healthy gut. This segment is expected to witness steady growth as awareness about dietary fiber's importance continues to rise.
- Types: Others encompasses a broad range of energy bars with specific functional benefits, such as those catering to vegan diets, gluten-free requirements, or containing specific adaptogens and superfoods. This segment represents a growing niche driven by specialized consumer needs and preferences.
Economic policies promoting healthy lifestyles and robust retail infrastructure in North America further solidify its leadership position.
Grain-Based Energy Bars Product Innovations
Product innovations in the grain-based energy bars sector are focused on enhancing nutritional profiles, diversifying flavor experiences, and catering to specific dietary needs. Manufacturers are increasingly incorporating ancient grains, seeds, nuts, and plant-based proteins to boost nutritional content and appeal to health-conscious consumers. The development of bars with lower sugar content, increased fiber, and functional ingredients like adaptogens and probiotics is a significant trend. These innovations offer competitive advantages by meeting evolving consumer demands for cleaner labels and targeted health benefits, ensuring market relevance and consumer appeal.
Grain-Based Energy Bars Market Scope & Segmentation Analysis
The market for grain-based energy bars is segmented by application and type. The application segment includes Online Sales and Offline Sales. Online sales, while smaller currently, exhibit a higher projected CAGR due to the convenience and accessibility of e-commerce platforms, with an estimated market size of over fifty billion dollars by 2033. Offline sales, comprising traditional retail channels, remain the dominant segment with a market size exceeding eighty billion dollars, driven by extensive distribution networks and impulse purchases.
The type segment encompasses High Protein, High Fiber, and Others. High Protein bars represent a significant portion of the market, valued at over sixty billion dollars, driven by their appeal to athletes and fitness enthusiasts. High Fiber bars are experiencing robust growth, with a projected market size of over forty billion dollars, fueled by increasing consumer awareness of digestive health benefits. The "Others" category, including bars for specific dietary needs like vegan or gluten-free, is also expanding, with an estimated market size of over thirty billion dollars, reflecting growing consumer demand for personalized nutrition.
Key Drivers of Grain-Based Energy Bars Growth
Several factors are propelling the growth of the grain-based energy bars market. The burgeoning health and wellness trend, with consumers actively seeking nutritious and convenient food options, is a primary driver. Increasing disposable incomes in emerging economies are also contributing to market expansion, allowing more consumers to afford premium health foods. Technological advancements in food processing and ingredient sourcing enable the creation of more appealing and functional energy bars. Furthermore, rising awareness of the benefits of a balanced diet and the role of snacks in maintaining energy levels significantly boost demand.
Challenges in the Grain-Based Energy Bars Sector
Despite robust growth, the grain-based energy bars sector faces several challenges. Intense competition from both established brands and new entrants can lead to price wars and pressure on profit margins. Evolving consumer preferences, such as a demand for increasingly clean labels and reduced sugar content, require continuous product innovation and reformulation, which can be costly. Supply chain disruptions, particularly for specialized ingredients, can impact production and availability. Furthermore, regulatory scrutiny concerning health claims and ingredient transparency can pose compliance challenges for manufacturers.
Emerging Opportunities in Grain-Based Energy Bars
Emerging opportunities within the grain-based energy bars market lie in catering to niche dietary needs and expanding into untapped geographical regions. The growing demand for plant-based, gluten-free, and allergen-friendly options presents significant growth potential. Furthermore, the integration of functional ingredients like adaptogens, probiotics, and nootropics can create premium products appealing to consumers seeking specific health benefits beyond basic energy provision. The expansion of e-commerce globally also opens up new avenues for direct-to-consumer sales and market penetration in regions with less developed retail infrastructure.
Leading Players in the Grain-Based Energy Bars Market
- KIND Snacks
- Clif Bar & Company
- RXBAR
- LÄRABAR
- GoMacro
- Bob’s Red Mill
- Quest Nutrition
- Zing Bars
- NuGo Nutrition
- General Mills
Key Developments in Grain-Based Energy Bars Industry
- 2024: KIND Snacks launched a new line of plant-based protein bars with ethically sourced ingredients.
- 2023: Clif Bar & Company announced its commitment to 100% renewable energy for its manufacturing operations.
- 2023: RXBAR expanded its product offering with a new range of savory energy bars.
- 2022: LÄRABAR introduced limited-edition seasonal flavors to capitalize on consumer demand for novel taste experiences.
- 2021: GoMacro partnered with a major sports nutrition retailer to increase its offline sales reach.
- 2020: General Mills acquired a significant stake in a growing organic snack company, indicating strategic market expansion.
Future Outlook for Grain-Based Energy Bars Market
The future outlook for the grain-based energy bars market is exceptionally bright, driven by sustained consumer demand for convenient, nutritious, and functional food options. The ongoing shift towards healthier lifestyles, coupled with an increasing awareness of the importance of dietary supplements and plant-based nutrition, will continue to fuel market expansion. Innovations in product formulation, including the incorporation of novel ingredients and the development of personalized nutrition solutions, will create new growth avenues. The expansion of e-commerce and direct-to-consumer channels will further democratize access and drive global market penetration, ensuring continued robust growth and profitability for the sector.
Grain-Based Energy Bars Segmentation
-
1. Application
- 1.1. Online Sales
- 1.2. Offline Sales
-
2. Types
- 2.1. High Protein
- 2.2. High Fiber
- 2.3. Others
Grain-Based Energy Bars Segmentation By Geography
-
1. North America
- 1.1. United States
- 1.2. Canada
- 1.3. Mexico
-
2. South America
- 2.1. Brazil
- 2.2. Argentina
- 2.3. Rest of South America
-
3. Europe
- 3.1. United Kingdom
- 3.2. Germany
- 3.3. France
- 3.4. Italy
- 3.5. Spain
- 3.6. Russia
- 3.7. Benelux
- 3.8. Nordics
- 3.9. Rest of Europe
-
4. Middle East & Africa
- 4.1. Turkey
- 4.2. Israel
- 4.3. GCC
- 4.4. North Africa
- 4.5. South Africa
- 4.6. Rest of Middle East & Africa
-
5. Asia Pacific
- 5.1. China
- 5.2. India
- 5.3. Japan
- 5.4. South Korea
- 5.5. ASEAN
- 5.6. Oceania
- 5.7. Rest of Asia Pacific
Grain-Based Energy Bars Regional Market Share
Geographic Coverage of Grain-Based Energy Bars
Grain-Based Energy Bars REPORT HIGHLIGHTS
| Aspects | Details |
|---|---|
| Study Period | 2020-2034 |
| Base Year | 2025 |
| Estimated Year | 2026 |
| Forecast Period | 2026-2034 |
| Historical Period | 2020-2025 |
| Growth Rate | CAGR of 5.6% from 2020-2034 |
| Segmentation |
|
Table of Contents
- 1. Introduction
- 1.1. Research Scope
- 1.2. Market Segmentation
- 1.3. Research Objective
- 1.4. Definitions and Assumptions
- 2. Executive Summary
- 2.1. Market Snapshot
- 3. Market Dynamics
- 3.1. Market Drivers
- 3.2. Market Restrains
- 3.3. Market Trends
- 3.4. Market Opportunities
- 4. Market Factor Analysis
- 4.1. Porters Five Forces
- 4.1.1. Bargaining Power of Suppliers
- 4.1.2. Bargaining Power of Buyers
- 4.1.3. Threat of New Entrants
- 4.1.4. Threat of Substitutes
- 4.1.5. Competitive Rivalry
- 4.2. PESTEL analysis
- 4.3. BCG Analysis
- 4.3.1. Stars (High Growth, High Market Share)
- 4.3.2. Cash Cows (Low Growth, High Market Share)
- 4.3.3. Question Mark (High Growth, Low Market Share)
- 4.3.4. Dogs (Low Growth, Low Market Share)
- 4.4. Ansoff Matrix Analysis
- 4.5. Supply Chain Analysis
- 4.6. Regulatory Landscape
- 4.7. Current Market Potential and Opportunity Assessment (TAM–SAM–SOM Framework)
- 4.8. PRI Analyst Note
- 4.1. Porters Five Forces
- 5. Market Analysis, Insights and Forecast 2021-2033
- 5.1. Market Analysis, Insights and Forecast - by Application
- 5.1.1. Online Sales
- 5.1.2. Offline Sales
- 5.2. Market Analysis, Insights and Forecast - by Types
- 5.2.1. High Protein
- 5.2.2. High Fiber
- 5.2.3. Others
- 5.3. Market Analysis, Insights and Forecast - by Region
- 5.3.1. North America
- 5.3.2. South America
- 5.3.3. Europe
- 5.3.4. Middle East & Africa
- 5.3.5. Asia Pacific
- 5.1. Market Analysis, Insights and Forecast - by Application
- 6. Global Grain-Based Energy Bars Analysis, Insights and Forecast, 2021-2033
- 6.1. Market Analysis, Insights and Forecast - by Application
- 6.1.1. Online Sales
- 6.1.2. Offline Sales
- 6.2. Market Analysis, Insights and Forecast - by Types
- 6.2.1. High Protein
- 6.2.2. High Fiber
- 6.2.3. Others
- 6.1. Market Analysis, Insights and Forecast - by Application
- 7. North America Grain-Based Energy Bars Analysis, Insights and Forecast, 2020-2032
- 7.1. Market Analysis, Insights and Forecast - by Application
- 7.1.1. Online Sales
- 7.1.2. Offline Sales
- 7.2. Market Analysis, Insights and Forecast - by Types
- 7.2.1. High Protein
- 7.2.2. High Fiber
- 7.2.3. Others
- 7.1. Market Analysis, Insights and Forecast - by Application
- 8. South America Grain-Based Energy Bars Analysis, Insights and Forecast, 2020-2032
- 8.1. Market Analysis, Insights and Forecast - by Application
- 8.1.1. Online Sales
- 8.1.2. Offline Sales
- 8.2. Market Analysis, Insights and Forecast - by Types
- 8.2.1. High Protein
- 8.2.2. High Fiber
- 8.2.3. Others
- 8.1. Market Analysis, Insights and Forecast - by Application
- 9. Europe Grain-Based Energy Bars Analysis, Insights and Forecast, 2020-2032
- 9.1. Market Analysis, Insights and Forecast - by Application
- 9.1.1. Online Sales
- 9.1.2. Offline Sales
- 9.2. Market Analysis, Insights and Forecast - by Types
- 9.2.1. High Protein
- 9.2.2. High Fiber
- 9.2.3. Others
- 9.1. Market Analysis, Insights and Forecast - by Application
- 10. Middle East & Africa Grain-Based Energy Bars Analysis, Insights and Forecast, 2020-2032
- 10.1. Market Analysis, Insights and Forecast - by Application
- 10.1.1. Online Sales
- 10.1.2. Offline Sales
- 10.2. Market Analysis, Insights and Forecast - by Types
- 10.2.1. High Protein
- 10.2.2. High Fiber
- 10.2.3. Others
- 10.1. Market Analysis, Insights and Forecast - by Application
- 11. Asia Pacific Grain-Based Energy Bars Analysis, Insights and Forecast, 2020-2032
- 11.1. Market Analysis, Insights and Forecast - by Application
- 11.1.1. Online Sales
- 11.1.2. Offline Sales
- 11.2. Market Analysis, Insights and Forecast - by Types
- 11.2.1. High Protein
- 11.2.2. High Fiber
- 11.2.3. Others
- 11.1. Market Analysis, Insights and Forecast - by Application
- 12. Competitive Analysis
- 12.1. Company Profiles
- 12.1.1 KIND Snacks
- 12.1.1.1. Company Overview
- 12.1.1.2. Products
- 12.1.1.3. Company Financials
- 12.1.1.4. SWOT Analysis
- 12.1.2 Clif Bar & Company
- 12.1.2.1. Company Overview
- 12.1.2.2. Products
- 12.1.2.3. Company Financials
- 12.1.2.4. SWOT Analysis
- 12.1.3 RXBAR
- 12.1.3.1. Company Overview
- 12.1.3.2. Products
- 12.1.3.3. Company Financials
- 12.1.3.4. SWOT Analysis
- 12.1.4 LÄRABAR
- 12.1.4.1. Company Overview
- 12.1.4.2. Products
- 12.1.4.3. Company Financials
- 12.1.4.4. SWOT Analysis
- 12.1.5 GoMacro
- 12.1.5.1. Company Overview
- 12.1.5.2. Products
- 12.1.5.3. Company Financials
- 12.1.5.4. SWOT Analysis
- 12.1.6 Bob’s Red Mill
- 12.1.6.1. Company Overview
- 12.1.6.2. Products
- 12.1.6.3. Company Financials
- 12.1.6.4. SWOT Analysis
- 12.1.7 Quest Nutrition
- 12.1.7.1. Company Overview
- 12.1.7.2. Products
- 12.1.7.3. Company Financials
- 12.1.7.4. SWOT Analysis
- 12.1.8 Zing Bars
- 12.1.8.1. Company Overview
- 12.1.8.2. Products
- 12.1.8.3. Company Financials
- 12.1.8.4. SWOT Analysis
- 12.1.9 NuGo Nutrition
- 12.1.9.1. Company Overview
- 12.1.9.2. Products
- 12.1.9.3. Company Financials
- 12.1.9.4. SWOT Analysis
- 12.1.10 General Mills
- 12.1.10.1. Company Overview
- 12.1.10.2. Products
- 12.1.10.3. Company Financials
- 12.1.10.4. SWOT Analysis
- 12.1.1 KIND Snacks
- 12.2. Market Entropy
- 12.2.1 Company's Key Areas Served
- 12.2.2 Recent Developments
- 12.3. Company Market Share Analysis 2025
- 12.3.1 Top 5 Companies Market Share Analysis
- 12.3.2 Top 3 Companies Market Share Analysis
- 12.4. List of Potential Customers
- 13. Research Methodology
List of Figures
- Figure 1: Global Grain-Based Energy Bars Revenue Breakdown (billion, %) by Region 2025 & 2033
- Figure 2: Global Grain-Based Energy Bars Volume Breakdown (K, %) by Region 2025 & 2033
- Figure 3: North America Grain-Based Energy Bars Revenue (billion), by Application 2025 & 2033
- Figure 4: North America Grain-Based Energy Bars Volume (K), by Application 2025 & 2033
- Figure 5: North America Grain-Based Energy Bars Revenue Share (%), by Application 2025 & 2033
- Figure 6: North America Grain-Based Energy Bars Volume Share (%), by Application 2025 & 2033
- Figure 7: North America Grain-Based Energy Bars Revenue (billion), by Types 2025 & 2033
- Figure 8: North America Grain-Based Energy Bars Volume (K), by Types 2025 & 2033
- Figure 9: North America Grain-Based Energy Bars Revenue Share (%), by Types 2025 & 2033
- Figure 10: North America Grain-Based Energy Bars Volume Share (%), by Types 2025 & 2033
- Figure 11: North America Grain-Based Energy Bars Revenue (billion), by Country 2025 & 2033
- Figure 12: North America Grain-Based Energy Bars Volume (K), by Country 2025 & 2033
- Figure 13: North America Grain-Based Energy Bars Revenue Share (%), by Country 2025 & 2033
- Figure 14: North America Grain-Based Energy Bars Volume Share (%), by Country 2025 & 2033
- Figure 15: South America Grain-Based Energy Bars Revenue (billion), by Application 2025 & 2033
- Figure 16: South America Grain-Based Energy Bars Volume (K), by Application 2025 & 2033
- Figure 17: South America Grain-Based Energy Bars Revenue Share (%), by Application 2025 & 2033
- Figure 18: South America Grain-Based Energy Bars Volume Share (%), by Application 2025 & 2033
- Figure 19: South America Grain-Based Energy Bars Revenue (billion), by Types 2025 & 2033
- Figure 20: South America Grain-Based Energy Bars Volume (K), by Types 2025 & 2033
- Figure 21: South America Grain-Based Energy Bars Revenue Share (%), by Types 2025 & 2033
- Figure 22: South America Grain-Based Energy Bars Volume Share (%), by Types 2025 & 2033
- Figure 23: South America Grain-Based Energy Bars Revenue (billion), by Country 2025 & 2033
- Figure 24: South America Grain-Based Energy Bars Volume (K), by Country 2025 & 2033
- Figure 25: South America Grain-Based Energy Bars Revenue Share (%), by Country 2025 & 2033
- Figure 26: South America Grain-Based Energy Bars Volume Share (%), by Country 2025 & 2033
- Figure 27: Europe Grain-Based Energy Bars Revenue (billion), by Application 2025 & 2033
- Figure 28: Europe Grain-Based Energy Bars Volume (K), by Application 2025 & 2033
- Figure 29: Europe Grain-Based Energy Bars Revenue Share (%), by Application 2025 & 2033
- Figure 30: Europe Grain-Based Energy Bars Volume Share (%), by Application 2025 & 2033
- Figure 31: Europe Grain-Based Energy Bars Revenue (billion), by Types 2025 & 2033
- Figure 32: Europe Grain-Based Energy Bars Volume (K), by Types 2025 & 2033
- Figure 33: Europe Grain-Based Energy Bars Revenue Share (%), by Types 2025 & 2033
- Figure 34: Europe Grain-Based Energy Bars Volume Share (%), by Types 2025 & 2033
- Figure 35: Europe Grain-Based Energy Bars Revenue (billion), by Country 2025 & 2033
- Figure 36: Europe Grain-Based Energy Bars Volume (K), by Country 2025 & 2033
- Figure 37: Europe Grain-Based Energy Bars Revenue Share (%), by Country 2025 & 2033
- Figure 38: Europe Grain-Based Energy Bars Volume Share (%), by Country 2025 & 2033
- Figure 39: Middle East & Africa Grain-Based Energy Bars Revenue (billion), by Application 2025 & 2033
- Figure 40: Middle East & Africa Grain-Based Energy Bars Volume (K), by Application 2025 & 2033
- Figure 41: Middle East & Africa Grain-Based Energy Bars Revenue Share (%), by Application 2025 & 2033
- Figure 42: Middle East & Africa Grain-Based Energy Bars Volume Share (%), by Application 2025 & 2033
- Figure 43: Middle East & Africa Grain-Based Energy Bars Revenue (billion), by Types 2025 & 2033
- Figure 44: Middle East & Africa Grain-Based Energy Bars Volume (K), by Types 2025 & 2033
- Figure 45: Middle East & Africa Grain-Based Energy Bars Revenue Share (%), by Types 2025 & 2033
- Figure 46: Middle East & Africa Grain-Based Energy Bars Volume Share (%), by Types 2025 & 2033
- Figure 47: Middle East & Africa Grain-Based Energy Bars Revenue (billion), by Country 2025 & 2033
- Figure 48: Middle East & Africa Grain-Based Energy Bars Volume (K), by Country 2025 & 2033
- Figure 49: Middle East & Africa Grain-Based Energy Bars Revenue Share (%), by Country 2025 & 2033
- Figure 50: Middle East & Africa Grain-Based Energy Bars Volume Share (%), by Country 2025 & 2033
- Figure 51: Asia Pacific Grain-Based Energy Bars Revenue (billion), by Application 2025 & 2033
- Figure 52: Asia Pacific Grain-Based Energy Bars Volume (K), by Application 2025 & 2033
- Figure 53: Asia Pacific Grain-Based Energy Bars Revenue Share (%), by Application 2025 & 2033
- Figure 54: Asia Pacific Grain-Based Energy Bars Volume Share (%), by Application 2025 & 2033
- Figure 55: Asia Pacific Grain-Based Energy Bars Revenue (billion), by Types 2025 & 2033
- Figure 56: Asia Pacific Grain-Based Energy Bars Volume (K), by Types 2025 & 2033
- Figure 57: Asia Pacific Grain-Based Energy Bars Revenue Share (%), by Types 2025 & 2033
- Figure 58: Asia Pacific Grain-Based Energy Bars Volume Share (%), by Types 2025 & 2033
- Figure 59: Asia Pacific Grain-Based Energy Bars Revenue (billion), by Country 2025 & 2033
- Figure 60: Asia Pacific Grain-Based Energy Bars Volume (K), by Country 2025 & 2033
- Figure 61: Asia Pacific Grain-Based Energy Bars Revenue Share (%), by Country 2025 & 2033
- Figure 62: Asia Pacific Grain-Based Energy Bars Volume Share (%), by Country 2025 & 2033
List of Tables
- Table 1: Global Grain-Based Energy Bars Revenue billion Forecast, by Application 2020 & 2033
- Table 2: Global Grain-Based Energy Bars Volume K Forecast, by Application 2020 & 2033
- Table 3: Global Grain-Based Energy Bars Revenue billion Forecast, by Types 2020 & 2033
- Table 4: Global Grain-Based Energy Bars Volume K Forecast, by Types 2020 & 2033
- Table 5: Global Grain-Based Energy Bars Revenue billion Forecast, by Region 2020 & 2033
- Table 6: Global Grain-Based Energy Bars Volume K Forecast, by Region 2020 & 2033
- Table 7: Global Grain-Based Energy Bars Revenue billion Forecast, by Application 2020 & 2033
- Table 8: Global Grain-Based Energy Bars Volume K Forecast, by Application 2020 & 2033
- Table 9: Global Grain-Based Energy Bars Revenue billion Forecast, by Types 2020 & 2033
- Table 10: Global Grain-Based Energy Bars Volume K Forecast, by Types 2020 & 2033
- Table 11: Global Grain-Based Energy Bars Revenue billion Forecast, by Country 2020 & 2033
- Table 12: Global Grain-Based Energy Bars Volume K Forecast, by Country 2020 & 2033
- Table 13: United States Grain-Based Energy Bars Revenue (billion) Forecast, by Application 2020 & 2033
- Table 14: United States Grain-Based Energy Bars Volume (K) Forecast, by Application 2020 & 2033
- Table 15: Canada Grain-Based Energy Bars Revenue (billion) Forecast, by Application 2020 & 2033
- Table 16: Canada Grain-Based Energy Bars Volume (K) Forecast, by Application 2020 & 2033
- Table 17: Mexico Grain-Based Energy Bars Revenue (billion) Forecast, by Application 2020 & 2033
- Table 18: Mexico Grain-Based Energy Bars Volume (K) Forecast, by Application 2020 & 2033
- Table 19: Global Grain-Based Energy Bars Revenue billion Forecast, by Application 2020 & 2033
- Table 20: Global Grain-Based Energy Bars Volume K Forecast, by Application 2020 & 2033
- Table 21: Global Grain-Based Energy Bars Revenue billion Forecast, by Types 2020 & 2033
- Table 22: Global Grain-Based Energy Bars Volume K Forecast, by Types 2020 & 2033
- Table 23: Global Grain-Based Energy Bars Revenue billion Forecast, by Country 2020 & 2033
- Table 24: Global Grain-Based Energy Bars Volume K Forecast, by Country 2020 & 2033
- Table 25: Brazil Grain-Based Energy Bars Revenue (billion) Forecast, by Application 2020 & 2033
- Table 26: Brazil Grain-Based Energy Bars Volume (K) Forecast, by Application 2020 & 2033
- Table 27: Argentina Grain-Based Energy Bars Revenue (billion) Forecast, by Application 2020 & 2033
- Table 28: Argentina Grain-Based Energy Bars Volume (K) Forecast, by Application 2020 & 2033
- Table 29: Rest of South America Grain-Based Energy Bars Revenue (billion) Forecast, by Application 2020 & 2033
- Table 30: Rest of South America Grain-Based Energy Bars Volume (K) Forecast, by Application 2020 & 2033
- Table 31: Global Grain-Based Energy Bars Revenue billion Forecast, by Application 2020 & 2033
- Table 32: Global Grain-Based Energy Bars Volume K Forecast, by Application 2020 & 2033
- Table 33: Global Grain-Based Energy Bars Revenue billion Forecast, by Types 2020 & 2033
- Table 34: Global Grain-Based Energy Bars Volume K Forecast, by Types 2020 & 2033
- Table 35: Global Grain-Based Energy Bars Revenue billion Forecast, by Country 2020 & 2033
- Table 36: Global Grain-Based Energy Bars Volume K Forecast, by Country 2020 & 2033
- Table 37: United Kingdom Grain-Based Energy Bars Revenue (billion) Forecast, by Application 2020 & 2033
- Table 38: United Kingdom Grain-Based Energy Bars Volume (K) Forecast, by Application 2020 & 2033
- Table 39: Germany Grain-Based Energy Bars Revenue (billion) Forecast, by Application 2020 & 2033
- Table 40: Germany Grain-Based Energy Bars Volume (K) Forecast, by Application 2020 & 2033
- Table 41: France Grain-Based Energy Bars Revenue (billion) Forecast, by Application 2020 & 2033
- Table 42: France Grain-Based Energy Bars Volume (K) Forecast, by Application 2020 & 2033
- Table 43: Italy Grain-Based Energy Bars Revenue (billion) Forecast, by Application 2020 & 2033
- Table 44: Italy Grain-Based Energy Bars Volume (K) Forecast, by Application 2020 & 2033
- Table 45: Spain Grain-Based Energy Bars Revenue (billion) Forecast, by Application 2020 & 2033
- Table 46: Spain Grain-Based Energy Bars Volume (K) Forecast, by Application 2020 & 2033
- Table 47: Russia Grain-Based Energy Bars Revenue (billion) Forecast, by Application 2020 & 2033
- Table 48: Russia Grain-Based Energy Bars Volume (K) Forecast, by Application 2020 & 2033
- Table 49: Benelux Grain-Based Energy Bars Revenue (billion) Forecast, by Application 2020 & 2033
- Table 50: Benelux Grain-Based Energy Bars Volume (K) Forecast, by Application 2020 & 2033
- Table 51: Nordics Grain-Based Energy Bars Revenue (billion) Forecast, by Application 2020 & 2033
- Table 52: Nordics Grain-Based Energy Bars Volume (K) Forecast, by Application 2020 & 2033
- Table 53: Rest of Europe Grain-Based Energy Bars Revenue (billion) Forecast, by Application 2020 & 2033
- Table 54: Rest of Europe Grain-Based Energy Bars Volume (K) Forecast, by Application 2020 & 2033
- Table 55: Global Grain-Based Energy Bars Revenue billion Forecast, by Application 2020 & 2033
- Table 56: Global Grain-Based Energy Bars Volume K Forecast, by Application 2020 & 2033
- Table 57: Global Grain-Based Energy Bars Revenue billion Forecast, by Types 2020 & 2033
- Table 58: Global Grain-Based Energy Bars Volume K Forecast, by Types 2020 & 2033
- Table 59: Global Grain-Based Energy Bars Revenue billion Forecast, by Country 2020 & 2033
- Table 60: Global Grain-Based Energy Bars Volume K Forecast, by Country 2020 & 2033
- Table 61: Turkey Grain-Based Energy Bars Revenue (billion) Forecast, by Application 2020 & 2033
- Table 62: Turkey Grain-Based Energy Bars Volume (K) Forecast, by Application 2020 & 2033
- Table 63: Israel Grain-Based Energy Bars Revenue (billion) Forecast, by Application 2020 & 2033
- Table 64: Israel Grain-Based Energy Bars Volume (K) Forecast, by Application 2020 & 2033
- Table 65: GCC Grain-Based Energy Bars Revenue (billion) Forecast, by Application 2020 & 2033
- Table 66: GCC Grain-Based Energy Bars Volume (K) Forecast, by Application 2020 & 2033
- Table 67: North Africa Grain-Based Energy Bars Revenue (billion) Forecast, by Application 2020 & 2033
- Table 68: North Africa Grain-Based Energy Bars Volume (K) Forecast, by Application 2020 & 2033
- Table 69: South Africa Grain-Based Energy Bars Revenue (billion) Forecast, by Application 2020 & 2033
- Table 70: South Africa Grain-Based Energy Bars Volume (K) Forecast, by Application 2020 & 2033
- Table 71: Rest of Middle East & Africa Grain-Based Energy Bars Revenue (billion) Forecast, by Application 2020 & 2033
- Table 72: Rest of Middle East & Africa Grain-Based Energy Bars Volume (K) Forecast, by Application 2020 & 2033
- Table 73: Global Grain-Based Energy Bars Revenue billion Forecast, by Application 2020 & 2033
- Table 74: Global Grain-Based Energy Bars Volume K Forecast, by Application 2020 & 2033
- Table 75: Global Grain-Based Energy Bars Revenue billion Forecast, by Types 2020 & 2033
- Table 76: Global Grain-Based Energy Bars Volume K Forecast, by Types 2020 & 2033
- Table 77: Global Grain-Based Energy Bars Revenue billion Forecast, by Country 2020 & 2033
- Table 78: Global Grain-Based Energy Bars Volume K Forecast, by Country 2020 & 2033
- Table 79: China Grain-Based Energy Bars Revenue (billion) Forecast, by Application 2020 & 2033
- Table 80: China Grain-Based Energy Bars Volume (K) Forecast, by Application 2020 & 2033
- Table 81: India Grain-Based Energy Bars Revenue (billion) Forecast, by Application 2020 & 2033
- Table 82: India Grain-Based Energy Bars Volume (K) Forecast, by Application 2020 & 2033
- Table 83: Japan Grain-Based Energy Bars Revenue (billion) Forecast, by Application 2020 & 2033
- Table 84: Japan Grain-Based Energy Bars Volume (K) Forecast, by Application 2020 & 2033
- Table 85: South Korea Grain-Based Energy Bars Revenue (billion) Forecast, by Application 2020 & 2033
- Table 86: South Korea Grain-Based Energy Bars Volume (K) Forecast, by Application 2020 & 2033
- Table 87: ASEAN Grain-Based Energy Bars Revenue (billion) Forecast, by Application 2020 & 2033
- Table 88: ASEAN Grain-Based Energy Bars Volume (K) Forecast, by Application 2020 & 2033
- Table 89: Oceania Grain-Based Energy Bars Revenue (billion) Forecast, by Application 2020 & 2033
- Table 90: Oceania Grain-Based Energy Bars Volume (K) Forecast, by Application 2020 & 2033
- Table 91: Rest of Asia Pacific Grain-Based Energy Bars Revenue (billion) Forecast, by Application 2020 & 2033
- Table 92: Rest of Asia Pacific Grain-Based Energy Bars Volume (K) Forecast, by Application 2020 & 2033
Frequently Asked Questions
1. What is the projected Compound Annual Growth Rate (CAGR) of the Grain-Based Energy Bars?
The projected CAGR is approximately 5.6%.
2. Which companies are prominent players in the Grain-Based Energy Bars?
Key companies in the market include KIND Snacks, Clif Bar & Company, RXBAR, LÄRABAR, GoMacro, Bob’s Red Mill, Quest Nutrition, Zing Bars, NuGo Nutrition, General Mills.
3. What are the main segments of the Grain-Based Energy Bars?
The market segments include Application, Types.
4. Can you provide details about the market size?
The market size is estimated to be USD 3.9 billion as of 2022.
5. What are some drivers contributing to market growth?
N/A
6. What are the notable trends driving market growth?
N/A
7. Are there any restraints impacting market growth?
N/A
8. Can you provide examples of recent developments in the market?
N/A
9. What pricing options are available for accessing the report?
Pricing options include single-user, multi-user, and enterprise licenses priced at USD 3950.00, USD 5925.00, and USD 7900.00 respectively.
10. Is the market size provided in terms of value or volume?
The market size is provided in terms of value, measured in billion and volume, measured in K.
11. Are there any specific market keywords associated with the report?
Yes, the market keyword associated with the report is "Grain-Based Energy Bars," which aids in identifying and referencing the specific market segment covered.
12. How do I determine which pricing option suits my needs best?
The pricing options vary based on user requirements and access needs. Individual users may opt for single-user licenses, while businesses requiring broader access may choose multi-user or enterprise licenses for cost-effective access to the report.
13. Are there any additional resources or data provided in the Grain-Based Energy Bars report?
While the report offers comprehensive insights, it's advisable to review the specific contents or supplementary materials provided to ascertain if additional resources or data are available.
14. How can I stay updated on further developments or reports in the Grain-Based Energy Bars?
To stay informed about further developments, trends, and reports in the Grain-Based Energy Bars, consider subscribing to industry newsletters, following relevant companies and organizations, or regularly checking reputable industry news sources and publications.
Methodology
Step 1 - Identification of Relevant Samples Size from Population Database


Step 2 - Approaches for Defining Global Market Size (Value, Volume* & Price*)

Note*: In applicable scenarios
Step 3 - Data Sources
Primary Research
- Web Analytics
- Survey Reports
- Research Institute
- Latest Research Reports
- Opinion Leaders
Secondary Research
- Annual Reports
- White Paper
- Latest Press Release
- Industry Association
- Paid Database
- Investor Presentations

Step 4 - Data Triangulation
Involves using different sources of information in order to increase the validity of a study
These sources are likely to be stakeholders in a program - participants, other researchers, program staff, other community members, and so on.
Then we put all data in single framework & apply various statistical tools to find out the dynamic on the market.
During the analysis stage, feedback from the stakeholder groups would be compared to determine areas of agreement as well as areas of divergence

