

Key Insights
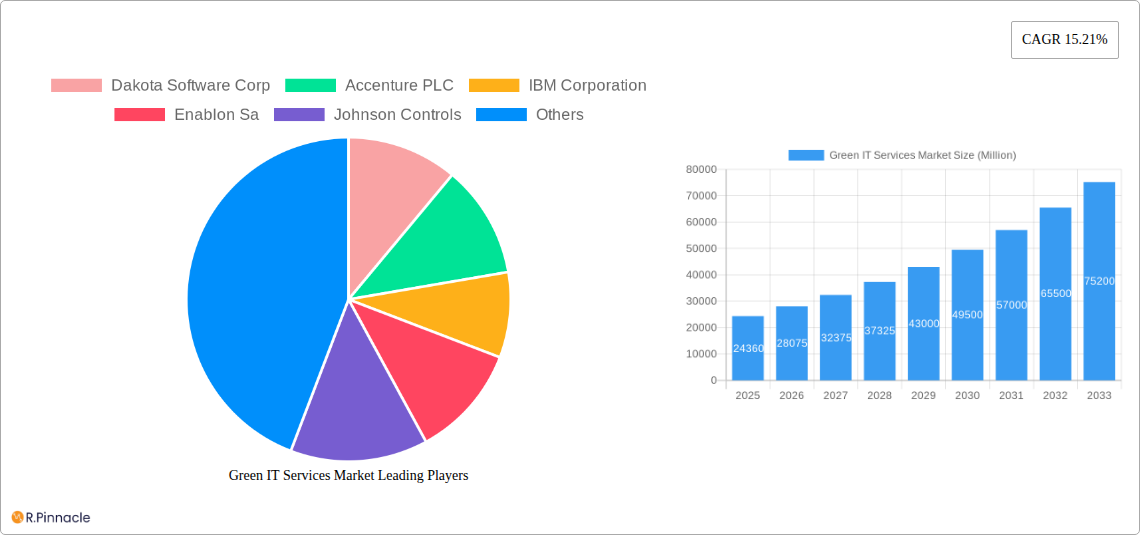
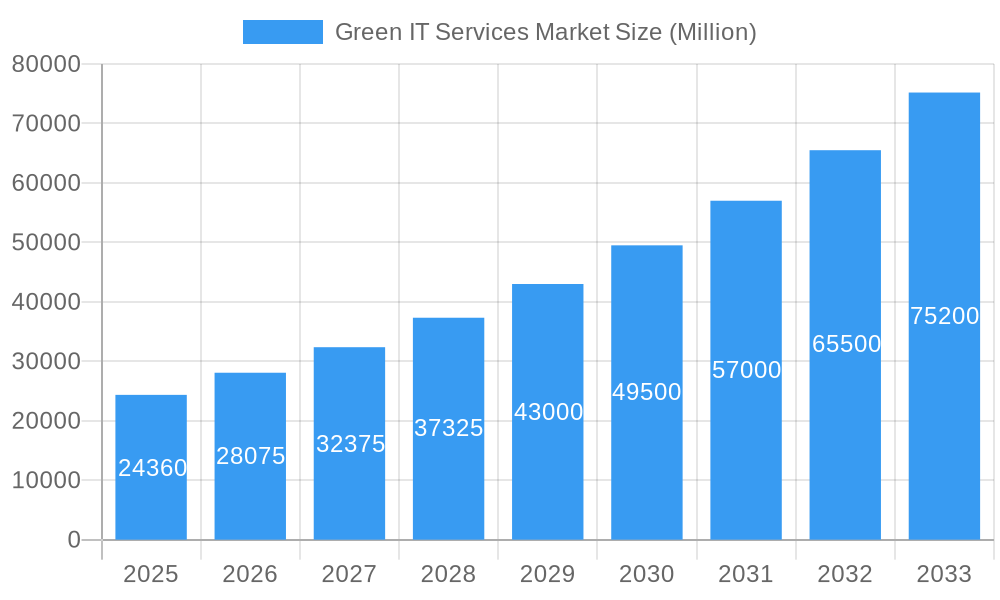
The Green IT Services market is poised for substantial growth, with an estimated market size of $24.36 billion in 2025. This upward trajectory is driven by a compelling compound annual growth rate (CAGR) of 15.21% during the forecast period of 2025-2033. This robust expansion is fueled by an increasing global imperative for sustainability, stringent environmental regulations, and a growing awareness among businesses about the economic and reputational benefits of adopting eco-friendly IT practices. Key drivers include the escalating demand for energy-efficient data centers, cloud computing solutions optimized for reduced carbon footprints, and the widespread adoption of circular economy principles within the IT hardware lifecycle. The market is also benefiting from advancements in green technology, such as renewable energy integration for IT infrastructure and innovative waste management solutions for electronic equipment.
Green IT Services Market Market Size (In Billion)
The market segmentation highlights the diverse applications and adoption patterns within the Green IT Services landscape. The Software segment is expected to witness significant adoption as organizations seek solutions for energy monitoring, carbon accounting, and IT asset lifecycle management. Services, encompassing consulting, implementation, and managed services, will also play a crucial role in guiding businesses towards sustainable IT transformations. Geographically, North America and Europe are anticipated to lead market adoption due to established environmental policies and a proactive corporate sustainability culture. However, the Asia Pacific region is emerging as a high-growth market, driven by rapid digital transformation and increasing government initiatives to promote green technologies. Key players are actively investing in research and development to offer innovative solutions addressing the evolving needs for eco-conscious IT operations and compliance with environmental standards.
Green IT Services Market Company Market Share
This comprehensive report delves into the burgeoning Green IT Services market, offering in-depth analysis and actionable insights for industry stakeholders. Covering the period from 2019 to 2033, with a base and estimated year of 2025, this study examines market dynamics, segmentation, key players, and future trends. The Green IT Services market is driven by increasing environmental consciousness, stringent regulations, and the growing adoption of sustainable computing practices across various industries. With a projected market size of XX Million by 2033, this report is an essential guide for navigating the evolving landscape of eco-friendly IT solutions.
Green IT Services Market Market Structure & Innovation Trends
The Green IT Services market exhibits a moderately concentrated structure, with leading players actively engaging in innovation to capture market share. Key drivers of innovation include the imperative to reduce carbon footprints, enhance energy efficiency in data centers, and comply with evolving environmental regulations. The market is characterized by a continuous stream of new software solutions and service offerings designed to optimize resource utilization and minimize e-waste. Regulatory frameworks, such as government mandates for energy-efficient IT equipment and carbon emission reporting, significantly influence market development. Product substitutes are emerging, primarily in the form of on-premise solutions being replaced by cloud-based services that can offer greater energy efficiency and scalability. End-user demographics are shifting towards organizations with strong Corporate Social Responsibility (CSR) initiatives and those in sectors heavily impacted by environmental concerns, such as IT and Telecom, and Industrial. Mergers and acquisitions (M&A) activities are anticipated to play a crucial role in market consolidation, with estimated M&A deal values reaching XX Million.
- Market Concentration: Moderately concentrated, with a few key players holding significant market share.
- Innovation Drivers: Carbon footprint reduction, energy efficiency, regulatory compliance, circular economy principles.
- Regulatory Frameworks: Government mandates, environmental certifications, carbon tax policies.
- Product Substitutes: Cloud computing services, energy-efficient hardware, managed IT services.
- End-User Demographics: Growing adoption by environmentally conscious organizations and sectors with high energy consumption.
- M&A Activities: Expected to increase for market consolidation and technology acquisition.
Green IT Services Market Market Dynamics & Trends
The Green IT Services market is experiencing robust growth, driven by a confluence of factors that underscore the urgent need for sustainable IT practices. The global push towards net-zero emissions and the increasing awareness of climate change are compelling organizations across all sectors to re-evaluate their IT infrastructure's environmental impact. Technological advancements in areas such as energy-efficient data center designs, renewable energy integration for IT operations, and sophisticated software for monitoring and managing energy consumption are fueling this growth. Consumer preferences are increasingly leaning towards businesses that demonstrate a commitment to environmental sustainability, making Green IT a competitive differentiator.
The market penetration of Green IT Services is steadily rising, with organizations recognizing the long-term cost savings associated with reduced energy consumption and waste. The compound annual growth rate (CAGR) for this market is projected to be substantial, estimated at XX% during the forecast period. This growth is further propelled by the development of innovative solutions that address critical environmental challenges within the IT lifecycle, from hardware manufacturing and deployment to data storage and disposal. The competitive dynamics are intensifying, with established IT giants and specialized Green IT providers vying for market leadership. This competitive landscape fosters continuous innovation and drives the development of more comprehensive and cost-effective Green IT solutions. The transition to hybrid and multi-cloud environments also presents opportunities for optimizing energy usage across distributed IT resources. Furthermore, the circular economy principles are gaining traction, encouraging the refurbishment, reuse, and recycling of IT equipment, thereby minimizing e-waste and resource depletion. The evolving regulatory landscape, with stricter environmental standards and carbon reporting requirements, is also a significant catalyst for market expansion.
Dominant Regions & Segments in Green IT Services Market
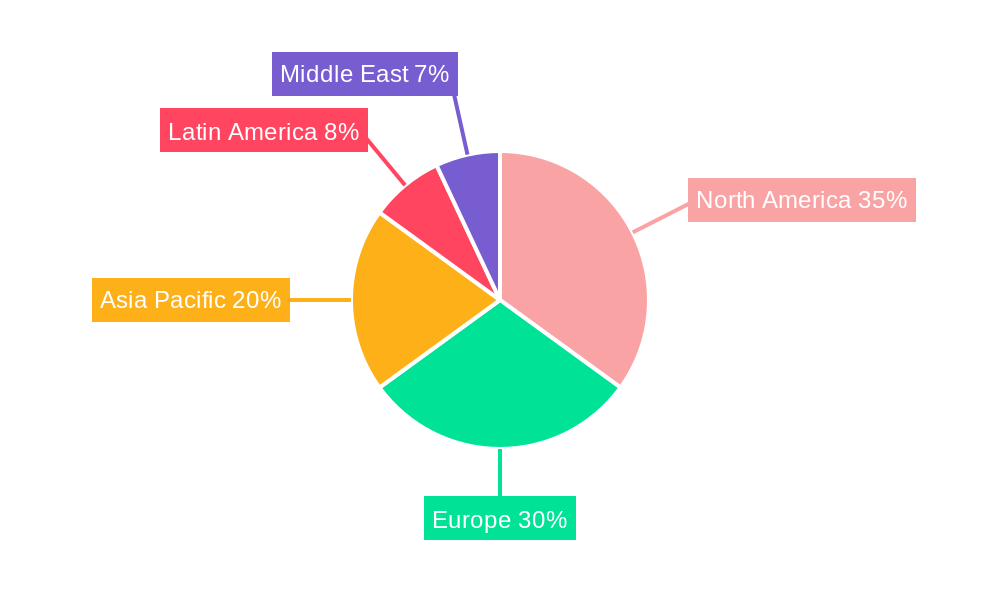
The Green IT Services market demonstrates significant regional variations and segment dominance, largely influenced by economic development, regulatory intensity, and technological adoption rates. North America, particularly the United States, is a leading region due to its strong emphasis on technological innovation, proactive environmental policies, and the presence of a large number of environmentally conscious corporations. Europe, with its stringent environmental regulations and commitment to sustainability, also holds a substantial market share.
Within the segmentation by Type, the Services segment is expected to exhibit higher growth and dominance. This is attributed to the increasing demand for consulting, implementation, and management services that help organizations transition to greener IT practices. This includes energy audits, IT asset management, cloud migration services for sustainability, and carbon footprint assessment. The Software segment is also crucial, providing tools for monitoring energy consumption, optimizing data center operations, and managing IT asset lifecycles for environmental compliance.
In terms of End-user Verticals, the IT and Telecom sector is a major driver due to its high energy consumption and significant potential for optimization. The Government sector is also a key player, driven by mandates for sustainable public infrastructure and procurement policies. The Industrial sector is increasingly adopting Green IT solutions to reduce operational costs and meet environmental compliance. BFSI (Banking, Financial Services, and Insurance) and Healthcare sectors are also showing growing interest as they aim to enhance their sustainability profiles and operational efficiency.
- Leading Region: North America (driven by US) and Europe (driven by stringent regulations).
- Dominant Segment (Type): Services, due to the demand for expert guidance and implementation.
- Key Drivers for Services Dominance: Energy audits, carbon footprint assessment, cloud migration for sustainability, IT asset lifecycle management.
- Dominant Segment (End-user Vertical): IT and Telecom (high energy consumption), Government (policy-driven adoption).
- Emerging Verticals: Industrial, BFSI, Healthcare, driven by cost savings and CSR initiatives.
- Economic Policies & Infrastructure: Strong government incentives and investments in sustainable infrastructure contribute to regional dominance.
Green IT Services Market Product Innovations
Product innovations in the Green IT Services market are primarily focused on enhancing energy efficiency, reducing waste, and improving the environmental lifecycle of IT assets. Advancements include intelligent energy management software for data centers that dynamically adjusts power consumption based on workload, thereby significantly reducing electricity usage. Hardware innovations are centered around the development of more energy-efficient servers, storage devices, and networking equipment. Furthermore, solutions that facilitate the refurbishment, resale, and responsible recycling of IT hardware are gaining traction, contributing to a circular economy for electronics. These innovations offer competitive advantages by lowering operational costs, meeting regulatory requirements, and enhancing brand reputation for sustainability.
Report Scope & Segmentation Analysis
This report meticulously analyzes the Green IT Services market across its key segmentations to provide granular insights. The Type segmentation includes Software and Services, each offering unique value propositions in promoting IT sustainability. The Services segment is projected to experience a CAGR of XX%, reaching an estimated market size of XX Million by 2033, driven by consulting and managed solutions. The Software segment, with a projected CAGR of XX% and a market size of XX Million, focuses on enabling monitoring, optimization, and compliance.
The End-user Vertical segmentation encompasses Government, BFSI, IT and Telecom, Industrial, Healthcare, and Other End-user Verticals. The IT and Telecom vertical is expected to lead the market, with a projected market size of XX Million by 2033, due to its high energy footprint. The Government sector, with a market size of XX Million, is driven by policy mandates and public sector sustainability initiatives.
Key Drivers of Green IT Services Market Growth
The Green IT Services market is propelled by several interconnected drivers. Foremost among these is the increasing global emphasis on environmental sustainability and the urgent need to mitigate climate change, leading to stricter regulations and corporate social responsibility mandates. Technological advancements in energy-efficient hardware and software solutions play a pivotal role, enabling organizations to reduce their carbon footprint and operational costs. Economic factors, such as rising energy prices and the potential for significant cost savings through optimized IT resource utilization, further accelerate adoption. Furthermore, growing consumer and investor demand for environmentally conscious businesses is compelling organizations to invest in Green IT.
- Environmental Regulations: Government policies, carbon emission targets, and environmental compliance requirements.
- Technological Advancements: Development of energy-efficient hardware, intelligent software for resource management, and renewable energy integration.
- Economic Benefits: Reduced operational costs through energy savings and optimized resource allocation.
- Corporate Social Responsibility (CSR): Growing pressure from stakeholders and consumers for sustainable business practices.
Challenges in the Green IT Services Market Sector
Despite its strong growth trajectory, the Green IT Services market faces several challenges. One significant barrier is the initial cost of implementing green IT solutions, which can be perceived as a substantial investment by some organizations, particularly small and medium-sized enterprises. The lack of standardized metrics and reporting frameworks for Green IT can also create confusion and hinder widespread adoption. Supply chain complexities, especially in sourcing sustainable IT hardware and managing e-waste responsibly, pose another challenge. Furthermore, the rapid pace of technological change can lead to premature obsolescence of IT equipment, exacerbating e-waste concerns if not managed effectively. Competitive pressures from traditional IT providers who may not prioritize sustainability can also slow down the market's expansion.
Emerging Opportunities in Green IT Services Market
The Green IT Services market is ripe with emerging opportunities. The increasing adoption of cloud computing presents a significant avenue for growth, as cloud providers are increasingly investing in renewable energy and energy-efficient data centers, offering a greener IT infrastructure to their clients. The rise of the Internet of Things (IoT) and edge computing necessitates the development of energy-efficient solutions for distributed devices and local data processing. Furthermore, the growing focus on the circular economy for electronics is creating opportunities in areas such as IT asset refurbishment, resale, and advanced recycling technologies. The development of AI-powered solutions for optimizing energy consumption in IT operations and predictive maintenance to extend hardware lifespan also represents a promising growth area.
Leading Players in the Green IT Services Market Market
- Dakota Software Corp
- Accenture PLC
- IBM Corporation
- Enablon Sa
- Johnson Controls
- Schneider Electric SE
- Accuvio Sustainability Software
- Enviance Inc
- SAP SE
Key Developments in Green IT Services Market Industry
- April 2022: Huawei proposed the "Green and Low Carbon" concept at the Huawei Global Analyst Summit (HAS) 2022 for its Huawei CloudFabric 3.0 Hyper-Converged Data Center Network (DCN) Solution. This initiative aims to utilize lossless networks to improve computing efficiency, reduce computing footprint, and embrace green computing, demonstrating a commitment to sustainable data center infrastructure.
- February 2022: Super Micro Computer, Inc. (SMCI), a leader in high-performance computing, storage, networking solutions, and green computing technology, unveiled a new short-depth multi-node system. This system is specifically designed and optimized for 5G, IoT, and Edge applications, addressing environments requiring high-density computing and I/O in compact or field locations, thus promoting energy-efficient edge computing.
Future Outlook for Green IT Services Market Market
The future outlook for the Green IT Services market is exceptionally positive, driven by a sustained global commitment to environmental sustainability and technological innovation. As regulatory frameworks become more stringent and organizations increasingly recognize the financial and reputational benefits of eco-friendly IT practices, demand for Green IT solutions will continue to surge. The expansion of cloud infrastructure, coupled with advancements in AI and machine learning for energy optimization, will create new avenues for efficiency. The growing emphasis on the circular economy will also drive growth in services related to IT asset lifecycle management, refurbishment, and responsible disposal. Strategic opportunities lie in developing integrated Green IT solutions that address the entire IT lifecycle, from hardware procurement and deployment to data management and end-of-life processing, positioning the market for continued expansion and impact.
Green IT Services Market Segmentation
-
1. Type
- 1.1. Software
- 1.2. Services
-
2. End-user Vertical
- 2.1. Government
- 2.2. BFSI
- 2.3. IT and Telecom
- 2.4. Industrial
- 2.5. Healthcare
- 2.6. Other End-user Verticals
Green IT Services Market Segmentation By Geography
- 1. North America
- 2. Europe
- 3. Asia Pacific
- 4. Latin America
- 5. Middle East
Green IT Services Market Regional Market Share
Geographic Coverage of Green IT Services Market
Green IT Services Market REPORT HIGHLIGHTS
| Aspects | Details |
|---|---|
| Study Period | 2020-2034 |
| Base Year | 2025 |
| Estimated Year | 2026 |
| Forecast Period | 2026-2034 |
| Historical Period | 2020-2025 |
| Growth Rate | CAGR of 15.21% from 2020-2034 |
| Segmentation |
|
Table of Contents
- 1. Introduction
- 1.1. Research Scope
- 1.2. Market Segmentation
- 1.3. Research Objective
- 1.4. Definitions and Assumptions
- 2. Executive Summary
- 2.1. Market Snapshot
- 3. Market Dynamics
- 3.1. Market Drivers
- 3.2. Market Restrains
- 3.3. Market Trends
- 3.4. Market Opportunities
- 4. Market Factor Analysis
- 4.1. Porters Five Forces
- 4.1.1. Bargaining Power of Suppliers
- 4.1.2. Bargaining Power of Buyers
- 4.1.3. Threat of New Entrants
- 4.1.4. Threat of Substitutes
- 4.1.5. Competitive Rivalry
- 4.2. PESTEL analysis
- 4.3. BCG Analysis
- 4.3.1. Stars (High Growth, High Market Share)
- 4.3.2. Cash Cows (Low Growth, High Market Share)
- 4.3.3. Question Mark (High Growth, Low Market Share)
- 4.3.4. Dogs (Low Growth, Low Market Share)
- 4.4. Ansoff Matrix Analysis
- 4.5. Supply Chain Analysis
- 4.6. Regulatory Landscape
- 4.7. Current Market Potential and Opportunity Assessment (TAM–SAM–SOM Framework)
- 4.8. PRI Analyst Note
- 4.1. Porters Five Forces
- 5. Market Analysis, Insights and Forecast 2021-2033
- 5.1. Market Analysis, Insights and Forecast - by Type
- 5.1.1. Software
- 5.1.2. Services
- 5.2. Market Analysis, Insights and Forecast - by End-user Vertical
- 5.2.1. Government
- 5.2.2. BFSI
- 5.2.3. IT and Telecom
- 5.2.4. Industrial
- 5.2.5. Healthcare
- 5.2.6. Other End-user Verticals
- 5.3. Market Analysis, Insights and Forecast - by Region
- 5.3.1. North America
- 5.3.2. Europe
- 5.3.3. Asia Pacific
- 5.3.4. Latin America
- 5.3.5. Middle East
- 5.1. Market Analysis, Insights and Forecast - by Type
- 6. Global Green IT Services Market Analysis, Insights and Forecast, 2021-2033
- 6.1. Market Analysis, Insights and Forecast - by Type
- 6.1.1. Software
- 6.1.2. Services
- 6.2. Market Analysis, Insights and Forecast - by End-user Vertical
- 6.2.1. Government
- 6.2.2. BFSI
- 6.2.3. IT and Telecom
- 6.2.4. Industrial
- 6.2.5. Healthcare
- 6.2.6. Other End-user Verticals
- 6.1. Market Analysis, Insights and Forecast - by Type
- 7. North America Green IT Services Market Analysis, Insights and Forecast, 2020-2032
- 7.1. Market Analysis, Insights and Forecast - by Type
- 7.1.1. Software
- 7.1.2. Services
- 7.2. Market Analysis, Insights and Forecast - by End-user Vertical
- 7.2.1. Government
- 7.2.2. BFSI
- 7.2.3. IT and Telecom
- 7.2.4. Industrial
- 7.2.5. Healthcare
- 7.2.6. Other End-user Verticals
- 7.1. Market Analysis, Insights and Forecast - by Type
- 8. Europe Green IT Services Market Analysis, Insights and Forecast, 2020-2032
- 8.1. Market Analysis, Insights and Forecast - by Type
- 8.1.1. Software
- 8.1.2. Services
- 8.2. Market Analysis, Insights and Forecast - by End-user Vertical
- 8.2.1. Government
- 8.2.2. BFSI
- 8.2.3. IT and Telecom
- 8.2.4. Industrial
- 8.2.5. Healthcare
- 8.2.6. Other End-user Verticals
- 8.1. Market Analysis, Insights and Forecast - by Type
- 9. Asia Pacific Green IT Services Market Analysis, Insights and Forecast, 2020-2032
- 9.1. Market Analysis, Insights and Forecast - by Type
- 9.1.1. Software
- 9.1.2. Services
- 9.2. Market Analysis, Insights and Forecast - by End-user Vertical
- 9.2.1. Government
- 9.2.2. BFSI
- 9.2.3. IT and Telecom
- 9.2.4. Industrial
- 9.2.5. Healthcare
- 9.2.6. Other End-user Verticals
- 9.1. Market Analysis, Insights and Forecast - by Type
- 10. Latin America Green IT Services Market Analysis, Insights and Forecast, 2020-2032
- 10.1. Market Analysis, Insights and Forecast - by Type
- 10.1.1. Software
- 10.1.2. Services
- 10.2. Market Analysis, Insights and Forecast - by End-user Vertical
- 10.2.1. Government
- 10.2.2. BFSI
- 10.2.3. IT and Telecom
- 10.2.4. Industrial
- 10.2.5. Healthcare
- 10.2.6. Other End-user Verticals
- 10.1. Market Analysis, Insights and Forecast - by Type
- 11. Middle East Green IT Services Market Analysis, Insights and Forecast, 2020-2032
- 11.1. Market Analysis, Insights and Forecast - by Type
- 11.1.1. Software
- 11.1.2. Services
- 11.2. Market Analysis, Insights and Forecast - by End-user Vertical
- 11.2.1. Government
- 11.2.2. BFSI
- 11.2.3. IT and Telecom
- 11.2.4. Industrial
- 11.2.5. Healthcare
- 11.2.6. Other End-user Verticals
- 11.1. Market Analysis, Insights and Forecast - by Type
- 12. Competitive Analysis
- 12.1. Company Profiles
- 12.1.1 Dakota Software Corp
- 12.1.1.1. Company Overview
- 12.1.1.2. Products
- 12.1.1.3. Company Financials
- 12.1.1.4. SWOT Analysis
- 12.1.2 Accenture PLC
- 12.1.2.1. Company Overview
- 12.1.2.2. Products
- 12.1.2.3. Company Financials
- 12.1.2.4. SWOT Analysis
- 12.1.3 IBM Corporation
- 12.1.3.1. Company Overview
- 12.1.3.2. Products
- 12.1.3.3. Company Financials
- 12.1.3.4. SWOT Analysis
- 12.1.4 Enablon Sa
- 12.1.4.1. Company Overview
- 12.1.4.2. Products
- 12.1.4.3. Company Financials
- 12.1.4.4. SWOT Analysis
- 12.1.5 Johnson Controls
- 12.1.5.1. Company Overview
- 12.1.5.2. Products
- 12.1.5.3. Company Financials
- 12.1.5.4. SWOT Analysis
- 12.1.6 Schneider Electric SE
- 12.1.6.1. Company Overview
- 12.1.6.2. Products
- 12.1.6.3. Company Financials
- 12.1.6.4. SWOT Analysis
- 12.1.7 Accuvio Sustainability Software
- 12.1.7.1. Company Overview
- 12.1.7.2. Products
- 12.1.7.3. Company Financials
- 12.1.7.4. SWOT Analysis
- 12.1.8 Enviance Inc *List Not Exhaustive
- 12.1.8.1. Company Overview
- 12.1.8.2. Products
- 12.1.8.3. Company Financials
- 12.1.8.4. SWOT Analysis
- 12.1.9 SAP SE
- 12.1.9.1. Company Overview
- 12.1.9.2. Products
- 12.1.9.3. Company Financials
- 12.1.9.4. SWOT Analysis
- 12.1.1 Dakota Software Corp
- 12.2. Market Entropy
- 12.2.1 Company's Key Areas Served
- 12.2.2 Recent Developments
- 12.3. Company Market Share Analysis 2025
- 12.3.1 Top 5 Companies Market Share Analysis
- 12.3.2 Top 3 Companies Market Share Analysis
- 12.4. List of Potential Customers
- 13. Research Methodology
List of Figures
- Figure 1: Global Green IT Services Market Revenue Breakdown (Million, %) by Region 2025 & 2033
- Figure 2: North America Green IT Services Market Revenue (Million), by Type 2025 & 2033
- Figure 3: North America Green IT Services Market Revenue Share (%), by Type 2025 & 2033
- Figure 4: North America Green IT Services Market Revenue (Million), by End-user Vertical 2025 & 2033
- Figure 5: North America Green IT Services Market Revenue Share (%), by End-user Vertical 2025 & 2033
- Figure 6: North America Green IT Services Market Revenue (Million), by Country 2025 & 2033
- Figure 7: North America Green IT Services Market Revenue Share (%), by Country 2025 & 2033
- Figure 8: Europe Green IT Services Market Revenue (Million), by Type 2025 & 2033
- Figure 9: Europe Green IT Services Market Revenue Share (%), by Type 2025 & 2033
- Figure 10: Europe Green IT Services Market Revenue (Million), by End-user Vertical 2025 & 2033
- Figure 11: Europe Green IT Services Market Revenue Share (%), by End-user Vertical 2025 & 2033
- Figure 12: Europe Green IT Services Market Revenue (Million), by Country 2025 & 2033
- Figure 13: Europe Green IT Services Market Revenue Share (%), by Country 2025 & 2033
- Figure 14: Asia Pacific Green IT Services Market Revenue (Million), by Type 2025 & 2033
- Figure 15: Asia Pacific Green IT Services Market Revenue Share (%), by Type 2025 & 2033
- Figure 16: Asia Pacific Green IT Services Market Revenue (Million), by End-user Vertical 2025 & 2033
- Figure 17: Asia Pacific Green IT Services Market Revenue Share (%), by End-user Vertical 2025 & 2033
- Figure 18: Asia Pacific Green IT Services Market Revenue (Million), by Country 2025 & 2033
- Figure 19: Asia Pacific Green IT Services Market Revenue Share (%), by Country 2025 & 2033
- Figure 20: Latin America Green IT Services Market Revenue (Million), by Type 2025 & 2033
- Figure 21: Latin America Green IT Services Market Revenue Share (%), by Type 2025 & 2033
- Figure 22: Latin America Green IT Services Market Revenue (Million), by End-user Vertical 2025 & 2033
- Figure 23: Latin America Green IT Services Market Revenue Share (%), by End-user Vertical 2025 & 2033
- Figure 24: Latin America Green IT Services Market Revenue (Million), by Country 2025 & 2033
- Figure 25: Latin America Green IT Services Market Revenue Share (%), by Country 2025 & 2033
- Figure 26: Middle East Green IT Services Market Revenue (Million), by Type 2025 & 2033
- Figure 27: Middle East Green IT Services Market Revenue Share (%), by Type 2025 & 2033
- Figure 28: Middle East Green IT Services Market Revenue (Million), by End-user Vertical 2025 & 2033
- Figure 29: Middle East Green IT Services Market Revenue Share (%), by End-user Vertical 2025 & 2033
- Figure 30: Middle East Green IT Services Market Revenue (Million), by Country 2025 & 2033
- Figure 31: Middle East Green IT Services Market Revenue Share (%), by Country 2025 & 2033
List of Tables
- Table 1: Global Green IT Services Market Revenue Million Forecast, by Type 2020 & 2033
- Table 2: Global Green IT Services Market Revenue Million Forecast, by End-user Vertical 2020 & 2033
- Table 3: Global Green IT Services Market Revenue Million Forecast, by Region 2020 & 2033
- Table 4: Global Green IT Services Market Revenue Million Forecast, by Type 2020 & 2033
- Table 5: Global Green IT Services Market Revenue Million Forecast, by End-user Vertical 2020 & 2033
- Table 6: Global Green IT Services Market Revenue Million Forecast, by Country 2020 & 2033
- Table 7: Global Green IT Services Market Revenue Million Forecast, by Type 2020 & 2033
- Table 8: Global Green IT Services Market Revenue Million Forecast, by End-user Vertical 2020 & 2033
- Table 9: Global Green IT Services Market Revenue Million Forecast, by Country 2020 & 2033
- Table 10: Global Green IT Services Market Revenue Million Forecast, by Type 2020 & 2033
- Table 11: Global Green IT Services Market Revenue Million Forecast, by End-user Vertical 2020 & 2033
- Table 12: Global Green IT Services Market Revenue Million Forecast, by Country 2020 & 2033
- Table 13: Global Green IT Services Market Revenue Million Forecast, by Type 2020 & 2033
- Table 14: Global Green IT Services Market Revenue Million Forecast, by End-user Vertical 2020 & 2033
- Table 15: Global Green IT Services Market Revenue Million Forecast, by Country 2020 & 2033
- Table 16: Global Green IT Services Market Revenue Million Forecast, by Type 2020 & 2033
- Table 17: Global Green IT Services Market Revenue Million Forecast, by End-user Vertical 2020 & 2033
- Table 18: Global Green IT Services Market Revenue Million Forecast, by Country 2020 & 2033
Frequently Asked Questions
1. What is the projected Compound Annual Growth Rate (CAGR) of the Green IT Services Market?
The projected CAGR is approximately 15.21%.
2. Which companies are prominent players in the Green IT Services Market?
Key companies in the market include Dakota Software Corp, Accenture PLC, IBM Corporation, Enablon Sa, Johnson Controls, Schneider Electric SE, Accuvio Sustainability Software, Enviance Inc *List Not Exhaustive, SAP SE.
3. What are the main segments of the Green IT Services Market?
The market segments include Type, End-user Vertical.
4. Can you provide details about the market size?
The market size is estimated to be USD 24.36 Million as of 2022.
5. What are some drivers contributing to market growth?
Increasing Environmental Concerns and Growing Focus on Reducing Carbon Footprints; Strengthening Government Regulations.
6. What are the notable trends driving market growth?
Application in IT and Telecom to Drive the Green IT Service Market.
7. Are there any restraints impacting market growth?
Managing Variable Energy and Resource Demands.
8. Can you provide examples of recent developments in the market?
April 2022 - Huawei proposed the "Green and Low Carbon" concept at the Huawei Global Analyst Summit (HAS) 2022 for its Huawei CloudFabric 3.0 Hyper-Converged Data Center Network (DCN) Solution in order to use lossless networks to improve computing efficiency and reduce computing footprint and embrace green computing.
9. What pricing options are available for accessing the report?
Pricing options include single-user, multi-user, and enterprise licenses priced at USD 4750, USD 5250, and USD 8750 respectively.
10. Is the market size provided in terms of value or volume?
The market size is provided in terms of value, measured in Million.
11. Are there any specific market keywords associated with the report?
Yes, the market keyword associated with the report is "Green IT Services Market," which aids in identifying and referencing the specific market segment covered.
12. How do I determine which pricing option suits my needs best?
The pricing options vary based on user requirements and access needs. Individual users may opt for single-user licenses, while businesses requiring broader access may choose multi-user or enterprise licenses for cost-effective access to the report.
13. Are there any additional resources or data provided in the Green IT Services Market report?
While the report offers comprehensive insights, it's advisable to review the specific contents or supplementary materials provided to ascertain if additional resources or data are available.
14. How can I stay updated on further developments or reports in the Green IT Services Market?
To stay informed about further developments, trends, and reports in the Green IT Services Market, consider subscribing to industry newsletters, following relevant companies and organizations, or regularly checking reputable industry news sources and publications.
Methodology
Step 1 - Identification of Relevant Samples Size from Population Database


Step 2 - Approaches for Defining Global Market Size (Value, Volume* & Price*)

Note*: In applicable scenarios
Step 3 - Data Sources
Primary Research
- Web Analytics
- Survey Reports
- Research Institute
- Latest Research Reports
- Opinion Leaders
Secondary Research
- Annual Reports
- White Paper
- Latest Press Release
- Industry Association
- Paid Database
- Investor Presentations

Step 4 - Data Triangulation
Involves using different sources of information in order to increase the validity of a study
These sources are likely to be stakeholders in a program - participants, other researchers, program staff, other community members, and so on.
Then we put all data in single framework & apply various statistical tools to find out the dynamic on the market.
During the analysis stage, feedback from the stakeholder groups would be compared to determine areas of agreement as well as areas of divergence