

Key Insights
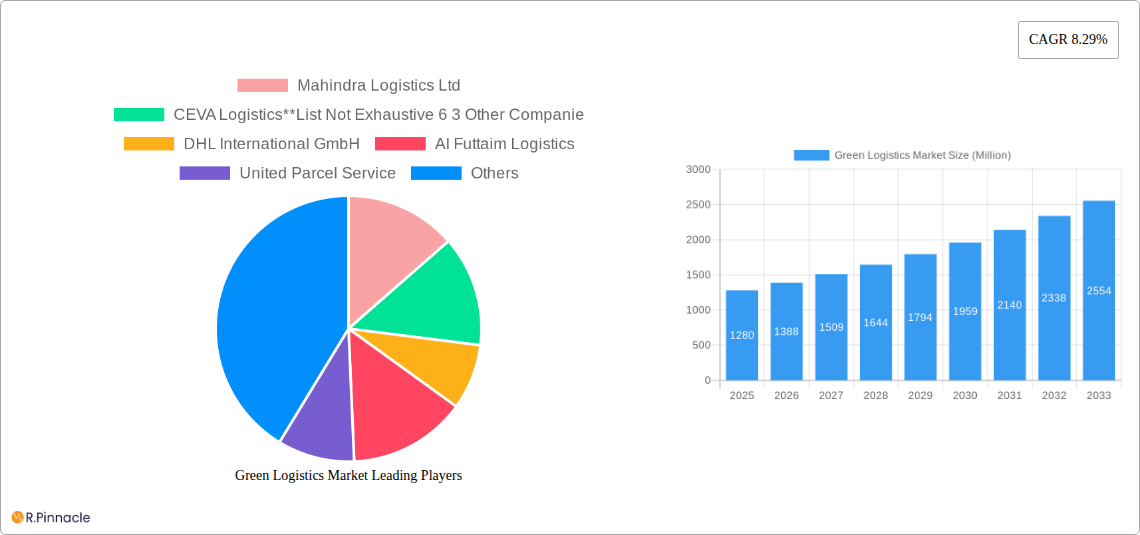
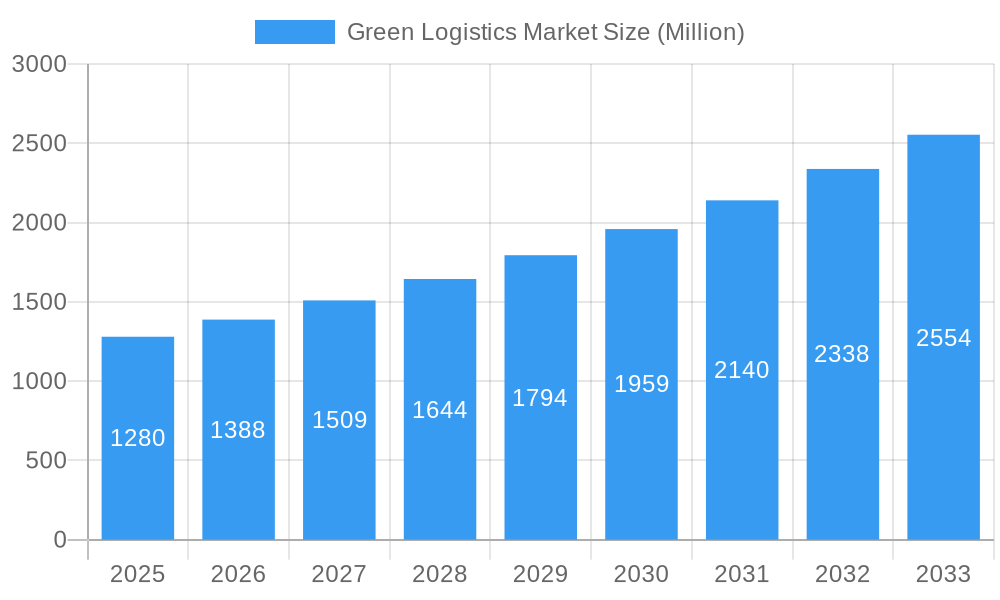
The global green logistics market, valued at $1.28 billion in 2025, is projected to experience robust growth, driven by increasing environmental concerns, stringent government regulations on carbon emissions, and rising consumer demand for sustainable supply chains. The market's Compound Annual Growth Rate (CAGR) of 8.29% from 2025 to 2033 indicates a significant expansion, reaching an estimated value of approximately $2.7 billion by 2033. Key growth drivers include the adoption of electric vehicles, alternative fuels, and optimized route planning to reduce carbon footprints. Furthermore, advancements in warehouse automation and digitalization are enhancing efficiency and minimizing waste, contributing to the market's expansion. The segmentation reveals that healthcare, manufacturing, and e-commerce are major end-users, while warehousing and value-added services dominate the business type segment. Geographically, North America and Europe currently hold significant market share, but the Asia-Pacific region is poised for substantial growth, driven by increasing industrialization and rising consumer awareness of environmental sustainability. The market faces challenges like high initial investment costs associated with adopting green technologies and the lack of standardized infrastructure in certain regions. However, government incentives, technological advancements, and the increasing pressure on companies to improve their environmental performance will overcome these restraints, fostering continued market expansion throughout the forecast period.
Green Logistics Market Market Size (In Billion)
The competitive landscape is characterized by a mix of large multinational corporations like DHL, UPS, and FedEx, as well as regional players like Mahindra Logistics and Agility. These companies are actively investing in research and development, strategic partnerships, and acquisitions to strengthen their market positions and offer comprehensive green logistics solutions. The market is expected to see further consolidation as companies strive to achieve economies of scale and expand their service offerings to meet the evolving needs of their clients. The focus will increasingly shift towards integrated solutions combining various green technologies and services to provide end-to-end sustainable supply chains. This will drive innovation and lead to the emergence of specialized niche players catering to specific industries and geographical locations.
Green Logistics Market Company Market Share
Green Logistics Market: A Comprehensive Report (2019-2033)
This in-depth report provides a comprehensive analysis of the Green Logistics Market, offering actionable insights for industry professionals. The study covers the period 2019-2033, with 2025 as the base and estimated year, and a forecast period of 2025-2033. The market is segmented by end-user, business type, and mode of operation, providing a granular understanding of this rapidly evolving sector. The report is valued at xx Million and is expected to reach xx Million by 2033, exhibiting a CAGR of xx%.
Green Logistics Market Market Structure & Innovation Trends
This section analyzes the Green Logistics market's competitive landscape, examining market concentration, key innovation drivers, regulatory frameworks, and the impact of product substitutes. We delve into end-user demographics and the dynamics of mergers and acquisitions (M&A) within the industry. The report includes detailed analysis of market share held by key players such as Mahindra Logistics Ltd, CEVA Logistics, DHL International GmbH, and others. We explore the influence of government regulations and incentives on market growth, as well as the emergence of disruptive technologies. Data on M&A activities, including deal values, are presented to illustrate market consolidation and strategic investments. The analysis also includes a detailed assessment of the market's overall structure, considering factors like the level of fragmentation, the presence of barriers to entry, and the degree of competition among existing players. The impact of substitute products and services on market dynamics is discussed.
Green Logistics Market Market Dynamics & Trends
This section provides a detailed analysis of the key factors driving the growth of the Green Logistics market. We examine technological disruptions, shifting consumer preferences towards sustainable practices, and the evolving competitive landscape. Key metrics such as the Compound Annual Growth Rate (CAGR) and market penetration rates are presented to provide a quantitative understanding of market trends. This comprehensive analysis also explores the impact of macroeconomic conditions, including economic growth rates, energy prices, and government policies, on market development. The changing regulatory landscape and its effect on industry practices are discussed in detail.
Dominant Regions & Segments in Green Logistics Market
This section identifies the leading regions, countries, and market segments within the Green Logistics market. A detailed analysis of the dominance of specific segments – by end-user (Healthcare, Manufacturing, Automotive, Banking and Financial Services, Retail and E-commerce, Others), by business type (Warehousing, Distribution, Value-Added Services), and by mode of operation (Storage, Roadways Distribution, Seaways Distribution, Others) – is provided.
- Key Drivers by Segment: The analysis will highlight specific drivers within each segment, including:
- Economic Policies: Government incentives and regulations promoting green logistics.
- Infrastructure: Availability of charging stations for electric vehicles and other green infrastructure.
- Consumer Demand: Growing consumer preference for environmentally friendly delivery options.
- Technological Advancements: Innovations in electric vehicles, alternative fuels, and logistics technology.
Green Logistics Market Product Innovations
This section summarizes recent product developments, focusing on technological advancements and their market fit. The analysis highlights the competitive advantages offered by innovative green logistics solutions and explores how these innovations are shaping the market landscape.
Report Scope & Segmentation Analysis
The report provides a comprehensive segmentation analysis of the Green Logistics market across various parameters:
- By End User: Healthcare, Manufacturing, Automotive, Banking and Financial Services, Retail and E-commerce, Others – each segment’s growth projections, market size, and competitive landscape are analyzed.
- By Business Type: Warehousing, Distribution, Value-Added Services – detailed analysis of growth rates, market shares, and competitive dynamics within each segment.
- By Mode of Operation: Storage, Roadways Distribution, Seaways Distribution, Others – insights into the growth trajectory, market size, and competitive forces impacting each segment.
Key Drivers of Green Logistics Market Growth
Several key factors are driving growth in the Green Logistics Market. These include technological advancements in electric vehicles and alternative fuels, increasing government regulations promoting sustainability, and growing consumer demand for environmentally friendly logistics solutions. Economic factors such as the rising cost of fossil fuels are also contributing to the market's expansion.
Challenges in the Green Logistics Market Sector
Despite significant growth potential, the Green Logistics market faces challenges. These include high initial investment costs for green technologies, regulatory hurdles and inconsistencies across different regions, potential supply chain disruptions related to the availability of sustainable materials and technologies, and intense competition from traditional logistics providers.
Emerging Opportunities in Green Logistics Market
Despite challenges, significant opportunities exist. These include the expansion into new markets with growing environmental concerns, the development of innovative green technologies (e.g., autonomous vehicles, drone delivery), and the growing demand for transparency and traceability in supply chains.
Leading Players in the Green Logistics Market Market
- Mahindra Logistics Ltd
- CEVA Logistics
- DHL International GmbH
- AI Futtaim Logistics
- United Parcel Service
- Yusen Logistics Co Ltd
- GEODIS
- XPO Logistics
- Agility Public Warehousing Company K S C P
- Bollore Logistics
- Bowling Green Logistics
Key Developments in Green Logistics Market Industry
- [Month, Year]: [Specific development, e.g., Launch of new electric vehicle fleet by XPO Logistics]
- [Month, Year]: [Specific development, e.g., Mahindra Logistics Ltd. partners with renewable energy provider]
- [Month, Year]: [Specific development, e.g., New regulation implemented in [Country] promoting green logistics.]
Future Outlook for Green Logistics Market Market
The future of the Green Logistics market is promising. Continued technological innovation, supportive government policies, and increasing consumer awareness of environmental issues will drive significant growth. Strategic partnerships and investments in sustainable technologies will be crucial for companies to maintain a competitive edge in this rapidly evolving market. The market is poised for significant expansion as businesses increasingly prioritize sustainability and reduce their environmental footprint.
Green Logistics Market Segmentation
-
1. End User
- 1.1. Healthcare
- 1.2. Manufacturing
- 1.3. Automotive
- 1.4. Banking and Financial services
- 1.5. Retail and E-commerce
- 1.6. Others
-
2. Business Type
- 2.1. Warehousing
- 2.2. Distribution
- 2.3. Value-Added Services
-
3. Mode of Operation
- 3.1. Storage
- 3.2. Roadways Distribution
- 3.3. Seaways Distribution
- 3.4. Others
Green Logistics Market Segmentation By Geography
-
1. North America
- 1.1. US
- 1.2. Canada
- 1.3. Mexico
-
2. Europe
- 2.1. Germany
- 2.2. UK
- 2.3. France
- 2.4. Russia
- 2.5. Spain
- 2.6. Rest of Europe
-
3. Asia Pacific
- 3.1. India
- 3.2. China
- 3.3. Japan
- 3.4. South Korea
- 3.5. Rest of Asia Pacific
-
4. LAMEA
- 4.1. Latin America
- 4.2. Middle East
- 4.3. Africa
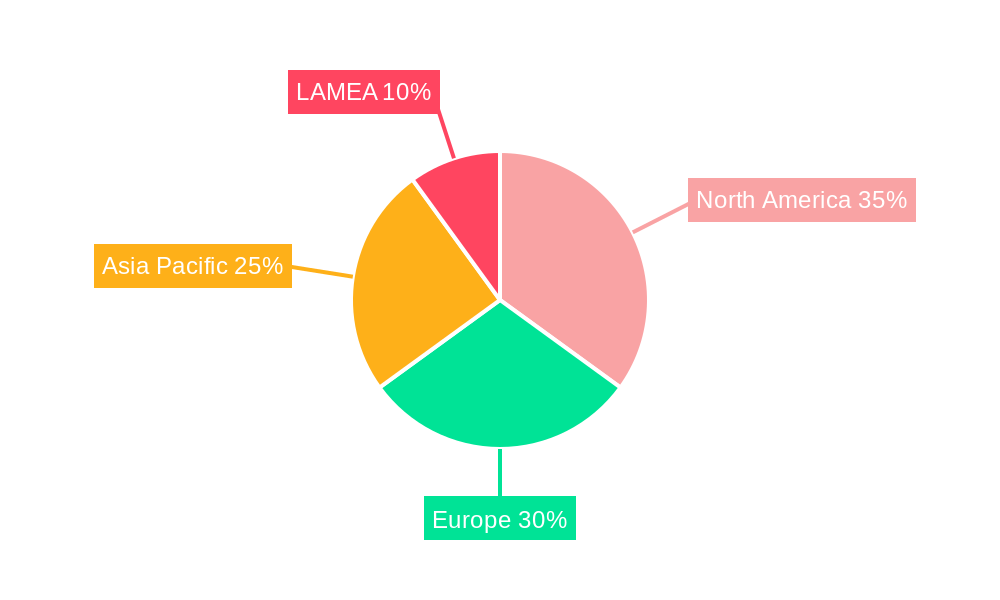
Green Logistics Market Regional Market Share
Geographic Coverage of Green Logistics Market
Green Logistics Market REPORT HIGHLIGHTS
| Aspects | Details |
|---|---|
| Study Period | 2020-2034 |
| Base Year | 2025 |
| Estimated Year | 2026 |
| Forecast Period | 2026-2034 |
| Historical Period | 2020-2025 |
| Growth Rate | CAGR of 8.29% from 2020-2034 |
| Segmentation |
|
Table of Contents
- 1. Introduction
- 1.1. Research Scope
- 1.2. Market Segmentation
- 1.3. Research Objective
- 1.4. Definitions and Assumptions
- 2. Executive Summary
- 2.1. Market Snapshot
- 3. Market Dynamics
- 3.1. Market Drivers
- 3.2. Market Restrains
- 3.3. Market Trends
- 3.4. Market Opportunities
- 4. Market Factor Analysis
- 4.1. Porters Five Forces
- 4.1.1. Bargaining Power of Suppliers
- 4.1.2. Bargaining Power of Buyers
- 4.1.3. Threat of New Entrants
- 4.1.4. Threat of Substitutes
- 4.1.5. Competitive Rivalry
- 4.2. PESTEL analysis
- 4.3. BCG Analysis
- 4.3.1. Stars (High Growth, High Market Share)
- 4.3.2. Cash Cows (Low Growth, High Market Share)
- 4.3.3. Question Mark (High Growth, Low Market Share)
- 4.3.4. Dogs (Low Growth, Low Market Share)
- 4.4. Ansoff Matrix Analysis
- 4.5. Supply Chain Analysis
- 4.6. Regulatory Landscape
- 4.7. Current Market Potential and Opportunity Assessment (TAM–SAM–SOM Framework)
- 4.8. PRI Analyst Note
- 4.1. Porters Five Forces
- 5. Market Analysis, Insights and Forecast 2021-2033
- 5.1. Market Analysis, Insights and Forecast - by End User
- 5.1.1. Healthcare
- 5.1.2. Manufacturing
- 5.1.3. Automotive
- 5.1.4. Banking and Financial services
- 5.1.5. Retail and E-commerce
- 5.1.6. Others
- 5.2. Market Analysis, Insights and Forecast - by Business Type
- 5.2.1. Warehousing
- 5.2.2. Distribution
- 5.2.3. Value-Added Services
- 5.3. Market Analysis, Insights and Forecast - by Mode of Operation
- 5.3.1. Storage
- 5.3.2. Roadways Distribution
- 5.3.3. Seaways Distribution
- 5.3.4. Others
- 5.4. Market Analysis, Insights and Forecast - by Region
- 5.4.1. North America
- 5.4.2. Europe
- 5.4.3. Asia Pacific
- 5.4.4. LAMEA
- 5.1. Market Analysis, Insights and Forecast - by End User
- 6. Green Logistics Market Analysis, Insights and Forecast, 2021-2033
- 6.1. Market Analysis, Insights and Forecast - by End User
- 6.1.1. Healthcare
- 6.1.2. Manufacturing
- 6.1.3. Automotive
- 6.1.4. Banking and Financial services
- 6.1.5. Retail and E-commerce
- 6.1.6. Others
- 6.2. Market Analysis, Insights and Forecast - by Business Type
- 6.2.1. Warehousing
- 6.2.2. Distribution
- 6.2.3. Value-Added Services
- 6.3. Market Analysis, Insights and Forecast - by Mode of Operation
- 6.3.1. Storage
- 6.3.2. Roadways Distribution
- 6.3.3. Seaways Distribution
- 6.3.4. Others
- 6.1. Market Analysis, Insights and Forecast - by End User
- 7. North America Green Logistics Market Analysis, Insights and Forecast, 2020-2032
- 7.1. Market Analysis, Insights and Forecast - by End User
- 7.1.1. Healthcare
- 7.1.2. Manufacturing
- 7.1.3. Automotive
- 7.1.4. Banking and Financial services
- 7.1.5. Retail and E-commerce
- 7.1.6. Others
- 7.2. Market Analysis, Insights and Forecast - by Business Type
- 7.2.1. Warehousing
- 7.2.2. Distribution
- 7.2.3. Value-Added Services
- 7.3. Market Analysis, Insights and Forecast - by Mode of Operation
- 7.3.1. Storage
- 7.3.2. Roadways Distribution
- 7.3.3. Seaways Distribution
- 7.3.4. Others
- 7.1. Market Analysis, Insights and Forecast - by End User
- 8. Europe Green Logistics Market Analysis, Insights and Forecast, 2020-2032
- 8.1. Market Analysis, Insights and Forecast - by End User
- 8.1.1. Healthcare
- 8.1.2. Manufacturing
- 8.1.3. Automotive
- 8.1.4. Banking and Financial services
- 8.1.5. Retail and E-commerce
- 8.1.6. Others
- 8.2. Market Analysis, Insights and Forecast - by Business Type
- 8.2.1. Warehousing
- 8.2.2. Distribution
- 8.2.3. Value-Added Services
- 8.3. Market Analysis, Insights and Forecast - by Mode of Operation
- 8.3.1. Storage
- 8.3.2. Roadways Distribution
- 8.3.3. Seaways Distribution
- 8.3.4. Others
- 8.1. Market Analysis, Insights and Forecast - by End User
- 9. Asia Pacific Green Logistics Market Analysis, Insights and Forecast, 2020-2032
- 9.1. Market Analysis, Insights and Forecast - by End User
- 9.1.1. Healthcare
- 9.1.2. Manufacturing
- 9.1.3. Automotive
- 9.1.4. Banking and Financial services
- 9.1.5. Retail and E-commerce
- 9.1.6. Others
- 9.2. Market Analysis, Insights and Forecast - by Business Type
- 9.2.1. Warehousing
- 9.2.2. Distribution
- 9.2.3. Value-Added Services
- 9.3. Market Analysis, Insights and Forecast - by Mode of Operation
- 9.3.1. Storage
- 9.3.2. Roadways Distribution
- 9.3.3. Seaways Distribution
- 9.3.4. Others
- 9.1. Market Analysis, Insights and Forecast - by End User
- 10. LAMEA Green Logistics Market Analysis, Insights and Forecast, 2020-2032
- 10.1. Market Analysis, Insights and Forecast - by End User
- 10.1.1. Healthcare
- 10.1.2. Manufacturing
- 10.1.3. Automotive
- 10.1.4. Banking and Financial services
- 10.1.5. Retail and E-commerce
- 10.1.6. Others
- 10.2. Market Analysis, Insights and Forecast - by Business Type
- 10.2.1. Warehousing
- 10.2.2. Distribution
- 10.2.3. Value-Added Services
- 10.3. Market Analysis, Insights and Forecast - by Mode of Operation
- 10.3.1. Storage
- 10.3.2. Roadways Distribution
- 10.3.3. Seaways Distribution
- 10.3.4. Others
- 10.1. Market Analysis, Insights and Forecast - by End User
- 11. Competitive Analysis
- 11.1. Company Profiles
- 11.1.1 Mahindra Logistics Ltd
- 11.1.1.1. Company Overview
- 11.1.1.2. Products
- 11.1.1.3. Company Financials
- 11.1.1.4. SWOT Analysis
- 11.1.2 CEVA Logistics**List Not Exhaustive 6 3 Other Companie
- 11.1.2.1. Company Overview
- 11.1.2.2. Products
- 11.1.2.3. Company Financials
- 11.1.2.4. SWOT Analysis
- 11.1.3 DHL International GmbH
- 11.1.3.1. Company Overview
- 11.1.3.2. Products
- 11.1.3.3. Company Financials
- 11.1.3.4. SWOT Analysis
- 11.1.4 AI Futtaim Logistics
- 11.1.4.1. Company Overview
- 11.1.4.2. Products
- 11.1.4.3. Company Financials
- 11.1.4.4. SWOT Analysis
- 11.1.5 United Parcel Service
- 11.1.5.1. Company Overview
- 11.1.5.2. Products
- 11.1.5.3. Company Financials
- 11.1.5.4. SWOT Analysis
- 11.1.6 Yusen Logistics Co Ltd
- 11.1.6.1. Company Overview
- 11.1.6.2. Products
- 11.1.6.3. Company Financials
- 11.1.6.4. SWOT Analysis
- 11.1.7 GEODIS
- 11.1.7.1. Company Overview
- 11.1.7.2. Products
- 11.1.7.3. Company Financials
- 11.1.7.4. SWOT Analysis
- 11.1.8 XPO Logistics
- 11.1.8.1. Company Overview
- 11.1.8.2. Products
- 11.1.8.3. Company Financials
- 11.1.8.4. SWOT Analysis
- 11.1.9 Agility Public Warehousing Company K S C P
- 11.1.9.1. Company Overview
- 11.1.9.2. Products
- 11.1.9.3. Company Financials
- 11.1.9.4. SWOT Analysis
- 11.1.10 Bollore Logistics
- 11.1.10.1. Company Overview
- 11.1.10.2. Products
- 11.1.10.3. Company Financials
- 11.1.10.4. SWOT Analysis
- 11.1.11 Bowling Green Logistics
- 11.1.11.1. Company Overview
- 11.1.11.2. Products
- 11.1.11.3. Company Financials
- 11.1.11.4. SWOT Analysis
- 11.1.1 Mahindra Logistics Ltd
- 11.2. Market Entropy
- 11.2.1 Company's Key Areas Served
- 11.2.2 Recent Developments
- 11.3. Company Market Share Analysis 2025
- 11.3.1 Top 5 Companies Market Share Analysis
- 11.3.2 Top 3 Companies Market Share Analysis
- 11.4. List of Potential Customers
- 12. Research Methodology
List of Figures
- Figure 1: Green Logistics Market Revenue Breakdown (Million, %) by Product 2025 & 2033
- Figure 2: Green Logistics Market Share (%) by Company 2025
List of Tables
- Table 1: Green Logistics Market Revenue Million Forecast, by End User 2020 & 2033
- Table 2: Green Logistics Market Revenue Million Forecast, by Business Type 2020 & 2033
- Table 3: Green Logistics Market Revenue Million Forecast, by Mode of Operation 2020 & 2033
- Table 4: Green Logistics Market Revenue Million Forecast, by Region 2020 & 2033
- Table 5: Green Logistics Market Revenue Million Forecast, by End User 2020 & 2033
- Table 6: Green Logistics Market Revenue Million Forecast, by Business Type 2020 & 2033
- Table 7: Green Logistics Market Revenue Million Forecast, by Mode of Operation 2020 & 2033
- Table 8: Green Logistics Market Revenue Million Forecast, by Country 2020 & 2033
- Table 9: US Green Logistics Market Revenue (Million) Forecast, by Application 2020 & 2033
- Table 10: Canada Green Logistics Market Revenue (Million) Forecast, by Application 2020 & 2033
- Table 11: Mexico Green Logistics Market Revenue (Million) Forecast, by Application 2020 & 2033
- Table 12: Green Logistics Market Revenue Million Forecast, by End User 2020 & 2033
- Table 13: Green Logistics Market Revenue Million Forecast, by Business Type 2020 & 2033
- Table 14: Green Logistics Market Revenue Million Forecast, by Mode of Operation 2020 & 2033
- Table 15: Green Logistics Market Revenue Million Forecast, by Country 2020 & 2033
- Table 16: Germany Green Logistics Market Revenue (Million) Forecast, by Application 2020 & 2033
- Table 17: UK Green Logistics Market Revenue (Million) Forecast, by Application 2020 & 2033
- Table 18: France Green Logistics Market Revenue (Million) Forecast, by Application 2020 & 2033
- Table 19: Russia Green Logistics Market Revenue (Million) Forecast, by Application 2020 & 2033
- Table 20: Spain Green Logistics Market Revenue (Million) Forecast, by Application 2020 & 2033
- Table 21: Rest of Europe Green Logistics Market Revenue (Million) Forecast, by Application 2020 & 2033
- Table 22: Green Logistics Market Revenue Million Forecast, by End User 2020 & 2033
- Table 23: Green Logistics Market Revenue Million Forecast, by Business Type 2020 & 2033
- Table 24: Green Logistics Market Revenue Million Forecast, by Mode of Operation 2020 & 2033
- Table 25: Green Logistics Market Revenue Million Forecast, by Country 2020 & 2033
- Table 26: India Green Logistics Market Revenue (Million) Forecast, by Application 2020 & 2033
- Table 27: China Green Logistics Market Revenue (Million) Forecast, by Application 2020 & 2033
- Table 28: Japan Green Logistics Market Revenue (Million) Forecast, by Application 2020 & 2033
- Table 29: South Korea Green Logistics Market Revenue (Million) Forecast, by Application 2020 & 2033
- Table 30: Rest of Asia Pacific Green Logistics Market Revenue (Million) Forecast, by Application 2020 & 2033
- Table 31: Green Logistics Market Revenue Million Forecast, by End User 2020 & 2033
- Table 32: Green Logistics Market Revenue Million Forecast, by Business Type 2020 & 2033
- Table 33: Green Logistics Market Revenue Million Forecast, by Mode of Operation 2020 & 2033
- Table 34: Green Logistics Market Revenue Million Forecast, by Country 2020 & 2033
- Table 35: Latin America Green Logistics Market Revenue (Million) Forecast, by Application 2020 & 2033
- Table 36: Middle East Green Logistics Market Revenue (Million) Forecast, by Application 2020 & 2033
- Table 37: Africa Green Logistics Market Revenue (Million) Forecast, by Application 2020 & 2033
Frequently Asked Questions
1. What is the projected Compound Annual Growth Rate (CAGR) of the Green Logistics Market?
The projected CAGR is approximately 8.29%.
2. Which companies are prominent players in the Green Logistics Market?
Key companies in the market include Mahindra Logistics Ltd, CEVA Logistics**List Not Exhaustive 6 3 Other Companie, DHL International GmbH, AI Futtaim Logistics, United Parcel Service, Yusen Logistics Co Ltd, GEODIS, XPO Logistics, Agility Public Warehousing Company K S C P, Bollore Logistics, Bowling Green Logistics.
3. What are the main segments of the Green Logistics Market?
The market segments include End User, Business Type, Mode of Operation.
4. Can you provide details about the market size?
The market size is estimated to be USD 1.28 Million as of 2022.
5. What are some drivers contributing to market growth?
Growing adoption of EVs in the logistics industry; Increase in adoption of artificial intelligence (AI) in the global logistics industry.
6. What are the notable trends driving market growth?
The Demand for Green Warehouses is Rising.
7. Are there any restraints impacting market growth?
Dependency on fossil fuels. majority for transportation; The high costs of implementing green procurement practices discourage potential investors.
8. Can you provide examples of recent developments in the market?
N/A
9. What pricing options are available for accessing the report?
Pricing options include single-user, multi-user, and enterprise licenses priced at USD 3800, USD 4500, and USD 5800 respectively.
10. Is the market size provided in terms of value or volume?
The market size is provided in terms of value, measured in Million.
11. Are there any specific market keywords associated with the report?
Yes, the market keyword associated with the report is "Green Logistics Market," which aids in identifying and referencing the specific market segment covered.
12. How do I determine which pricing option suits my needs best?
The pricing options vary based on user requirements and access needs. Individual users may opt for single-user licenses, while businesses requiring broader access may choose multi-user or enterprise licenses for cost-effective access to the report.
13. Are there any additional resources or data provided in the Green Logistics Market report?
While the report offers comprehensive insights, it's advisable to review the specific contents or supplementary materials provided to ascertain if additional resources or data are available.
14. How can I stay updated on further developments or reports in the Green Logistics Market?
To stay informed about further developments, trends, and reports in the Green Logistics Market, consider subscribing to industry newsletters, following relevant companies and organizations, or regularly checking reputable industry news sources and publications.
Methodology
Step 1 - Identification of Relevant Samples Size from Population Database


Step 2 - Approaches for Defining Global Market Size (Value, Volume* & Price*)

Note*: In applicable scenarios
Step 3 - Data Sources
Primary Research
- Web Analytics
- Survey Reports
- Research Institute
- Latest Research Reports
- Opinion Leaders
Secondary Research
- Annual Reports
- White Paper
- Latest Press Release
- Industry Association
- Paid Database
- Investor Presentations

Step 4 - Data Triangulation
Involves using different sources of information in order to increase the validity of a study
These sources are likely to be stakeholders in a program - participants, other researchers, program staff, other community members, and so on.
Then we put all data in single framework & apply various statistical tools to find out the dynamic on the market.
During the analysis stage, feedback from the stakeholder groups would be compared to determine areas of agreement as well as areas of divergence