

Key Insights
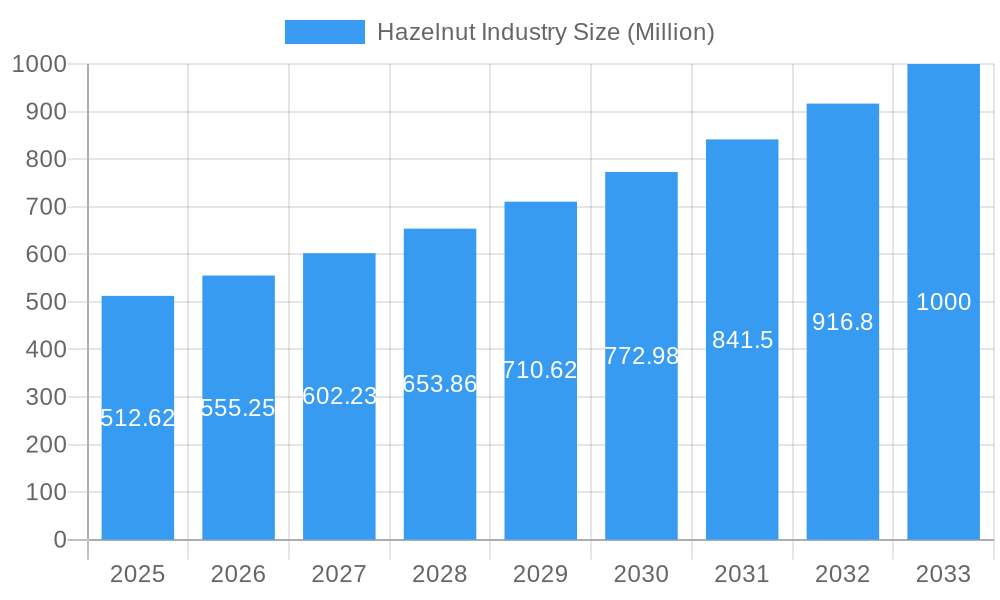
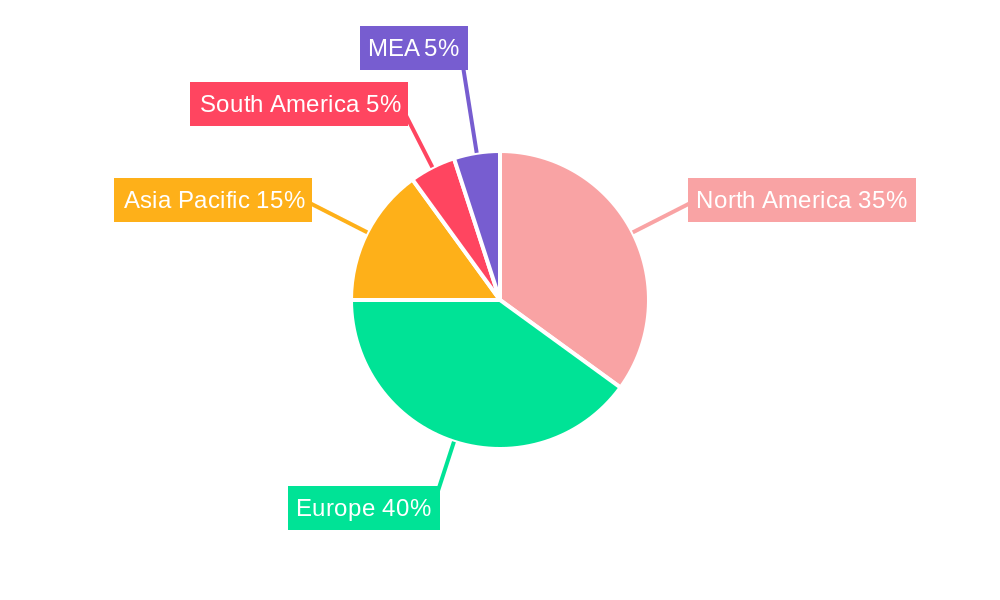
The global hazelnut market, valued at $512.62 million in 2025, is projected to experience robust growth, driven by increasing consumer demand for healthy snacks and the rising popularity of hazelnut-based products in the food and beverage, confectionery, and bakery sectors. The market's Compound Annual Growth Rate (CAGR) of 8.10% from 2025 to 2033 indicates significant expansion potential. Key drivers include the growing awareness of hazelnuts' nutritional benefits, such as their high protein and fiber content, and their versatility in various culinary applications. Furthermore, the increasing prevalence of vegan and vegetarian diets is fueling demand for plant-based alternatives, boosting hazelnut consumption. However, factors such as fluctuating hazelnut yields due to climate change and potential price volatility could act as restraints on market growth. The segmentation analysis reveals strong demand across product types, with roasted hazelnuts, hazelnut paste, and hazelnut oil witnessing particularly high growth. Geographically, North America and Europe are currently the dominant markets, but the Asia-Pacific region is expected to show substantial growth in the coming years, driven by rising disposable incomes and changing consumer preferences in emerging economies like India and China. Major players like Ferrero, Mondelez International, and Barry Callebaut are strategically investing in innovation and expanding their product portfolios to cater to the growing market demand.
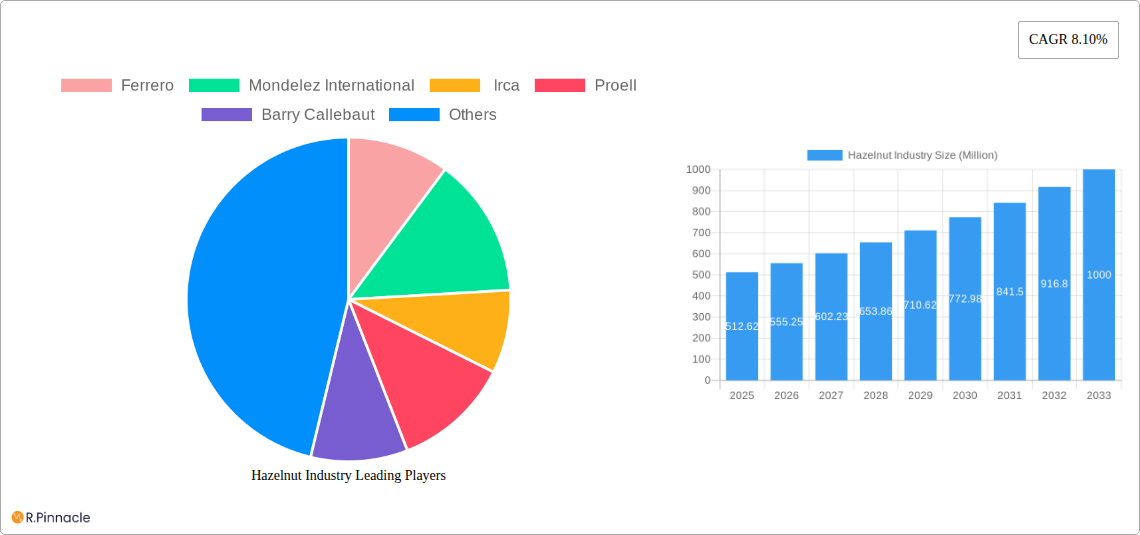
Hazelnut Industry Market Size (In Million)
The competitive landscape is marked by the presence of both large multinational corporations and smaller, specialized hazelnut processors. Success in this market hinges on maintaining high-quality standards, efficient supply chains, and innovative product development to meet evolving consumer preferences. The forecast period (2025-2033) presents significant opportunities for market participants, particularly those focusing on sustainable sourcing practices and responding to the increasing demand for organic and ethically sourced hazelnuts. The market's growth trajectory suggests a promising future for hazelnut producers, processors, and retailers, driven by the confluence of health consciousness, culinary innovation, and increasing global demand.
Hazelnut Industry Company Market Share
Deep Dive into the Hazelnut Industry: A Comprehensive Market Report (2019-2033)
This comprehensive report provides an in-depth analysis of the global hazelnut industry, offering invaluable insights for industry professionals, investors, and strategic decision-makers. The study period covers 2019-2033, with 2025 as the base and estimated year. We project a market size exceeding $XX Million by 2033, driven by robust growth in key segments and regions. This report is crucial for understanding the current market landscape and navigating the future of the hazelnut industry.
Hazelnut Industry Market Structure & Innovation Trends
The global hazelnut market exhibits a moderately concentrated structure, with key players like Ferrero, Mondelez International, Barry Callebaut, Irca, and Proell holding significant market share. Ferrero, for example, commands a substantial portion, leveraging its strong brand presence and extensive distribution network. The market's innovative landscape is driven by consumer demand for premium and value-added products, such as hazelnut paste and hazelnut oil, pushing companies to explore novel processing techniques and product formulations. Regulatory frameworks concerning food safety and labeling significantly impact market dynamics, influencing product development and marketing strategies. The presence of substitutes, such as other nuts and nut butters, necessitates continuous innovation to maintain competitive advantage. Mergers and acquisitions (M&A) activity has been moderate, with deal values in the range of $XX Million annually over the historical period. Recent M&A activity has primarily focused on securing supply chains and expanding market access.
Hazelnut Industry Market Dynamics & Trends
The hazelnut market is experiencing robust growth, with a projected Compound Annual Growth Rate (CAGR) of XX% during the forecast period (2025-2033). This growth is fueled by several key factors: increasing consumer demand for healthier snacks and confectionery products, rising disposable incomes in emerging economies, and the increasing popularity of hazelnut-based products in various food and beverage applications. Technological advancements in hazelnut processing and packaging are enhancing product quality, shelf life, and overall efficiency. Consumer preferences are shifting toward sustainably sourced hazelnuts, driving the adoption of eco-friendly farming practices. Intense competition among major players fuels innovation and drives down prices, benefiting consumers. Market penetration in key regions is expected to increase significantly, with particularly strong growth anticipated in Asia and the Americas.
Dominant Regions & Segments in Hazelnut Industry
Turkey remains the leading producer and exporter of hazelnuts globally. Its dominance is attributed to favorable climatic conditions, established agricultural practices, and government support.
- Key Drivers of Turkey's Dominance:
- Established agricultural infrastructure.
- Government support for hazelnut cultivation.
- Favorable climatic conditions.
- Experienced workforce.
Within product types, Natural Hazelnuts represent the largest segment due to their versatile application in various industries. In terms of application, the Confectionery segment dominates, driven by the widespread use of hazelnuts in chocolate spreads, pralines, and other confectionery items. This segment's growth is significantly correlated to increased consumer spending on premium confectionery products. The Food and Beverage segment also shows significant potential for growth, with hazelnuts being increasingly incorporated into various food products.
Hazelnut Industry Product Innovations
Recent innovations focus on enhancing product quality, shelf life, and convenience. This includes advancements in roasting techniques to optimize flavor and aroma, the development of ready-to-use hazelnut pastes and oils, and packaging innovations that improve product preservation. Manufacturers are also emphasizing the use of sustainable and ethically sourced hazelnuts to appeal to environmentally conscious consumers. These innovations cater to the evolving consumer preferences for healthier, convenient, and sustainably produced food products.
Report Scope & Segmentation Analysis
This report segments the hazelnut market by product type (Natural Hazelnuts, Roasted Hazelnuts, Chopped Hazelnuts, Hazelnut Paste, Hazelnut Oil) and application (Food and Beverage, Confectionery, Bakery, Other). Each segment's growth projection, market size, and competitive landscape are detailed within the full report. The growth projections consider factors such as consumer preferences, technological advancements, and regulatory changes. Competitive dynamics within each segment are analyzed to identify key players and their market strategies.
Key Drivers of Hazelnut Industry Growth
Several factors drive the growth of the hazelnut industry. These include the rising demand for healthy snacks and confectionery items, particularly among millennials and Gen Z. Technological advancements in processing and packaging improve product quality and efficiency. Favorable government policies and support for hazelnut farmers in key producing regions also play a critical role. The growing popularity of hazelnut-based products in various food and beverage applications further propels market expansion.
Challenges in the Hazelnut Industry Sector
The hazelnut industry faces several challenges. Fluctuations in hazelnut production due to climate change and pests impact supply and prices. Competition from other nuts and nut-based products necessitates continuous innovation and differentiation. Stringent food safety and labeling regulations increase operational costs and compliance complexities. Supply chain disruptions and logistical challenges can affect product availability and pricing. These factors contribute to the overall uncertainty and risk within the industry, impacting profitability and growth.
Emerging Opportunities in Hazelnut Industry
Significant opportunities exist in expanding into new markets, particularly in developing economies with increasing disposable incomes and growing demand for premium food products. The use of hazelnut ingredients in functional foods and beverages represents a promising growth avenue. Technological advancements in hazelnut processing and extraction offer potential for cost reduction and improved product quality. Focusing on sustainable and ethically sourced hazelnuts will attract environmentally conscious consumers and create a positive brand image.
Leading Players in the Hazelnut Industry Market
- Ferrero
- Mondelez International
- Irca
- Proell
- Barry Callebaut
Key Developments in Hazelnut Industry
- 2022 Q3: Ferrero announced a significant investment in hazelnut processing facilities, expanding its production capacity.
- 2021 Q4: A new hazelnut paste processing technology was introduced, improving efficiency and reducing waste.
- 2020 Q1: A major merger occurred between two hazelnut processing companies, consolidating market share. (Deal value: $XX Million)
Future Outlook for Hazelnut Industry Market
The future of the hazelnut industry appears bright, with continued growth expected driven by increasing consumer demand, product innovation, and expansion into new markets. Strategic investments in sustainable farming practices and technological advancements will be crucial for long-term success. Companies that focus on providing high-quality, ethically sourced, and innovative hazelnut products are well-positioned to capitalize on the industry's growth potential.
Hazelnut Industry Segmentation
- 1. Production Analysis
- 2. Consumption Analysis
- 3. Import Market Analysis (Value & Volume)
- 4. Export Market Analysis (Value & Volume)
- 5. Price Trend Analysis
Hazelnut Industry Segmentation By Geography
-
1. North America
- 1.1. United States
- 1.2. Canada
- 1.3. Mexico
-
2. Europe
- 2.1. Germany
- 2.2. United Kingdom
- 2.3. France
- 2.4. Italy
- 2.5. Austria
- 2.6. Netherlands
- 2.7. Spain
-
3. Asia Pacific
- 3.1. China
- 3.2. Australia
- 3.3. India
- 3.4. Japan
-
4. South America
- 4.1. Brazil
- 4.2. Argentina
-
5. Middle East and Africa
- 5.1. Turkey
- 5.2. South Africa
Hazelnut Industry Regional Market Share
Geographic Coverage of Hazelnut Industry
Hazelnut Industry REPORT HIGHLIGHTS
| Aspects | Details |
|---|---|
| Study Period | 2020-2034 |
| Base Year | 2025 |
| Estimated Year | 2026 |
| Forecast Period | 2026-2034 |
| Historical Period | 2020-2025 |
| Growth Rate | CAGR of 8.10% from 2020-2034 |
| Segmentation |
|
Table of Contents
- 1. Introduction
- 1.1. Research Scope
- 1.2. Market Segmentation
- 1.3. Research Objective
- 1.4. Definitions and Assumptions
- 2. Executive Summary
- 2.1. Market Snapshot
- 3. Market Dynamics
- 3.1. Market Drivers
- 3.2. Market Restrains
- 3.3. Market Trends
- 3.4. Market Opportunities
- 4. Market Factor Analysis
- 4.1. Porters Five Forces
- 4.1.1. Bargaining Power of Suppliers
- 4.1.2. Bargaining Power of Buyers
- 4.1.3. Threat of New Entrants
- 4.1.4. Threat of Substitutes
- 4.1.5. Competitive Rivalry
- 4.2. PESTEL analysis
- 4.3. BCG Analysis
- 4.3.1. Stars (High Growth, High Market Share)
- 4.3.2. Cash Cows (Low Growth, High Market Share)
- 4.3.3. Question Mark (High Growth, Low Market Share)
- 4.3.4. Dogs (Low Growth, Low Market Share)
- 4.4. Ansoff Matrix Analysis
- 4.5. Supply Chain Analysis
- 4.6. Regulatory Landscape
- 4.7. Current Market Potential and Opportunity Assessment (TAM–SAM–SOM Framework)
- 4.8. PRI Analyst Note
- 4.1. Porters Five Forces
- 5. Market Analysis, Insights and Forecast 2021-2033
- 5.1. Market Analysis, Insights and Forecast - by Production Analysis
- 5.2. Market Analysis, Insights and Forecast - by Consumption Analysis
- 5.3. Market Analysis, Insights and Forecast - by Import Market Analysis (Value & Volume)
- 5.4. Market Analysis, Insights and Forecast - by Export Market Analysis (Value & Volume)
- 5.5. Market Analysis, Insights and Forecast - by Price Trend Analysis
- 5.6. Market Analysis, Insights and Forecast - by Region
- 5.6.1. North America
- 5.6.2. Europe
- 5.6.3. Asia Pacific
- 5.6.4. South America
- 5.6.5. Middle East and Africa
- 6. Global Hazelnut Industry Analysis, Insights and Forecast, 2021-2033
- 6.1. Market Analysis, Insights and Forecast - by Production Analysis
- 6.2. Market Analysis, Insights and Forecast - by Consumption Analysis
- 6.3. Market Analysis, Insights and Forecast - by Import Market Analysis (Value & Volume)
- 6.4. Market Analysis, Insights and Forecast - by Export Market Analysis (Value & Volume)
- 6.5. Market Analysis, Insights and Forecast - by Price Trend Analysis
- 7. North America Hazelnut Industry Analysis, Insights and Forecast, 2020-2032
- 7.1. Market Analysis, Insights and Forecast - by Production Analysis
- 7.2. Market Analysis, Insights and Forecast - by Consumption Analysis
- 7.3. Market Analysis, Insights and Forecast - by Import Market Analysis (Value & Volume)
- 7.4. Market Analysis, Insights and Forecast - by Export Market Analysis (Value & Volume)
- 7.5. Market Analysis, Insights and Forecast - by Price Trend Analysis
- 8. Europe Hazelnut Industry Analysis, Insights and Forecast, 2020-2032
- 8.1. Market Analysis, Insights and Forecast - by Production Analysis
- 8.2. Market Analysis, Insights and Forecast - by Consumption Analysis
- 8.3. Market Analysis, Insights and Forecast - by Import Market Analysis (Value & Volume)
- 8.4. Market Analysis, Insights and Forecast - by Export Market Analysis (Value & Volume)
- 8.5. Market Analysis, Insights and Forecast - by Price Trend Analysis
- 9. Asia Pacific Hazelnut Industry Analysis, Insights and Forecast, 2020-2032
- 9.1. Market Analysis, Insights and Forecast - by Production Analysis
- 9.2. Market Analysis, Insights and Forecast - by Consumption Analysis
- 9.3. Market Analysis, Insights and Forecast - by Import Market Analysis (Value & Volume)
- 9.4. Market Analysis, Insights and Forecast - by Export Market Analysis (Value & Volume)
- 9.5. Market Analysis, Insights and Forecast - by Price Trend Analysis
- 10. South America Hazelnut Industry Analysis, Insights and Forecast, 2020-2032
- 10.1. Market Analysis, Insights and Forecast - by Production Analysis
- 10.2. Market Analysis, Insights and Forecast - by Consumption Analysis
- 10.3. Market Analysis, Insights and Forecast - by Import Market Analysis (Value & Volume)
- 10.4. Market Analysis, Insights and Forecast - by Export Market Analysis (Value & Volume)
- 10.5. Market Analysis, Insights and Forecast - by Price Trend Analysis
- 11. Middle East and Africa Hazelnut Industry Analysis, Insights and Forecast, 2020-2032
- 11.1. Market Analysis, Insights and Forecast - by Production Analysis
- 11.2. Market Analysis, Insights and Forecast - by Consumption Analysis
- 11.3. Market Analysis, Insights and Forecast - by Import Market Analysis (Value & Volume)
- 11.4. Market Analysis, Insights and Forecast - by Export Market Analysis (Value & Volume)
- 11.5. Market Analysis, Insights and Forecast - by Price Trend Analysis
- 12. Competitive Analysis
- 12.1. Company Profiles
- 12.1.1 Ferrero
- 12.1.1.1. Company Overview
- 12.1.1.2. Products
- 12.1.1.3. Company Financials
- 12.1.1.4. SWOT Analysis
- 12.1.2 Mondelez International
- 12.1.2.1. Company Overview
- 12.1.2.2. Products
- 12.1.2.3. Company Financials
- 12.1.2.4. SWOT Analysis
- 12.1.3 Irca
- 12.1.3.1. Company Overview
- 12.1.3.2. Products
- 12.1.3.3. Company Financials
- 12.1.3.4. SWOT Analysis
- 12.1.4 Proell
- 12.1.4.1. Company Overview
- 12.1.4.2. Products
- 12.1.4.3. Company Financials
- 12.1.4.4. SWOT Analysis
- 12.1.5 Barry Callebaut
- 12.1.5.1. Company Overview
- 12.1.5.2. Products
- 12.1.5.3. Company Financials
- 12.1.5.4. SWOT Analysis
- 12.1.1 Ferrero
- 12.2. Market Entropy
- 12.2.1 Company's Key Areas Served
- 12.2.2 Recent Developments
- 12.3. Company Market Share Analysis 2025
- 12.3.1 Top 5 Companies Market Share Analysis
- 12.3.2 Top 3 Companies Market Share Analysis
- 12.4. List of Potential Customers
- 13. Research Methodology
List of Figures
- Figure 1: Global Hazelnut Industry Revenue Breakdown (Million, %) by Region 2025 & 2033
- Figure 2: North America Hazelnut Industry Revenue (Million), by Production Analysis 2025 & 2033
- Figure 3: North America Hazelnut Industry Revenue Share (%), by Production Analysis 2025 & 2033
- Figure 4: North America Hazelnut Industry Revenue (Million), by Consumption Analysis 2025 & 2033
- Figure 5: North America Hazelnut Industry Revenue Share (%), by Consumption Analysis 2025 & 2033
- Figure 6: North America Hazelnut Industry Revenue (Million), by Import Market Analysis (Value & Volume) 2025 & 2033
- Figure 7: North America Hazelnut Industry Revenue Share (%), by Import Market Analysis (Value & Volume) 2025 & 2033
- Figure 8: North America Hazelnut Industry Revenue (Million), by Export Market Analysis (Value & Volume) 2025 & 2033
- Figure 9: North America Hazelnut Industry Revenue Share (%), by Export Market Analysis (Value & Volume) 2025 & 2033
- Figure 10: North America Hazelnut Industry Revenue (Million), by Price Trend Analysis 2025 & 2033
- Figure 11: North America Hazelnut Industry Revenue Share (%), by Price Trend Analysis 2025 & 2033
- Figure 12: North America Hazelnut Industry Revenue (Million), by Country 2025 & 2033
- Figure 13: North America Hazelnut Industry Revenue Share (%), by Country 2025 & 2033
- Figure 14: Europe Hazelnut Industry Revenue (Million), by Production Analysis 2025 & 2033
- Figure 15: Europe Hazelnut Industry Revenue Share (%), by Production Analysis 2025 & 2033
- Figure 16: Europe Hazelnut Industry Revenue (Million), by Consumption Analysis 2025 & 2033
- Figure 17: Europe Hazelnut Industry Revenue Share (%), by Consumption Analysis 2025 & 2033
- Figure 18: Europe Hazelnut Industry Revenue (Million), by Import Market Analysis (Value & Volume) 2025 & 2033
- Figure 19: Europe Hazelnut Industry Revenue Share (%), by Import Market Analysis (Value & Volume) 2025 & 2033
- Figure 20: Europe Hazelnut Industry Revenue (Million), by Export Market Analysis (Value & Volume) 2025 & 2033
- Figure 21: Europe Hazelnut Industry Revenue Share (%), by Export Market Analysis (Value & Volume) 2025 & 2033
- Figure 22: Europe Hazelnut Industry Revenue (Million), by Price Trend Analysis 2025 & 2033
- Figure 23: Europe Hazelnut Industry Revenue Share (%), by Price Trend Analysis 2025 & 2033
- Figure 24: Europe Hazelnut Industry Revenue (Million), by Country 2025 & 2033
- Figure 25: Europe Hazelnut Industry Revenue Share (%), by Country 2025 & 2033
- Figure 26: Asia Pacific Hazelnut Industry Revenue (Million), by Production Analysis 2025 & 2033
- Figure 27: Asia Pacific Hazelnut Industry Revenue Share (%), by Production Analysis 2025 & 2033
- Figure 28: Asia Pacific Hazelnut Industry Revenue (Million), by Consumption Analysis 2025 & 2033
- Figure 29: Asia Pacific Hazelnut Industry Revenue Share (%), by Consumption Analysis 2025 & 2033
- Figure 30: Asia Pacific Hazelnut Industry Revenue (Million), by Import Market Analysis (Value & Volume) 2025 & 2033
- Figure 31: Asia Pacific Hazelnut Industry Revenue Share (%), by Import Market Analysis (Value & Volume) 2025 & 2033
- Figure 32: Asia Pacific Hazelnut Industry Revenue (Million), by Export Market Analysis (Value & Volume) 2025 & 2033
- Figure 33: Asia Pacific Hazelnut Industry Revenue Share (%), by Export Market Analysis (Value & Volume) 2025 & 2033
- Figure 34: Asia Pacific Hazelnut Industry Revenue (Million), by Price Trend Analysis 2025 & 2033
- Figure 35: Asia Pacific Hazelnut Industry Revenue Share (%), by Price Trend Analysis 2025 & 2033
- Figure 36: Asia Pacific Hazelnut Industry Revenue (Million), by Country 2025 & 2033
- Figure 37: Asia Pacific Hazelnut Industry Revenue Share (%), by Country 2025 & 2033
- Figure 38: South America Hazelnut Industry Revenue (Million), by Production Analysis 2025 & 2033
- Figure 39: South America Hazelnut Industry Revenue Share (%), by Production Analysis 2025 & 2033
- Figure 40: South America Hazelnut Industry Revenue (Million), by Consumption Analysis 2025 & 2033
- Figure 41: South America Hazelnut Industry Revenue Share (%), by Consumption Analysis 2025 & 2033
- Figure 42: South America Hazelnut Industry Revenue (Million), by Import Market Analysis (Value & Volume) 2025 & 2033
- Figure 43: South America Hazelnut Industry Revenue Share (%), by Import Market Analysis (Value & Volume) 2025 & 2033
- Figure 44: South America Hazelnut Industry Revenue (Million), by Export Market Analysis (Value & Volume) 2025 & 2033
- Figure 45: South America Hazelnut Industry Revenue Share (%), by Export Market Analysis (Value & Volume) 2025 & 2033
- Figure 46: South America Hazelnut Industry Revenue (Million), by Price Trend Analysis 2025 & 2033
- Figure 47: South America Hazelnut Industry Revenue Share (%), by Price Trend Analysis 2025 & 2033
- Figure 48: South America Hazelnut Industry Revenue (Million), by Country 2025 & 2033
- Figure 49: South America Hazelnut Industry Revenue Share (%), by Country 2025 & 2033
- Figure 50: Middle East and Africa Hazelnut Industry Revenue (Million), by Production Analysis 2025 & 2033
- Figure 51: Middle East and Africa Hazelnut Industry Revenue Share (%), by Production Analysis 2025 & 2033
- Figure 52: Middle East and Africa Hazelnut Industry Revenue (Million), by Consumption Analysis 2025 & 2033
- Figure 53: Middle East and Africa Hazelnut Industry Revenue Share (%), by Consumption Analysis 2025 & 2033
- Figure 54: Middle East and Africa Hazelnut Industry Revenue (Million), by Import Market Analysis (Value & Volume) 2025 & 2033
- Figure 55: Middle East and Africa Hazelnut Industry Revenue Share (%), by Import Market Analysis (Value & Volume) 2025 & 2033
- Figure 56: Middle East and Africa Hazelnut Industry Revenue (Million), by Export Market Analysis (Value & Volume) 2025 & 2033
- Figure 57: Middle East and Africa Hazelnut Industry Revenue Share (%), by Export Market Analysis (Value & Volume) 2025 & 2033
- Figure 58: Middle East and Africa Hazelnut Industry Revenue (Million), by Price Trend Analysis 2025 & 2033
- Figure 59: Middle East and Africa Hazelnut Industry Revenue Share (%), by Price Trend Analysis 2025 & 2033
- Figure 60: Middle East and Africa Hazelnut Industry Revenue (Million), by Country 2025 & 2033
- Figure 61: Middle East and Africa Hazelnut Industry Revenue Share (%), by Country 2025 & 2033
List of Tables
- Table 1: Global Hazelnut Industry Revenue Million Forecast, by Production Analysis 2020 & 2033
- Table 2: Global Hazelnut Industry Revenue Million Forecast, by Consumption Analysis 2020 & 2033
- Table 3: Global Hazelnut Industry Revenue Million Forecast, by Import Market Analysis (Value & Volume) 2020 & 2033
- Table 4: Global Hazelnut Industry Revenue Million Forecast, by Export Market Analysis (Value & Volume) 2020 & 2033
- Table 5: Global Hazelnut Industry Revenue Million Forecast, by Price Trend Analysis 2020 & 2033
- Table 6: Global Hazelnut Industry Revenue Million Forecast, by Region 2020 & 2033
- Table 7: Global Hazelnut Industry Revenue Million Forecast, by Production Analysis 2020 & 2033
- Table 8: Global Hazelnut Industry Revenue Million Forecast, by Consumption Analysis 2020 & 2033
- Table 9: Global Hazelnut Industry Revenue Million Forecast, by Import Market Analysis (Value & Volume) 2020 & 2033
- Table 10: Global Hazelnut Industry Revenue Million Forecast, by Export Market Analysis (Value & Volume) 2020 & 2033
- Table 11: Global Hazelnut Industry Revenue Million Forecast, by Price Trend Analysis 2020 & 2033
- Table 12: Global Hazelnut Industry Revenue Million Forecast, by Country 2020 & 2033
- Table 13: United States Hazelnut Industry Revenue (Million) Forecast, by Application 2020 & 2033
- Table 14: Canada Hazelnut Industry Revenue (Million) Forecast, by Application 2020 & 2033
- Table 15: Mexico Hazelnut Industry Revenue (Million) Forecast, by Application 2020 & 2033
- Table 16: Global Hazelnut Industry Revenue Million Forecast, by Production Analysis 2020 & 2033
- Table 17: Global Hazelnut Industry Revenue Million Forecast, by Consumption Analysis 2020 & 2033
- Table 18: Global Hazelnut Industry Revenue Million Forecast, by Import Market Analysis (Value & Volume) 2020 & 2033
- Table 19: Global Hazelnut Industry Revenue Million Forecast, by Export Market Analysis (Value & Volume) 2020 & 2033
- Table 20: Global Hazelnut Industry Revenue Million Forecast, by Price Trend Analysis 2020 & 2033
- Table 21: Global Hazelnut Industry Revenue Million Forecast, by Country 2020 & 2033
- Table 22: Germany Hazelnut Industry Revenue (Million) Forecast, by Application 2020 & 2033
- Table 23: United Kingdom Hazelnut Industry Revenue (Million) Forecast, by Application 2020 & 2033
- Table 24: France Hazelnut Industry Revenue (Million) Forecast, by Application 2020 & 2033
- Table 25: Italy Hazelnut Industry Revenue (Million) Forecast, by Application 2020 & 2033
- Table 26: Austria Hazelnut Industry Revenue (Million) Forecast, by Application 2020 & 2033
- Table 27: Netherlands Hazelnut Industry Revenue (Million) Forecast, by Application 2020 & 2033
- Table 28: Spain Hazelnut Industry Revenue (Million) Forecast, by Application 2020 & 2033
- Table 29: Global Hazelnut Industry Revenue Million Forecast, by Production Analysis 2020 & 2033
- Table 30: Global Hazelnut Industry Revenue Million Forecast, by Consumption Analysis 2020 & 2033
- Table 31: Global Hazelnut Industry Revenue Million Forecast, by Import Market Analysis (Value & Volume) 2020 & 2033
- Table 32: Global Hazelnut Industry Revenue Million Forecast, by Export Market Analysis (Value & Volume) 2020 & 2033
- Table 33: Global Hazelnut Industry Revenue Million Forecast, by Price Trend Analysis 2020 & 2033
- Table 34: Global Hazelnut Industry Revenue Million Forecast, by Country 2020 & 2033
- Table 35: China Hazelnut Industry Revenue (Million) Forecast, by Application 2020 & 2033
- Table 36: Australia Hazelnut Industry Revenue (Million) Forecast, by Application 2020 & 2033
- Table 37: India Hazelnut Industry Revenue (Million) Forecast, by Application 2020 & 2033
- Table 38: Japan Hazelnut Industry Revenue (Million) Forecast, by Application 2020 & 2033
- Table 39: Global Hazelnut Industry Revenue Million Forecast, by Production Analysis 2020 & 2033
- Table 40: Global Hazelnut Industry Revenue Million Forecast, by Consumption Analysis 2020 & 2033
- Table 41: Global Hazelnut Industry Revenue Million Forecast, by Import Market Analysis (Value & Volume) 2020 & 2033
- Table 42: Global Hazelnut Industry Revenue Million Forecast, by Export Market Analysis (Value & Volume) 2020 & 2033
- Table 43: Global Hazelnut Industry Revenue Million Forecast, by Price Trend Analysis 2020 & 2033
- Table 44: Global Hazelnut Industry Revenue Million Forecast, by Country 2020 & 2033
- Table 45: Brazil Hazelnut Industry Revenue (Million) Forecast, by Application 2020 & 2033
- Table 46: Argentina Hazelnut Industry Revenue (Million) Forecast, by Application 2020 & 2033
- Table 47: Global Hazelnut Industry Revenue Million Forecast, by Production Analysis 2020 & 2033
- Table 48: Global Hazelnut Industry Revenue Million Forecast, by Consumption Analysis 2020 & 2033
- Table 49: Global Hazelnut Industry Revenue Million Forecast, by Import Market Analysis (Value & Volume) 2020 & 2033
- Table 50: Global Hazelnut Industry Revenue Million Forecast, by Export Market Analysis (Value & Volume) 2020 & 2033
- Table 51: Global Hazelnut Industry Revenue Million Forecast, by Price Trend Analysis 2020 & 2033
- Table 52: Global Hazelnut Industry Revenue Million Forecast, by Country 2020 & 2033
- Table 53: Turkey Hazelnut Industry Revenue (Million) Forecast, by Application 2020 & 2033
- Table 54: South Africa Hazelnut Industry Revenue (Million) Forecast, by Application 2020 & 2033
Frequently Asked Questions
1. What is the projected Compound Annual Growth Rate (CAGR) of the Hazelnut Industry?
The projected CAGR is approximately 8.10%.
2. Which companies are prominent players in the Hazelnut Industry?
Key companies in the market include Ferrero, Mondelez International, Irca, Proell, Barry Callebaut.
3. What are the main segments of the Hazelnut Industry?
The market segments include Production Analysis, Consumption Analysis, Import Market Analysis (Value & Volume), Export Market Analysis (Value & Volume), Price Trend Analysis.
4. Can you provide details about the market size?
The market size is estimated to be USD 512.62 Million as of 2022.
5. What are some drivers contributing to market growth?
Increasing Demand for Garlic Due to Various Uses in Industries; Rising Demad of Organic Garlic; Increasing Government Initiatives.
6. What are the notable trends driving market growth?
High Demand from the Chocolate Industry.
7. Are there any restraints impacting market growth?
Lack of Technical Knowledge of Farmers; Price Fluctuations.
8. Can you provide examples of recent developments in the market?
N/A
9. What pricing options are available for accessing the report?
Pricing options include single-user, multi-user, and enterprise licenses priced at USD 4750, USD 5250, and USD 8750 respectively.
10. Is the market size provided in terms of value or volume?
The market size is provided in terms of value, measured in Million.
11. Are there any specific market keywords associated with the report?
Yes, the market keyword associated with the report is "Hazelnut Industry," which aids in identifying and referencing the specific market segment covered.
12. How do I determine which pricing option suits my needs best?
The pricing options vary based on user requirements and access needs. Individual users may opt for single-user licenses, while businesses requiring broader access may choose multi-user or enterprise licenses for cost-effective access to the report.
13. Are there any additional resources or data provided in the Hazelnut Industry report?
While the report offers comprehensive insights, it's advisable to review the specific contents or supplementary materials provided to ascertain if additional resources or data are available.
14. How can I stay updated on further developments or reports in the Hazelnut Industry?
To stay informed about further developments, trends, and reports in the Hazelnut Industry, consider subscribing to industry newsletters, following relevant companies and organizations, or regularly checking reputable industry news sources and publications.
Methodology
Step 1 - Identification of Relevant Samples Size from Population Database


Step 2 - Approaches for Defining Global Market Size (Value, Volume* & Price*)

Note*: In applicable scenarios
Step 3 - Data Sources
Primary Research
- Web Analytics
- Survey Reports
- Research Institute
- Latest Research Reports
- Opinion Leaders
Secondary Research
- Annual Reports
- White Paper
- Latest Press Release
- Industry Association
- Paid Database
- Investor Presentations

Step 4 - Data Triangulation
Involves using different sources of information in order to increase the validity of a study
These sources are likely to be stakeholders in a program - participants, other researchers, program staff, other community members, and so on.
Then we put all data in single framework & apply various statistical tools to find out the dynamic on the market.
During the analysis stage, feedback from the stakeholder groups would be compared to determine areas of agreement as well as areas of divergence