

Key Insights
The global helium market, valued at $3.36 billion in the 2025 base year, is projected for robust expansion. Anticipated to grow at a compound annual growth rate (CAGR) of 3.05%, this sustained growth is primarily driven by escalating demand from critical sectors including electronics and semiconductors, where helium is indispensable for advanced manufacturing processes such as leak detection and controlled atmosphere applications. The healthcare industry's reliance on helium for MRI and cryogenic technologies, alongside the aerospace and aviation sector's use in leak detection and testing, are significant contributors to this market's positive trajectory. While helium scarcity and price volatility present potential challenges, advancements in helium recovery and recycling technologies are expected to mitigate these concerns. The market is segmented by helium form, with liquid helium vital for cryogenics and gaseous helium prevalent in applications like breathing mixes and welding. Geographically, North America and Europe remain dominant, with the Asia-Pacific region showing substantial growth potential due to increasing industrialization and technological advancements.
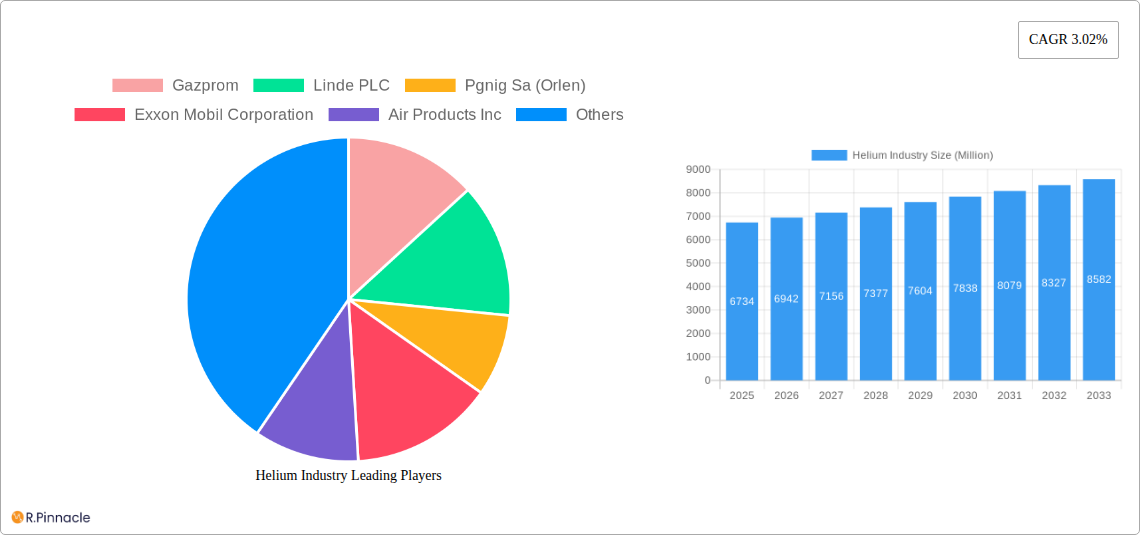
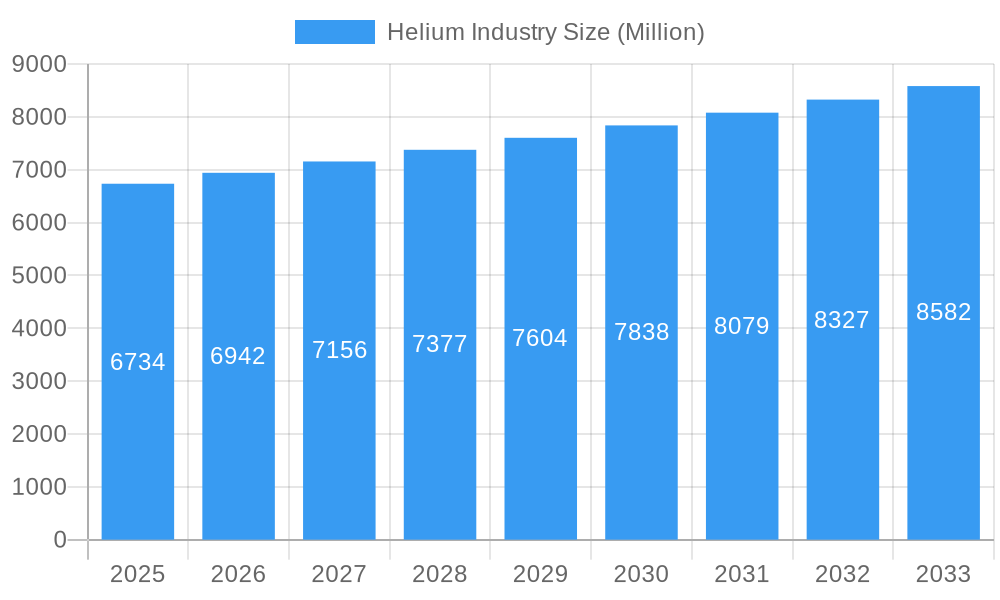
Helium Industry Market Size (In Billion)
The competitive landscape comprises major multinational corporations, including Linde PLC, Air Products Inc., and Air Liquide, alongside specialized regional players. These established entities leverage extensive infrastructure and global networks. Regional companies are increasingly influential, particularly in developing economies. Future market dynamics will be shaped by government regulations concerning helium conservation, technological innovations driving efficiency and sustainability, and broader economic growth within key end-user industries. The market's steady, moderate growth presents a stable investment opportunity, necessitating an understanding of potential supply chain risks and price fluctuations. Strategic diversification across applications and geographies will be crucial for market participants.
Helium Industry Company Market Share
Helium Industry Market Report: 2019-2033
This comprehensive report provides an in-depth analysis of the global helium industry, offering invaluable insights for industry professionals, investors, and strategic decision-makers. Covering the period from 2019 to 2033, with a base year of 2025, this report unveils the market dynamics, key players, and future outlook for this crucial sector. The report leverages a robust data-driven approach, providing detailed forecasts and analysis to facilitate informed business strategies. The total market size is projected to reach xx Million by 2033.
Helium Industry Market Structure & Innovation Trends
This section analyzes the competitive landscape of the helium industry, encompassing market concentration, innovation drivers, regulatory frameworks, and mergers & acquisitions (M&A) activity. The industry is characterized by a moderate level of concentration, with several major players holding significant market share. Gazprom, Linde PLC, Air Products Inc., and Air Liquide are among the prominent players, collectively commanding an estimated xx% of the global market share in 2025.
- Market Concentration: Oligopolistic, with a few dominant players.
- Innovation Drivers: Growing demand from emerging applications, particularly in cryogenics and leak detection.
- Regulatory Frameworks: Government regulations related to helium extraction and usage vary significantly across countries.
- Product Substitutes: Limited viable substitutes exist for helium in many applications.
- End-User Demographics: The report details end-user trends across key sectors.
- M&A Activity: Significant M&A activity has been observed in recent years, with deals valued at over xx Million in the past five years (specific deal values are detailed within the full report). These transactions reflect the industry's consolidation and efforts to secure helium resources.
Helium Industry Market Dynamics & Trends
The helium industry is a dynamic and evolving sector driven by a confluence of critical factors. This section provides an in-depth analysis of the forces shaping market growth, the transformative impact of technological advancements, and the intricate competitive dynamics at play. The market is robustly projected to experience a Compound Annual Growth Rate (CAGR) of approximately XX% during the forecast period spanning from 2025 to 2033. Several key growth drivers are fueling this upward trajectory. Paramount among these is the escalating demand from high-growth sectors such as electronics manufacturing and the advanced healthcare industry. Furthermore, the increasing integration of helium in cutting-edge applications like sophisticated leak detection systems and the burgeoning field of quantum computing is creating new avenues for market expansion. On the technological front, disruptions are primarily centered around the development and implementation of more efficient extraction techniques and advanced purification processes, aiming to enhance yield and reduce operational costs. The competitive landscape is characterized by intense rivalry among established global players. These companies are strategically focusing on cost optimization initiatives, reinforcing supply chain security to mitigate risks associated with helium's finite nature, and diversifying their product portfolios to cater to a broader range of applications. Market penetration in rapidly developing emerging economies also represents a significant factor influencing the overall growth trajectory and future market share distribution.
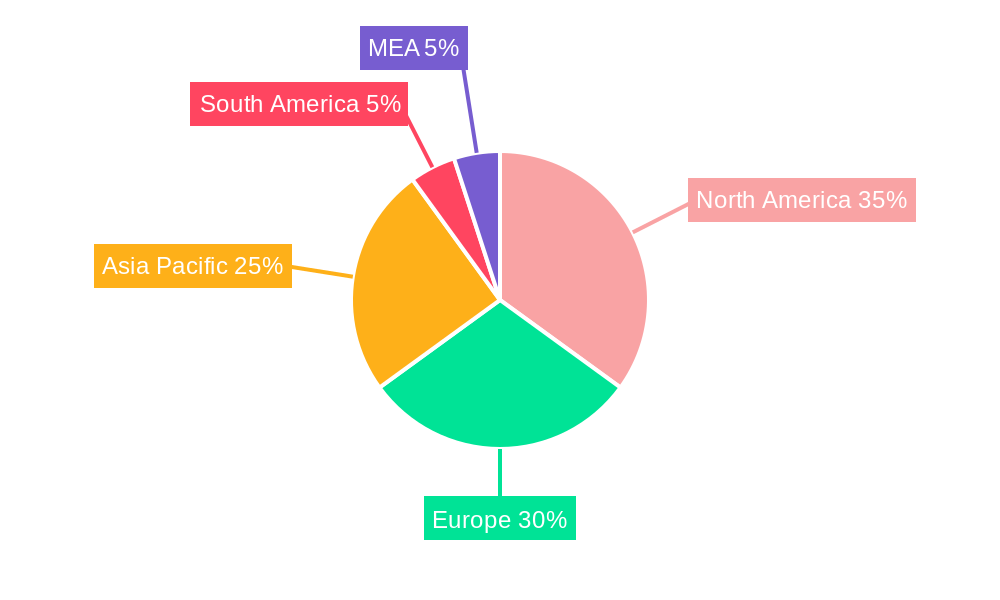
Dominant Regions & Segments in Helium Industry
This comprehensive section meticulously identifies and analyzes the leading geographic regions and the most influential market segments within the global helium industry. The report offers a granular performance analysis across various product phases, including both liquid and gaseous helium, and categorizes applications into critical areas such as breathing mixes for medical and diving purposes, cryogenics for scientific research and medical imaging (MRI), precise leak detection in industrial settings, specialized welding applications, and many others. Furthermore, it examines the role and impact of helium across diverse end-user industries, encompassing aerospace, advanced electronics, and the vital healthcare sector, among others.
-
Dominant Regions: Currently, the United States and Russia stand as the preeminent players, commanding the largest market shares. This dominance is attributable to their substantial proven helium reserves and well-established, extensive extraction and distribution infrastructure. However, the Asia-Pacific region is poised for significant and rapid growth, primarily driven by the burgeoning electronics manufacturing sector and the continuously expanding healthcare industry within its member nations.
-
Dominant Segments: Within the applications market, the cryogenics segment consistently holds a dominant position, underscoring its critical role in various scientific and industrial processes. The healthcare industry also emerges as a profoundly significant end-user sector, leveraging helium for critical medical technologies and treatments.
-
Key Regional Drivers:
- North America: This region benefits from robust and sustained demand emanating from its thriving electronics and healthcare sectors. Its advanced and reliable infrastructure further bolsters its leading position.
- Europe: While representing a relatively mature market, Europe demonstrates a strong focus on high-value, specialized helium applications, particularly in advanced research and niche industrial processes.
- Asia-Pacific: This region is experiencing exceptional growth rates, propelled by the surging demand from its rapidly expanding electronics and diverse industrial sectors.
A detailed and in-depth analysis of regional and segmental dominance, including the intricate interplay of economic policies, infrastructural development initiatives, and evolving governmental regulations, is comprehensively provided within the full market research report.
Helium Industry Product Innovations
Recent innovations focus on improving helium extraction techniques, enhancing purification processes, and developing more efficient storage and transportation methods. These innovations contribute to reduced costs and improved reliability of helium supply, thereby opening up new application areas and expanding market penetration. Companies are also exploring new applications of helium in emerging industries such as quantum computing and aerospace, highlighting a dynamic technological landscape.
Report Scope & Segmentation Analysis
This report provides a comprehensive segmentation analysis of the helium industry covering various phases (liquid and gas), applications (breathing mixes, cryogenics, leak detection, pressurizing and purging, welding, controlled atmosphere, and other applications) and end-user industries (aerospace and aircraft, electronics and semiconductors, nuclear power, healthcare, welding and metal fabrication, and other end-user industries). Each segment's growth projections, market sizes, and competitive dynamics are extensively analyzed. The report also delves into the historical period (2019-2024), the base year (2025), and the forecast period (2025-2033) to provide a comprehensive market overview.
Key Drivers of Helium Industry Growth
The growth of the helium industry is driven by several key factors. The increasing demand from various sectors, including healthcare, electronics, and aerospace, represents a significant driver. Technological advancements in helium extraction and purification processes are also contributing to the overall market expansion. Furthermore, supportive government policies and regulations in some regions are fostering investment and innovation within the industry.
Challenges in the Helium Industry Sector
The helium industry, despite its critical importance, is confronted with a unique set of significant challenges that impact its stability and growth trajectory. Chief among these is the inherent finite nature of helium reserves, which directly translates into inherent supply chain vulnerabilities and consequent price volatility. Fluctuations in global supply and demand, coupled with geopolitical factors, can lead to unpredictable price swings, posing forecasting challenges for businesses reliant on this critical resource. Furthermore, increasingly stringent environmental regulations in various regions are elevating the operational costs associated with helium extraction and processing, adding another layer of complexity to market dynamics. The competitive landscape, characterized by intense rivalry among industry players vying for limited resources and market share, further complicates the overall market structure. This report meticulously quantifies these multifaceted challenges and assesses their potential impact on the market's future trajectory, providing valuable insights for strategic planning.
Emerging Opportunities in Helium Industry
Emerging opportunities arise from the growing adoption of helium in novel applications, including quantum computing and leak detection in critical infrastructure. Expansion into new geographic markets, particularly in developing economies, offers significant potential. The development of more sustainable and efficient helium extraction and purification methods presents further opportunities for innovation and growth.
Leading Players in the Helium Industry Market
- Gazprom
- Linde PLC
- Pgnig Sa (Orlen)
- Exxon Mobil Corporation
- Air Products Inc
- NexAir LLC
- Gulf Cryo
- Matheson Tri-Gas Inc
- Iwatani Corporation
- Messer Group GmbH
- Qatarenergy Lng
- Air Liquide
- Weil Group
- Renergen
Key Developments in Helium Industry
July 2022: Helios Specialty Gases and Iwatani Corporation signed an agreement for Iwatani to supply liquid helium to Helios's facilities in Gujarat, Telangana, and Rajasthan. This expands Iwatani's market reach and solidifies Helios's supply chain.
April 2022: Linde signed a long-term helium off-take agreement with Freeport LNG to recover helium from Freeport's Texas production site. Linde's planned processing plant (starting in 2024) will add nearly 200 million cubic feet of helium to its portfolio, significantly impacting market supply.
Future Outlook for Helium Industry Market
The future outlook for the helium industry is exceptionally promising, characterized by substantial growth potential driven by an ever-expanding array of applications and evolving technological needs. The increasing demand from nascent and rapidly advancing technologies, such as advanced computing, sustainable energy solutions, and next-generation medical devices, coupled with the continuous expansion of established end-user industries, will serve as potent catalysts for market expansion. Strategic acquisitions and mergers are expected to play a significant role in market consolidation and the expansion of capabilities among key players. Furthermore, ongoing technological advancements aimed at improving extraction efficiency and exploring novel sources of helium will be crucial. The industry is also increasingly focusing on the development and implementation of sustainable extraction and utilization practices to address environmental concerns and ensure long-term resource availability. These combined factors are expected to continue shaping the industry's trajectory, driving innovation and market value. The comprehensive report provides detailed, data-driven forecasts and actionable strategic recommendations tailored to help stakeholders effectively navigate this dynamic and high-potential market landscape.
Helium Industry Segmentation
-
1. Phase
- 1.1. Liquid
- 1.2. Gas
-
2. Application
- 2.1. Breathing Mixes
- 2.2. Cryogenics
- 2.3. Leak Detection
- 2.4. Pressurizing and Purging
- 2.5. Welding
- 2.6. Controlled Atmosphere
- 2.7. Other Applications
-
3. End-user Industry
- 3.1. Aerospace and Aircraft
- 3.2. Electronics and Semiconductors
- 3.3. Nuclear Power
- 3.4. Healthcare
- 3.5. Welding and Metal Fabrication
- 3.6. Other End-user Industries
Helium Industry Segmentation By Geography
- 1. China
- 2. India
- 3. Japan
- 4. South Korea
- 5. Australia and New Zealand
-
6. Rest of Asia Pacific
- 6.1. North America
- 7. United States
- 8. Canada
-
9. Mexico
- 9.1. Europe
- 10. Germany
- 11. France
- 12. Italy
- 13. United Kingdom
- 14. Russia
-
15. Rest of Europe
- 15.1. Rest of the World
- 16. South America
- 17. Middle East and Africa
Helium Industry Regional Market Share
Geographic Coverage of Helium Industry
Helium Industry REPORT HIGHLIGHTS
| Aspects | Details |
|---|---|
| Study Period | 2020-2034 |
| Base Year | 2025 |
| Estimated Year | 2026 |
| Forecast Period | 2026-2034 |
| Historical Period | 2020-2025 |
| Growth Rate | CAGR of 3.05% from 2020-2034 |
| Segmentation |
|
Table of Contents
- 1. Introduction
- 1.1. Research Scope
- 1.2. Market Segmentation
- 1.3. Research Objective
- 1.4. Definitions and Assumptions
- 2. Executive Summary
- 2.1. Market Snapshot
- 3. Market Dynamics
- 3.1. Market Drivers
- 3.2. Market Restrains
- 3.3. Market Trends
- 3.4. Market Opportunities
- 4. Market Factor Analysis
- 4.1. Porters Five Forces
- 4.1.1. Bargaining Power of Suppliers
- 4.1.2. Bargaining Power of Buyers
- 4.1.3. Threat of New Entrants
- 4.1.4. Threat of Substitutes
- 4.1.5. Competitive Rivalry
- 4.2. PESTEL analysis
- 4.3. BCG Analysis
- 4.3.1. Stars (High Growth, High Market Share)
- 4.3.2. Cash Cows (Low Growth, High Market Share)
- 4.3.3. Question Mark (High Growth, Low Market Share)
- 4.3.4. Dogs (Low Growth, Low Market Share)
- 4.4. Ansoff Matrix Analysis
- 4.5. Supply Chain Analysis
- 4.6. Regulatory Landscape
- 4.7. Current Market Potential and Opportunity Assessment (TAM–SAM–SOM Framework)
- 4.8. PRI Analyst Note
- 4.1. Porters Five Forces
- 5. Market Analysis, Insights and Forecast 2021-2033
- 5.1. Market Analysis, Insights and Forecast - by Phase
- 5.1.1. Liquid
- 5.1.2. Gas
- 5.2. Market Analysis, Insights and Forecast - by Application
- 5.2.1. Breathing Mixes
- 5.2.2. Cryogenics
- 5.2.3. Leak Detection
- 5.2.4. Pressurizing and Purging
- 5.2.5. Welding
- 5.2.6. Controlled Atmosphere
- 5.2.7. Other Applications
- 5.3. Market Analysis, Insights and Forecast - by End-user Industry
- 5.3.1. Aerospace and Aircraft
- 5.3.2. Electronics and Semiconductors
- 5.3.3. Nuclear Power
- 5.3.4. Healthcare
- 5.3.5. Welding and Metal Fabrication
- 5.3.6. Other End-user Industries
- 5.4. Market Analysis, Insights and Forecast - by Region
- 5.4.1. China
- 5.4.2. India
- 5.4.3. Japan
- 5.4.4. South Korea
- 5.4.5. Australia and New Zealand
- 5.4.6. Rest of Asia Pacific
- 5.4.7. United States
- 5.4.8. Canada
- 5.4.9. Mexico
- 5.4.10. Germany
- 5.4.11. France
- 5.4.12. Italy
- 5.4.13. United Kingdom
- 5.4.14. Russia
- 5.4.15. Rest of Europe
- 5.4.16. South America
- 5.4.17. Middle East and Africa
- 5.1. Market Analysis, Insights and Forecast - by Phase
- 6. Global Helium Industry Analysis, Insights and Forecast, 2021-2033
- 6.1. Market Analysis, Insights and Forecast - by Phase
- 6.1.1. Liquid
- 6.1.2. Gas
- 6.2. Market Analysis, Insights and Forecast - by Application
- 6.2.1. Breathing Mixes
- 6.2.2. Cryogenics
- 6.2.3. Leak Detection
- 6.2.4. Pressurizing and Purging
- 6.2.5. Welding
- 6.2.6. Controlled Atmosphere
- 6.2.7. Other Applications
- 6.3. Market Analysis, Insights and Forecast - by End-user Industry
- 6.3.1. Aerospace and Aircraft
- 6.3.2. Electronics and Semiconductors
- 6.3.3. Nuclear Power
- 6.3.4. Healthcare
- 6.3.5. Welding and Metal Fabrication
- 6.3.6. Other End-user Industries
- 6.1. Market Analysis, Insights and Forecast - by Phase
- 7. China Helium Industry Analysis, Insights and Forecast, 2020-2032
- 7.1. Market Analysis, Insights and Forecast - by Phase
- 7.1.1. Liquid
- 7.1.2. Gas
- 7.2. Market Analysis, Insights and Forecast - by Application
- 7.2.1. Breathing Mixes
- 7.2.2. Cryogenics
- 7.2.3. Leak Detection
- 7.2.4. Pressurizing and Purging
- 7.2.5. Welding
- 7.2.6. Controlled Atmosphere
- 7.2.7. Other Applications
- 7.3. Market Analysis, Insights and Forecast - by End-user Industry
- 7.3.1. Aerospace and Aircraft
- 7.3.2. Electronics and Semiconductors
- 7.3.3. Nuclear Power
- 7.3.4. Healthcare
- 7.3.5. Welding and Metal Fabrication
- 7.3.6. Other End-user Industries
- 7.1. Market Analysis, Insights and Forecast - by Phase
- 8. India Helium Industry Analysis, Insights and Forecast, 2020-2032
- 8.1. Market Analysis, Insights and Forecast - by Phase
- 8.1.1. Liquid
- 8.1.2. Gas
- 8.2. Market Analysis, Insights and Forecast - by Application
- 8.2.1. Breathing Mixes
- 8.2.2. Cryogenics
- 8.2.3. Leak Detection
- 8.2.4. Pressurizing and Purging
- 8.2.5. Welding
- 8.2.6. Controlled Atmosphere
- 8.2.7. Other Applications
- 8.3. Market Analysis, Insights and Forecast - by End-user Industry
- 8.3.1. Aerospace and Aircraft
- 8.3.2. Electronics and Semiconductors
- 8.3.3. Nuclear Power
- 8.3.4. Healthcare
- 8.3.5. Welding and Metal Fabrication
- 8.3.6. Other End-user Industries
- 8.1. Market Analysis, Insights and Forecast - by Phase
- 9. Japan Helium Industry Analysis, Insights and Forecast, 2020-2032
- 9.1. Market Analysis, Insights and Forecast - by Phase
- 9.1.1. Liquid
- 9.1.2. Gas
- 9.2. Market Analysis, Insights and Forecast - by Application
- 9.2.1. Breathing Mixes
- 9.2.2. Cryogenics
- 9.2.3. Leak Detection
- 9.2.4. Pressurizing and Purging
- 9.2.5. Welding
- 9.2.6. Controlled Atmosphere
- 9.2.7. Other Applications
- 9.3. Market Analysis, Insights and Forecast - by End-user Industry
- 9.3.1. Aerospace and Aircraft
- 9.3.2. Electronics and Semiconductors
- 9.3.3. Nuclear Power
- 9.3.4. Healthcare
- 9.3.5. Welding and Metal Fabrication
- 9.3.6. Other End-user Industries
- 9.1. Market Analysis, Insights and Forecast - by Phase
- 10. South Korea Helium Industry Analysis, Insights and Forecast, 2020-2032
- 10.1. Market Analysis, Insights and Forecast - by Phase
- 10.1.1. Liquid
- 10.1.2. Gas
- 10.2. Market Analysis, Insights and Forecast - by Application
- 10.2.1. Breathing Mixes
- 10.2.2. Cryogenics
- 10.2.3. Leak Detection
- 10.2.4. Pressurizing and Purging
- 10.2.5. Welding
- 10.2.6. Controlled Atmosphere
- 10.2.7. Other Applications
- 10.3. Market Analysis, Insights and Forecast - by End-user Industry
- 10.3.1. Aerospace and Aircraft
- 10.3.2. Electronics and Semiconductors
- 10.3.3. Nuclear Power
- 10.3.4. Healthcare
- 10.3.5. Welding and Metal Fabrication
- 10.3.6. Other End-user Industries
- 10.1. Market Analysis, Insights and Forecast - by Phase
- 11. Australia and New Zealand Helium Industry Analysis, Insights and Forecast, 2020-2032
- 11.1. Market Analysis, Insights and Forecast - by Phase
- 11.1.1. Liquid
- 11.1.2. Gas
- 11.2. Market Analysis, Insights and Forecast - by Application
- 11.2.1. Breathing Mixes
- 11.2.2. Cryogenics
- 11.2.3. Leak Detection
- 11.2.4. Pressurizing and Purging
- 11.2.5. Welding
- 11.2.6. Controlled Atmosphere
- 11.2.7. Other Applications
- 11.3. Market Analysis, Insights and Forecast - by End-user Industry
- 11.3.1. Aerospace and Aircraft
- 11.3.2. Electronics and Semiconductors
- 11.3.3. Nuclear Power
- 11.3.4. Healthcare
- 11.3.5. Welding and Metal Fabrication
- 11.3.6. Other End-user Industries
- 11.1. Market Analysis, Insights and Forecast - by Phase
- 12. Rest of Asia Pacific Helium Industry Analysis, Insights and Forecast, 2020-2032
- 12.1. Market Analysis, Insights and Forecast - by Phase
- 12.1.1. Liquid
- 12.1.2. Gas
- 12.2. Market Analysis, Insights and Forecast - by Application
- 12.2.1. Breathing Mixes
- 12.2.2. Cryogenics
- 12.2.3. Leak Detection
- 12.2.4. Pressurizing and Purging
- 12.2.5. Welding
- 12.2.6. Controlled Atmosphere
- 12.2.7. Other Applications
- 12.3. Market Analysis, Insights and Forecast - by End-user Industry
- 12.3.1. Aerospace and Aircraft
- 12.3.2. Electronics and Semiconductors
- 12.3.3. Nuclear Power
- 12.3.4. Healthcare
- 12.3.5. Welding and Metal Fabrication
- 12.3.6. Other End-user Industries
- 12.1. Market Analysis, Insights and Forecast - by Phase
- 13. United States Helium Industry Analysis, Insights and Forecast, 2020-2032
- 13.1. Market Analysis, Insights and Forecast - by Phase
- 13.1.1. Liquid
- 13.1.2. Gas
- 13.2. Market Analysis, Insights and Forecast - by Application
- 13.2.1. Breathing Mixes
- 13.2.2. Cryogenics
- 13.2.3. Leak Detection
- 13.2.4. Pressurizing and Purging
- 13.2.5. Welding
- 13.2.6. Controlled Atmosphere
- 13.2.7. Other Applications
- 13.3. Market Analysis, Insights and Forecast - by End-user Industry
- 13.3.1. Aerospace and Aircraft
- 13.3.2. Electronics and Semiconductors
- 13.3.3. Nuclear Power
- 13.3.4. Healthcare
- 13.3.5. Welding and Metal Fabrication
- 13.3.6. Other End-user Industries
- 13.1. Market Analysis, Insights and Forecast - by Phase
- 14. Canada Helium Industry Analysis, Insights and Forecast, 2020-2032
- 14.1. Market Analysis, Insights and Forecast - by Phase
- 14.1.1. Liquid
- 14.1.2. Gas
- 14.2. Market Analysis, Insights and Forecast - by Application
- 14.2.1. Breathing Mixes
- 14.2.2. Cryogenics
- 14.2.3. Leak Detection
- 14.2.4. Pressurizing and Purging
- 14.2.5. Welding
- 14.2.6. Controlled Atmosphere
- 14.2.7. Other Applications
- 14.3. Market Analysis, Insights and Forecast - by End-user Industry
- 14.3.1. Aerospace and Aircraft
- 14.3.2. Electronics and Semiconductors
- 14.3.3. Nuclear Power
- 14.3.4. Healthcare
- 14.3.5. Welding and Metal Fabrication
- 14.3.6. Other End-user Industries
- 14.1. Market Analysis, Insights and Forecast - by Phase
- 15. Mexico Helium Industry Analysis, Insights and Forecast, 2020-2032
- 15.1. Market Analysis, Insights and Forecast - by Phase
- 15.1.1. Liquid
- 15.1.2. Gas
- 15.2. Market Analysis, Insights and Forecast - by Application
- 15.2.1. Breathing Mixes
- 15.2.2. Cryogenics
- 15.2.3. Leak Detection
- 15.2.4. Pressurizing and Purging
- 15.2.5. Welding
- 15.2.6. Controlled Atmosphere
- 15.2.7. Other Applications
- 15.3. Market Analysis, Insights and Forecast - by End-user Industry
- 15.3.1. Aerospace and Aircraft
- 15.3.2. Electronics and Semiconductors
- 15.3.3. Nuclear Power
- 15.3.4. Healthcare
- 15.3.5. Welding and Metal Fabrication
- 15.3.6. Other End-user Industries
- 15.1. Market Analysis, Insights and Forecast - by Phase
- 16. Germany Helium Industry Analysis, Insights and Forecast, 2020-2032
- 16.1. Market Analysis, Insights and Forecast - by Phase
- 16.1.1. Liquid
- 16.1.2. Gas
- 16.2. Market Analysis, Insights and Forecast - by Application
- 16.2.1. Breathing Mixes
- 16.2.2. Cryogenics
- 16.2.3. Leak Detection
- 16.2.4. Pressurizing and Purging
- 16.2.5. Welding
- 16.2.6. Controlled Atmosphere
- 16.2.7. Other Applications
- 16.3. Market Analysis, Insights and Forecast - by End-user Industry
- 16.3.1. Aerospace and Aircraft
- 16.3.2. Electronics and Semiconductors
- 16.3.3. Nuclear Power
- 16.3.4. Healthcare
- 16.3.5. Welding and Metal Fabrication
- 16.3.6. Other End-user Industries
- 16.1. Market Analysis, Insights and Forecast - by Phase
- 17. France Helium Industry Analysis, Insights and Forecast, 2020-2032
- 17.1. Market Analysis, Insights and Forecast - by Phase
- 17.1.1. Liquid
- 17.1.2. Gas
- 17.2. Market Analysis, Insights and Forecast - by Application
- 17.2.1. Breathing Mixes
- 17.2.2. Cryogenics
- 17.2.3. Leak Detection
- 17.2.4. Pressurizing and Purging
- 17.2.5. Welding
- 17.2.6. Controlled Atmosphere
- 17.2.7. Other Applications
- 17.3. Market Analysis, Insights and Forecast - by End-user Industry
- 17.3.1. Aerospace and Aircraft
- 17.3.2. Electronics and Semiconductors
- 17.3.3. Nuclear Power
- 17.3.4. Healthcare
- 17.3.5. Welding and Metal Fabrication
- 17.3.6. Other End-user Industries
- 17.1. Market Analysis, Insights and Forecast - by Phase
- 18. Italy Helium Industry Analysis, Insights and Forecast, 2020-2032
- 18.1. Market Analysis, Insights and Forecast - by Phase
- 18.1.1. Liquid
- 18.1.2. Gas
- 18.2. Market Analysis, Insights and Forecast - by Application
- 18.2.1. Breathing Mixes
- 18.2.2. Cryogenics
- 18.2.3. Leak Detection
- 18.2.4. Pressurizing and Purging
- 18.2.5. Welding
- 18.2.6. Controlled Atmosphere
- 18.2.7. Other Applications
- 18.3. Market Analysis, Insights and Forecast - by End-user Industry
- 18.3.1. Aerospace and Aircraft
- 18.3.2. Electronics and Semiconductors
- 18.3.3. Nuclear Power
- 18.3.4. Healthcare
- 18.3.5. Welding and Metal Fabrication
- 18.3.6. Other End-user Industries
- 18.1. Market Analysis, Insights and Forecast - by Phase
- 19. United Kingdom Helium Industry Analysis, Insights and Forecast, 2020-2032
- 19.1. Market Analysis, Insights and Forecast - by Phase
- 19.1.1. Liquid
- 19.1.2. Gas
- 19.2. Market Analysis, Insights and Forecast - by Application
- 19.2.1. Breathing Mixes
- 19.2.2. Cryogenics
- 19.2.3. Leak Detection
- 19.2.4. Pressurizing and Purging
- 19.2.5. Welding
- 19.2.6. Controlled Atmosphere
- 19.2.7. Other Applications
- 19.3. Market Analysis, Insights and Forecast - by End-user Industry
- 19.3.1. Aerospace and Aircraft
- 19.3.2. Electronics and Semiconductors
- 19.3.3. Nuclear Power
- 19.3.4. Healthcare
- 19.3.5. Welding and Metal Fabrication
- 19.3.6. Other End-user Industries
- 19.1. Market Analysis, Insights and Forecast - by Phase
- 20. Russia Helium Industry Analysis, Insights and Forecast, 2020-2032
- 20.1. Market Analysis, Insights and Forecast - by Phase
- 20.1.1. Liquid
- 20.1.2. Gas
- 20.2. Market Analysis, Insights and Forecast - by Application
- 20.2.1. Breathing Mixes
- 20.2.2. Cryogenics
- 20.2.3. Leak Detection
- 20.2.4. Pressurizing and Purging
- 20.2.5. Welding
- 20.2.6. Controlled Atmosphere
- 20.2.7. Other Applications
- 20.3. Market Analysis, Insights and Forecast - by End-user Industry
- 20.3.1. Aerospace and Aircraft
- 20.3.2. Electronics and Semiconductors
- 20.3.3. Nuclear Power
- 20.3.4. Healthcare
- 20.3.5. Welding and Metal Fabrication
- 20.3.6. Other End-user Industries
- 20.1. Market Analysis, Insights and Forecast - by Phase
- 21. Rest of Europe Helium Industry Analysis, Insights and Forecast, 2020-2032
- 21.1. Market Analysis, Insights and Forecast - by Phase
- 21.1.1. Liquid
- 21.1.2. Gas
- 21.2. Market Analysis, Insights and Forecast - by Application
- 21.2.1. Breathing Mixes
- 21.2.2. Cryogenics
- 21.2.3. Leak Detection
- 21.2.4. Pressurizing and Purging
- 21.2.5. Welding
- 21.2.6. Controlled Atmosphere
- 21.2.7. Other Applications
- 21.3. Market Analysis, Insights and Forecast - by End-user Industry
- 21.3.1. Aerospace and Aircraft
- 21.3.2. Electronics and Semiconductors
- 21.3.3. Nuclear Power
- 21.3.4. Healthcare
- 21.3.5. Welding and Metal Fabrication
- 21.3.6. Other End-user Industries
- 21.1. Market Analysis, Insights and Forecast - by Phase
- 22. South America Helium Industry Analysis, Insights and Forecast, 2020-2032
- 22.1. Market Analysis, Insights and Forecast - by Phase
- 22.1.1. Liquid
- 22.1.2. Gas
- 22.2. Market Analysis, Insights and Forecast - by Application
- 22.2.1. Breathing Mixes
- 22.2.2. Cryogenics
- 22.2.3. Leak Detection
- 22.2.4. Pressurizing and Purging
- 22.2.5. Welding
- 22.2.6. Controlled Atmosphere
- 22.2.7. Other Applications
- 22.3. Market Analysis, Insights and Forecast - by End-user Industry
- 22.3.1. Aerospace and Aircraft
- 22.3.2. Electronics and Semiconductors
- 22.3.3. Nuclear Power
- 22.3.4. Healthcare
- 22.3.5. Welding and Metal Fabrication
- 22.3.6. Other End-user Industries
- 22.1. Market Analysis, Insights and Forecast - by Phase
- 23. Middle East and Africa Helium Industry Analysis, Insights and Forecast, 2020-2032
- 23.1. Market Analysis, Insights and Forecast - by Phase
- 23.1.1. Liquid
- 23.1.2. Gas
- 23.2. Market Analysis, Insights and Forecast - by Application
- 23.2.1. Breathing Mixes
- 23.2.2. Cryogenics
- 23.2.3. Leak Detection
- 23.2.4. Pressurizing and Purging
- 23.2.5. Welding
- 23.2.6. Controlled Atmosphere
- 23.2.7. Other Applications
- 23.3. Market Analysis, Insights and Forecast - by End-user Industry
- 23.3.1. Aerospace and Aircraft
- 23.3.2. Electronics and Semiconductors
- 23.3.3. Nuclear Power
- 23.3.4. Healthcare
- 23.3.5. Welding and Metal Fabrication
- 23.3.6. Other End-user Industries
- 23.1. Market Analysis, Insights and Forecast - by Phase
- 24. Competitive Analysis
- 24.1. Company Profiles
- 24.1.1 Gazprom
- 24.1.1.1. Company Overview
- 24.1.1.2. Products
- 24.1.1.3. Company Financials
- 24.1.1.4. SWOT Analysis
- 24.1.2 Linde PLC
- 24.1.2.1. Company Overview
- 24.1.2.2. Products
- 24.1.2.3. Company Financials
- 24.1.2.4. SWOT Analysis
- 24.1.3 Pgnig Sa (Orlen)
- 24.1.3.1. Company Overview
- 24.1.3.2. Products
- 24.1.3.3. Company Financials
- 24.1.3.4. SWOT Analysis
- 24.1.4 Exxon Mobil Corporation
- 24.1.4.1. Company Overview
- 24.1.4.2. Products
- 24.1.4.3. Company Financials
- 24.1.4.4. SWOT Analysis
- 24.1.5 Air Products Inc
- 24.1.5.1. Company Overview
- 24.1.5.2. Products
- 24.1.5.3. Company Financials
- 24.1.5.4. SWOT Analysis
- 24.1.6 NexAir LLC
- 24.1.6.1. Company Overview
- 24.1.6.2. Products
- 24.1.6.3. Company Financials
- 24.1.6.4. SWOT Analysis
- 24.1.7 Gulf Cryo
- 24.1.7.1. Company Overview
- 24.1.7.2. Products
- 24.1.7.3. Company Financials
- 24.1.7.4. SWOT Analysis
- 24.1.8 Matheson Tri-Gas Inc
- 24.1.8.1. Company Overview
- 24.1.8.2. Products
- 24.1.8.3. Company Financials
- 24.1.8.4. SWOT Analysis
- 24.1.9 Iwatani Corporation
- 24.1.9.1. Company Overview
- 24.1.9.2. Products
- 24.1.9.3. Company Financials
- 24.1.9.4. SWOT Analysis
- 24.1.10 Messer Group GmbH
- 24.1.10.1. Company Overview
- 24.1.10.2. Products
- 24.1.10.3. Company Financials
- 24.1.10.4. SWOT Analysis
- 24.1.11 Qatarenergy Lng
- 24.1.11.1. Company Overview
- 24.1.11.2. Products
- 24.1.11.3. Company Financials
- 24.1.11.4. SWOT Analysis
- 24.1.12 Air Liquide
- 24.1.12.1. Company Overview
- 24.1.12.2. Products
- 24.1.12.3. Company Financials
- 24.1.12.4. SWOT Analysis
- 24.1.13 Weil Group*List Not Exhaustive
- 24.1.13.1. Company Overview
- 24.1.13.2. Products
- 24.1.13.3. Company Financials
- 24.1.13.4. SWOT Analysis
- 24.1.14 Renergen
- 24.1.14.1. Company Overview
- 24.1.14.2. Products
- 24.1.14.3. Company Financials
- 24.1.14.4. SWOT Analysis
- 24.1.1 Gazprom
- 24.2. Market Entropy
- 24.2.1 Company's Key Areas Served
- 24.2.2 Recent Developments
- 24.3. Company Market Share Analysis 2025
- 24.3.1 Top 5 Companies Market Share Analysis
- 24.3.2 Top 3 Companies Market Share Analysis
- 24.4. List of Potential Customers
- 25. Research Methodology
List of Figures
- Figure 1: Global Helium Industry Revenue Breakdown (billion, %) by Region 2025 & 2033
- Figure 2: Global Helium Industry Volume Breakdown (K Tons, %) by Region 2025 & 2033
- Figure 3: China Helium Industry Revenue (billion), by Phase 2025 & 2033
- Figure 4: China Helium Industry Volume (K Tons), by Phase 2025 & 2033
- Figure 5: China Helium Industry Revenue Share (%), by Phase 2025 & 2033
- Figure 6: China Helium Industry Volume Share (%), by Phase 2025 & 2033
- Figure 7: China Helium Industry Revenue (billion), by Application 2025 & 2033
- Figure 8: China Helium Industry Volume (K Tons), by Application 2025 & 2033
- Figure 9: China Helium Industry Revenue Share (%), by Application 2025 & 2033
- Figure 10: China Helium Industry Volume Share (%), by Application 2025 & 2033
- Figure 11: China Helium Industry Revenue (billion), by End-user Industry 2025 & 2033
- Figure 12: China Helium Industry Volume (K Tons), by End-user Industry 2025 & 2033
- Figure 13: China Helium Industry Revenue Share (%), by End-user Industry 2025 & 2033
- Figure 14: China Helium Industry Volume Share (%), by End-user Industry 2025 & 2033
- Figure 15: China Helium Industry Revenue (billion), by Country 2025 & 2033
- Figure 16: China Helium Industry Volume (K Tons), by Country 2025 & 2033
- Figure 17: China Helium Industry Revenue Share (%), by Country 2025 & 2033
- Figure 18: China Helium Industry Volume Share (%), by Country 2025 & 2033
- Figure 19: India Helium Industry Revenue (billion), by Phase 2025 & 2033
- Figure 20: India Helium Industry Volume (K Tons), by Phase 2025 & 2033
- Figure 21: India Helium Industry Revenue Share (%), by Phase 2025 & 2033
- Figure 22: India Helium Industry Volume Share (%), by Phase 2025 & 2033
- Figure 23: India Helium Industry Revenue (billion), by Application 2025 & 2033
- Figure 24: India Helium Industry Volume (K Tons), by Application 2025 & 2033
- Figure 25: India Helium Industry Revenue Share (%), by Application 2025 & 2033
- Figure 26: India Helium Industry Volume Share (%), by Application 2025 & 2033
- Figure 27: India Helium Industry Revenue (billion), by End-user Industry 2025 & 2033
- Figure 28: India Helium Industry Volume (K Tons), by End-user Industry 2025 & 2033
- Figure 29: India Helium Industry Revenue Share (%), by End-user Industry 2025 & 2033
- Figure 30: India Helium Industry Volume Share (%), by End-user Industry 2025 & 2033
- Figure 31: India Helium Industry Revenue (billion), by Country 2025 & 2033
- Figure 32: India Helium Industry Volume (K Tons), by Country 2025 & 2033
- Figure 33: India Helium Industry Revenue Share (%), by Country 2025 & 2033
- Figure 34: India Helium Industry Volume Share (%), by Country 2025 & 2033
- Figure 35: Japan Helium Industry Revenue (billion), by Phase 2025 & 2033
- Figure 36: Japan Helium Industry Volume (K Tons), by Phase 2025 & 2033
- Figure 37: Japan Helium Industry Revenue Share (%), by Phase 2025 & 2033
- Figure 38: Japan Helium Industry Volume Share (%), by Phase 2025 & 2033
- Figure 39: Japan Helium Industry Revenue (billion), by Application 2025 & 2033
- Figure 40: Japan Helium Industry Volume (K Tons), by Application 2025 & 2033
- Figure 41: Japan Helium Industry Revenue Share (%), by Application 2025 & 2033
- Figure 42: Japan Helium Industry Volume Share (%), by Application 2025 & 2033
- Figure 43: Japan Helium Industry Revenue (billion), by End-user Industry 2025 & 2033
- Figure 44: Japan Helium Industry Volume (K Tons), by End-user Industry 2025 & 2033
- Figure 45: Japan Helium Industry Revenue Share (%), by End-user Industry 2025 & 2033
- Figure 46: Japan Helium Industry Volume Share (%), by End-user Industry 2025 & 2033
- Figure 47: Japan Helium Industry Revenue (billion), by Country 2025 & 2033
- Figure 48: Japan Helium Industry Volume (K Tons), by Country 2025 & 2033
- Figure 49: Japan Helium Industry Revenue Share (%), by Country 2025 & 2033
- Figure 50: Japan Helium Industry Volume Share (%), by Country 2025 & 2033
- Figure 51: South Korea Helium Industry Revenue (billion), by Phase 2025 & 2033
- Figure 52: South Korea Helium Industry Volume (K Tons), by Phase 2025 & 2033
- Figure 53: South Korea Helium Industry Revenue Share (%), by Phase 2025 & 2033
- Figure 54: South Korea Helium Industry Volume Share (%), by Phase 2025 & 2033
- Figure 55: South Korea Helium Industry Revenue (billion), by Application 2025 & 2033
- Figure 56: South Korea Helium Industry Volume (K Tons), by Application 2025 & 2033
- Figure 57: South Korea Helium Industry Revenue Share (%), by Application 2025 & 2033
- Figure 58: South Korea Helium Industry Volume Share (%), by Application 2025 & 2033
- Figure 59: South Korea Helium Industry Revenue (billion), by End-user Industry 2025 & 2033
- Figure 60: South Korea Helium Industry Volume (K Tons), by End-user Industry 2025 & 2033
- Figure 61: South Korea Helium Industry Revenue Share (%), by End-user Industry 2025 & 2033
- Figure 62: South Korea Helium Industry Volume Share (%), by End-user Industry 2025 & 2033
- Figure 63: South Korea Helium Industry Revenue (billion), by Country 2025 & 2033
- Figure 64: South Korea Helium Industry Volume (K Tons), by Country 2025 & 2033
- Figure 65: South Korea Helium Industry Revenue Share (%), by Country 2025 & 2033
- Figure 66: South Korea Helium Industry Volume Share (%), by Country 2025 & 2033
- Figure 67: Australia and New Zealand Helium Industry Revenue (billion), by Phase 2025 & 2033
- Figure 68: Australia and New Zealand Helium Industry Volume (K Tons), by Phase 2025 & 2033
- Figure 69: Australia and New Zealand Helium Industry Revenue Share (%), by Phase 2025 & 2033
- Figure 70: Australia and New Zealand Helium Industry Volume Share (%), by Phase 2025 & 2033
- Figure 71: Australia and New Zealand Helium Industry Revenue (billion), by Application 2025 & 2033
- Figure 72: Australia and New Zealand Helium Industry Volume (K Tons), by Application 2025 & 2033
- Figure 73: Australia and New Zealand Helium Industry Revenue Share (%), by Application 2025 & 2033
- Figure 74: Australia and New Zealand Helium Industry Volume Share (%), by Application 2025 & 2033
- Figure 75: Australia and New Zealand Helium Industry Revenue (billion), by End-user Industry 2025 & 2033
- Figure 76: Australia and New Zealand Helium Industry Volume (K Tons), by End-user Industry 2025 & 2033
- Figure 77: Australia and New Zealand Helium Industry Revenue Share (%), by End-user Industry 2025 & 2033
- Figure 78: Australia and New Zealand Helium Industry Volume Share (%), by End-user Industry 2025 & 2033
- Figure 79: Australia and New Zealand Helium Industry Revenue (billion), by Country 2025 & 2033
- Figure 80: Australia and New Zealand Helium Industry Volume (K Tons), by Country 2025 & 2033
- Figure 81: Australia and New Zealand Helium Industry Revenue Share (%), by Country 2025 & 2033
- Figure 82: Australia and New Zealand Helium Industry Volume Share (%), by Country 2025 & 2033
- Figure 83: Rest of Asia Pacific Helium Industry Revenue (billion), by Phase 2025 & 2033
- Figure 84: Rest of Asia Pacific Helium Industry Volume (K Tons), by Phase 2025 & 2033
- Figure 85: Rest of Asia Pacific Helium Industry Revenue Share (%), by Phase 2025 & 2033
- Figure 86: Rest of Asia Pacific Helium Industry Volume Share (%), by Phase 2025 & 2033
- Figure 87: Rest of Asia Pacific Helium Industry Revenue (billion), by Application 2025 & 2033
- Figure 88: Rest of Asia Pacific Helium Industry Volume (K Tons), by Application 2025 & 2033
- Figure 89: Rest of Asia Pacific Helium Industry Revenue Share (%), by Application 2025 & 2033
- Figure 90: Rest of Asia Pacific Helium Industry Volume Share (%), by Application 2025 & 2033
- Figure 91: Rest of Asia Pacific Helium Industry Revenue (billion), by End-user Industry 2025 & 2033
- Figure 92: Rest of Asia Pacific Helium Industry Volume (K Tons), by End-user Industry 2025 & 2033
- Figure 93: Rest of Asia Pacific Helium Industry Revenue Share (%), by End-user Industry 2025 & 2033
- Figure 94: Rest of Asia Pacific Helium Industry Volume Share (%), by End-user Industry 2025 & 2033
- Figure 95: Rest of Asia Pacific Helium Industry Revenue (billion), by Country 2025 & 2033
- Figure 96: Rest of Asia Pacific Helium Industry Volume (K Tons), by Country 2025 & 2033
- Figure 97: Rest of Asia Pacific Helium Industry Revenue Share (%), by Country 2025 & 2033
- Figure 98: Rest of Asia Pacific Helium Industry Volume Share (%), by Country 2025 & 2033
- Figure 99: United States Helium Industry Revenue (billion), by Phase 2025 & 2033
- Figure 100: United States Helium Industry Volume (K Tons), by Phase 2025 & 2033
- Figure 101: United States Helium Industry Revenue Share (%), by Phase 2025 & 2033
- Figure 102: United States Helium Industry Volume Share (%), by Phase 2025 & 2033
- Figure 103: United States Helium Industry Revenue (billion), by Application 2025 & 2033
- Figure 104: United States Helium Industry Volume (K Tons), by Application 2025 & 2033
- Figure 105: United States Helium Industry Revenue Share (%), by Application 2025 & 2033
- Figure 106: United States Helium Industry Volume Share (%), by Application 2025 & 2033
- Figure 107: United States Helium Industry Revenue (billion), by End-user Industry 2025 & 2033
- Figure 108: United States Helium Industry Volume (K Tons), by End-user Industry 2025 & 2033
- Figure 109: United States Helium Industry Revenue Share (%), by End-user Industry 2025 & 2033
- Figure 110: United States Helium Industry Volume Share (%), by End-user Industry 2025 & 2033
- Figure 111: United States Helium Industry Revenue (billion), by Country 2025 & 2033
- Figure 112: United States Helium Industry Volume (K Tons), by Country 2025 & 2033
- Figure 113: United States Helium Industry Revenue Share (%), by Country 2025 & 2033
- Figure 114: United States Helium Industry Volume Share (%), by Country 2025 & 2033
- Figure 115: Canada Helium Industry Revenue (billion), by Phase 2025 & 2033
- Figure 116: Canada Helium Industry Volume (K Tons), by Phase 2025 & 2033
- Figure 117: Canada Helium Industry Revenue Share (%), by Phase 2025 & 2033
- Figure 118: Canada Helium Industry Volume Share (%), by Phase 2025 & 2033
- Figure 119: Canada Helium Industry Revenue (billion), by Application 2025 & 2033
- Figure 120: Canada Helium Industry Volume (K Tons), by Application 2025 & 2033
- Figure 121: Canada Helium Industry Revenue Share (%), by Application 2025 & 2033
- Figure 122: Canada Helium Industry Volume Share (%), by Application 2025 & 2033
- Figure 123: Canada Helium Industry Revenue (billion), by End-user Industry 2025 & 2033
- Figure 124: Canada Helium Industry Volume (K Tons), by End-user Industry 2025 & 2033
- Figure 125: Canada Helium Industry Revenue Share (%), by End-user Industry 2025 & 2033
- Figure 126: Canada Helium Industry Volume Share (%), by End-user Industry 2025 & 2033
- Figure 127: Canada Helium Industry Revenue (billion), by Country 2025 & 2033
- Figure 128: Canada Helium Industry Volume (K Tons), by Country 2025 & 2033
- Figure 129: Canada Helium Industry Revenue Share (%), by Country 2025 & 2033
- Figure 130: Canada Helium Industry Volume Share (%), by Country 2025 & 2033
- Figure 131: Mexico Helium Industry Revenue (billion), by Phase 2025 & 2033
- Figure 132: Mexico Helium Industry Volume (K Tons), by Phase 2025 & 2033
- Figure 133: Mexico Helium Industry Revenue Share (%), by Phase 2025 & 2033
- Figure 134: Mexico Helium Industry Volume Share (%), by Phase 2025 & 2033
- Figure 135: Mexico Helium Industry Revenue (billion), by Application 2025 & 2033
- Figure 136: Mexico Helium Industry Volume (K Tons), by Application 2025 & 2033
- Figure 137: Mexico Helium Industry Revenue Share (%), by Application 2025 & 2033
- Figure 138: Mexico Helium Industry Volume Share (%), by Application 2025 & 2033
- Figure 139: Mexico Helium Industry Revenue (billion), by End-user Industry 2025 & 2033
- Figure 140: Mexico Helium Industry Volume (K Tons), by End-user Industry 2025 & 2033
- Figure 141: Mexico Helium Industry Revenue Share (%), by End-user Industry 2025 & 2033
- Figure 142: Mexico Helium Industry Volume Share (%), by End-user Industry 2025 & 2033
- Figure 143: Mexico Helium Industry Revenue (billion), by Country 2025 & 2033
- Figure 144: Mexico Helium Industry Volume (K Tons), by Country 2025 & 2033
- Figure 145: Mexico Helium Industry Revenue Share (%), by Country 2025 & 2033
- Figure 146: Mexico Helium Industry Volume Share (%), by Country 2025 & 2033
- Figure 147: Germany Helium Industry Revenue (billion), by Phase 2025 & 2033
- Figure 148: Germany Helium Industry Volume (K Tons), by Phase 2025 & 2033
- Figure 149: Germany Helium Industry Revenue Share (%), by Phase 2025 & 2033
- Figure 150: Germany Helium Industry Volume Share (%), by Phase 2025 & 2033
- Figure 151: Germany Helium Industry Revenue (billion), by Application 2025 & 2033
- Figure 152: Germany Helium Industry Volume (K Tons), by Application 2025 & 2033
- Figure 153: Germany Helium Industry Revenue Share (%), by Application 2025 & 2033
- Figure 154: Germany Helium Industry Volume Share (%), by Application 2025 & 2033
- Figure 155: Germany Helium Industry Revenue (billion), by End-user Industry 2025 & 2033
- Figure 156: Germany Helium Industry Volume (K Tons), by End-user Industry 2025 & 2033
- Figure 157: Germany Helium Industry Revenue Share (%), by End-user Industry 2025 & 2033
- Figure 158: Germany Helium Industry Volume Share (%), by End-user Industry 2025 & 2033
- Figure 159: Germany Helium Industry Revenue (billion), by Country 2025 & 2033
- Figure 160: Germany Helium Industry Volume (K Tons), by Country 2025 & 2033
- Figure 161: Germany Helium Industry Revenue Share (%), by Country 2025 & 2033
- Figure 162: Germany Helium Industry Volume Share (%), by Country 2025 & 2033
- Figure 163: France Helium Industry Revenue (billion), by Phase 2025 & 2033
- Figure 164: France Helium Industry Volume (K Tons), by Phase 2025 & 2033
- Figure 165: France Helium Industry Revenue Share (%), by Phase 2025 & 2033
- Figure 166: France Helium Industry Volume Share (%), by Phase 2025 & 2033
- Figure 167: France Helium Industry Revenue (billion), by Application 2025 & 2033
- Figure 168: France Helium Industry Volume (K Tons), by Application 2025 & 2033
- Figure 169: France Helium Industry Revenue Share (%), by Application 2025 & 2033
- Figure 170: France Helium Industry Volume Share (%), by Application 2025 & 2033
- Figure 171: France Helium Industry Revenue (billion), by End-user Industry 2025 & 2033
- Figure 172: France Helium Industry Volume (K Tons), by End-user Industry 2025 & 2033
- Figure 173: France Helium Industry Revenue Share (%), by End-user Industry 2025 & 2033
- Figure 174: France Helium Industry Volume Share (%), by End-user Industry 2025 & 2033
- Figure 175: France Helium Industry Revenue (billion), by Country 2025 & 2033
- Figure 176: France Helium Industry Volume (K Tons), by Country 2025 & 2033
- Figure 177: France Helium Industry Revenue Share (%), by Country 2025 & 2033
- Figure 178: France Helium Industry Volume Share (%), by Country 2025 & 2033
- Figure 179: Italy Helium Industry Revenue (billion), by Phase 2025 & 2033
- Figure 180: Italy Helium Industry Volume (K Tons), by Phase 2025 & 2033
- Figure 181: Italy Helium Industry Revenue Share (%), by Phase 2025 & 2033
- Figure 182: Italy Helium Industry Volume Share (%), by Phase 2025 & 2033
- Figure 183: Italy Helium Industry Revenue (billion), by Application 2025 & 2033
- Figure 184: Italy Helium Industry Volume (K Tons), by Application 2025 & 2033
- Figure 185: Italy Helium Industry Revenue Share (%), by Application 2025 & 2033
- Figure 186: Italy Helium Industry Volume Share (%), by Application 2025 & 2033
- Figure 187: Italy Helium Industry Revenue (billion), by End-user Industry 2025 & 2033
- Figure 188: Italy Helium Industry Volume (K Tons), by End-user Industry 2025 & 2033
- Figure 189: Italy Helium Industry Revenue Share (%), by End-user Industry 2025 & 2033
- Figure 190: Italy Helium Industry Volume Share (%), by End-user Industry 2025 & 2033
- Figure 191: Italy Helium Industry Revenue (billion), by Country 2025 & 2033
- Figure 192: Italy Helium Industry Volume (K Tons), by Country 2025 & 2033
- Figure 193: Italy Helium Industry Revenue Share (%), by Country 2025 & 2033
- Figure 194: Italy Helium Industry Volume Share (%), by Country 2025 & 2033
- Figure 195: United Kingdom Helium Industry Revenue (billion), by Phase 2025 & 2033
- Figure 196: United Kingdom Helium Industry Volume (K Tons), by Phase 2025 & 2033
- Figure 197: United Kingdom Helium Industry Revenue Share (%), by Phase 2025 & 2033
- Figure 198: United Kingdom Helium Industry Volume Share (%), by Phase 2025 & 2033
- Figure 199: United Kingdom Helium Industry Revenue (billion), by Application 2025 & 2033
- Figure 200: United Kingdom Helium Industry Volume (K Tons), by Application 2025 & 2033
- Figure 201: United Kingdom Helium Industry Revenue Share (%), by Application 2025 & 2033
- Figure 202: United Kingdom Helium Industry Volume Share (%), by Application 2025 & 2033
- Figure 203: United Kingdom Helium Industry Revenue (billion), by End-user Industry 2025 & 2033
- Figure 204: United Kingdom Helium Industry Volume (K Tons), by End-user Industry 2025 & 2033
- Figure 205: United Kingdom Helium Industry Revenue Share (%), by End-user Industry 2025 & 2033
- Figure 206: United Kingdom Helium Industry Volume Share (%), by End-user Industry 2025 & 2033
- Figure 207: United Kingdom Helium Industry Revenue (billion), by Country 2025 & 2033
- Figure 208: United Kingdom Helium Industry Volume (K Tons), by Country 2025 & 2033
- Figure 209: United Kingdom Helium Industry Revenue Share (%), by Country 2025 & 2033
- Figure 210: United Kingdom Helium Industry Volume Share (%), by Country 2025 & 2033
- Figure 211: Russia Helium Industry Revenue (billion), by Phase 2025 & 2033
- Figure 212: Russia Helium Industry Volume (K Tons), by Phase 2025 & 2033
- Figure 213: Russia Helium Industry Revenue Share (%), by Phase 2025 & 2033
- Figure 214: Russia Helium Industry Volume Share (%), by Phase 2025 & 2033
- Figure 215: Russia Helium Industry Revenue (billion), by Application 2025 & 2033
- Figure 216: Russia Helium Industry Volume (K Tons), by Application 2025 & 2033
- Figure 217: Russia Helium Industry Revenue Share (%), by Application 2025 & 2033
- Figure 218: Russia Helium Industry Volume Share (%), by Application 2025 & 2033
- Figure 219: Russia Helium Industry Revenue (billion), by End-user Industry 2025 & 2033
- Figure 220: Russia Helium Industry Volume (K Tons), by End-user Industry 2025 & 2033
- Figure 221: Russia Helium Industry Revenue Share (%), by End-user Industry 2025 & 2033
- Figure 222: Russia Helium Industry Volume Share (%), by End-user Industry 2025 & 2033
- Figure 223: Russia Helium Industry Revenue (billion), by Country 2025 & 2033
- Figure 224: Russia Helium Industry Volume (K Tons), by Country 2025 & 2033
- Figure 225: Russia Helium Industry Revenue Share (%), by Country 2025 & 2033
- Figure 226: Russia Helium Industry Volume Share (%), by Country 2025 & 2033
- Figure 227: Rest of Europe Helium Industry Revenue (billion), by Phase 2025 & 2033
- Figure 228: Rest of Europe Helium Industry Volume (K Tons), by Phase 2025 & 2033
- Figure 229: Rest of Europe Helium Industry Revenue Share (%), by Phase 2025 & 2033
- Figure 230: Rest of Europe Helium Industry Volume Share (%), by Phase 2025 & 2033
- Figure 231: Rest of Europe Helium Industry Revenue (billion), by Application 2025 & 2033
- Figure 232: Rest of Europe Helium Industry Volume (K Tons), by Application 2025 & 2033
- Figure 233: Rest of Europe Helium Industry Revenue Share (%), by Application 2025 & 2033
- Figure 234: Rest of Europe Helium Industry Volume Share (%), by Application 2025 & 2033
- Figure 235: Rest of Europe Helium Industry Revenue (billion), by End-user Industry 2025 & 2033
- Figure 236: Rest of Europe Helium Industry Volume (K Tons), by End-user Industry 2025 & 2033
- Figure 237: Rest of Europe Helium Industry Revenue Share (%), by End-user Industry 2025 & 2033
- Figure 238: Rest of Europe Helium Industry Volume Share (%), by End-user Industry 2025 & 2033
- Figure 239: Rest of Europe Helium Industry Revenue (billion), by Country 2025 & 2033
- Figure 240: Rest of Europe Helium Industry Volume (K Tons), by Country 2025 & 2033
- Figure 241: Rest of Europe Helium Industry Revenue Share (%), by Country 2025 & 2033
- Figure 242: Rest of Europe Helium Industry Volume Share (%), by Country 2025 & 2033
- Figure 243: South America Helium Industry Revenue (billion), by Phase 2025 & 2033
- Figure 244: South America Helium Industry Volume (K Tons), by Phase 2025 & 2033
- Figure 245: South America Helium Industry Revenue Share (%), by Phase 2025 & 2033
- Figure 246: South America Helium Industry Volume Share (%), by Phase 2025 & 2033
- Figure 247: South America Helium Industry Revenue (billion), by Application 2025 & 2033
- Figure 248: South America Helium Industry Volume (K Tons), by Application 2025 & 2033
- Figure 249: South America Helium Industry Revenue Share (%), by Application 2025 & 2033
- Figure 250: South America Helium Industry Volume Share (%), by Application 2025 & 2033
- Figure 251: South America Helium Industry Revenue (billion), by End-user Industry 2025 & 2033
- Figure 252: South America Helium Industry Volume (K Tons), by End-user Industry 2025 & 2033
- Figure 253: South America Helium Industry Revenue Share (%), by End-user Industry 2025 & 2033
- Figure 254: South America Helium Industry Volume Share (%), by End-user Industry 2025 & 2033
- Figure 255: South America Helium Industry Revenue (billion), by Country 2025 & 2033
- Figure 256: South America Helium Industry Volume (K Tons), by Country 2025 & 2033
- Figure 257: South America Helium Industry Revenue Share (%), by Country 2025 & 2033
- Figure 258: South America Helium Industry Volume Share (%), by Country 2025 & 2033
- Figure 259: Middle East and Africa Helium Industry Revenue (billion), by Phase 2025 & 2033
- Figure 260: Middle East and Africa Helium Industry Volume (K Tons), by Phase 2025 & 2033
- Figure 261: Middle East and Africa Helium Industry Revenue Share (%), by Phase 2025 & 2033
- Figure 262: Middle East and Africa Helium Industry Volume Share (%), by Phase 2025 & 2033
- Figure 263: Middle East and Africa Helium Industry Revenue (billion), by Application 2025 & 2033
- Figure 264: Middle East and Africa Helium Industry Volume (K Tons), by Application 2025 & 2033
- Figure 265: Middle East and Africa Helium Industry Revenue Share (%), by Application 2025 & 2033
- Figure 266: Middle East and Africa Helium Industry Volume Share (%), by Application 2025 & 2033
- Figure 267: Middle East and Africa Helium Industry Revenue (billion), by End-user Industry 2025 & 2033
- Figure 268: Middle East and Africa Helium Industry Volume (K Tons), by End-user Industry 2025 & 2033
- Figure 269: Middle East and Africa Helium Industry Revenue Share (%), by End-user Industry 2025 & 2033
- Figure 270: Middle East and Africa Helium Industry Volume Share (%), by End-user Industry 2025 & 2033
- Figure 271: Middle East and Africa Helium Industry Revenue (billion), by Country 2025 & 2033
- Figure 272: Middle East and Africa Helium Industry Volume (K Tons), by Country 2025 & 2033
- Figure 273: Middle East and Africa Helium Industry Revenue Share (%), by Country 2025 & 2033
- Figure 274: Middle East and Africa Helium Industry Volume Share (%), by Country 2025 & 2033
List of Tables
- Table 1: Global Helium Industry Revenue billion Forecast, by Phase 2020 & 2033
- Table 2: Global Helium Industry Volume K Tons Forecast, by Phase 2020 & 2033
- Table 3: Global Helium Industry Revenue billion Forecast, by Application 2020 & 2033
- Table 4: Global Helium Industry Volume K Tons Forecast, by Application 2020 & 2033
- Table 5: Global Helium Industry Revenue billion Forecast, by End-user Industry 2020 & 2033
- Table 6: Global Helium Industry Volume K Tons Forecast, by End-user Industry 2020 & 2033
- Table 7: Global Helium Industry Revenue billion Forecast, by Region 2020 & 2033
- Table 8: Global Helium Industry Volume K Tons Forecast, by Region 2020 & 2033
- Table 9: Global Helium Industry Revenue billion Forecast, by Phase 2020 & 2033
- Table 10: Global Helium Industry Volume K Tons Forecast, by Phase 2020 & 2033
- Table 11: Global Helium Industry Revenue billion Forecast, by Application 2020 & 2033
- Table 12: Global Helium Industry Volume K Tons Forecast, by Application 2020 & 2033
- Table 13: Global Helium Industry Revenue billion Forecast, by End-user Industry 2020 & 2033
- Table 14: Global Helium Industry Volume K Tons Forecast, by End-user Industry 2020 & 2033
- Table 15: Global Helium Industry Revenue billion Forecast, by Country 2020 & 2033
- Table 16: Global Helium Industry Volume K Tons Forecast, by Country 2020 & 2033
- Table 17: Global Helium Industry Revenue billion Forecast, by Phase 2020 & 2033
- Table 18: Global Helium Industry Volume K Tons Forecast, by Phase 2020 & 2033
- Table 19: Global Helium Industry Revenue billion Forecast, by Application 2020 & 2033
- Table 20: Global Helium Industry Volume K Tons Forecast, by Application 2020 & 2033
- Table 21: Global Helium Industry Revenue billion Forecast, by End-user Industry 2020 & 2033
- Table 22: Global Helium Industry Volume K Tons Forecast, by End-user Industry 2020 & 2033
- Table 23: Global Helium Industry Revenue billion Forecast, by Country 2020 & 2033
- Table 24: Global Helium Industry Volume K Tons Forecast, by Country 2020 & 2033
- Table 25: Global Helium Industry Revenue billion Forecast, by Phase 2020 & 2033
- Table 26: Global Helium Industry Volume K Tons Forecast, by Phase 2020 & 2033
- Table 27: Global Helium Industry Revenue billion Forecast, by Application 2020 & 2033
- Table 28: Global Helium Industry Volume K Tons Forecast, by Application 2020 & 2033
- Table 29: Global Helium Industry Revenue billion Forecast, by End-user Industry 2020 & 2033
- Table 30: Global Helium Industry Volume K Tons Forecast, by End-user Industry 2020 & 2033
- Table 31: Global Helium Industry Revenue billion Forecast, by Country 2020 & 2033
- Table 32: Global Helium Industry Volume K Tons Forecast, by Country 2020 & 2033
- Table 33: Global Helium Industry Revenue billion Forecast, by Phase 2020 & 2033
- Table 34: Global Helium Industry Volume K Tons Forecast, by Phase 2020 & 2033
- Table 35: Global Helium Industry Revenue billion Forecast, by Application 2020 & 2033
- Table 36: Global Helium Industry Volume K Tons Forecast, by Application 2020 & 2033
- Table 37: Global Helium Industry Revenue billion Forecast, by End-user Industry 2020 & 2033
- Table 38: Global Helium Industry Volume K Tons Forecast, by End-user Industry 2020 & 2033
- Table 39: Global Helium Industry Revenue billion Forecast, by Country 2020 & 2033
- Table 40: Global Helium Industry Volume K Tons Forecast, by Country 2020 & 2033
- Table 41: Global Helium Industry Revenue billion Forecast, by Phase 2020 & 2033
- Table 42: Global Helium Industry Volume K Tons Forecast, by Phase 2020 & 2033
- Table 43: Global Helium Industry Revenue billion Forecast, by Application 2020 & 2033
- Table 44: Global Helium Industry Volume K Tons Forecast, by Application 2020 & 2033
- Table 45: Global Helium Industry Revenue billion Forecast, by End-user Industry 2020 & 2033
- Table 46: Global Helium Industry Volume K Tons Forecast, by End-user Industry 2020 & 2033
- Table 47: Global Helium Industry Revenue billion Forecast, by Country 2020 & 2033
- Table 48: Global Helium Industry Volume K Tons Forecast, by Country 2020 & 2033
- Table 49: Global Helium Industry Revenue billion Forecast, by Phase 2020 & 2033
- Table 50: Global Helium Industry Volume K Tons Forecast, by Phase 2020 & 2033
- Table 51: Global Helium Industry Revenue billion Forecast, by Application 2020 & 2033
- Table 52: Global Helium Industry Volume K Tons Forecast, by Application 2020 & 2033
- Table 53: Global Helium Industry Revenue billion Forecast, by End-user Industry 2020 & 2033
- Table 54: Global Helium Industry Volume K Tons Forecast, by End-user Industry 2020 & 2033
- Table 55: Global Helium Industry Revenue billion Forecast, by Country 2020 & 2033
- Table 56: Global Helium Industry Volume K Tons Forecast, by Country 2020 & 2033
- Table 57: North America Helium Industry Revenue (billion) Forecast, by Application 2020 & 2033
- Table 58: North America Helium Industry Volume (K Tons) Forecast, by Application 2020 & 2033
- Table 59: Global Helium Industry Revenue billion Forecast, by Phase 2020 & 2033
- Table 60: Global Helium Industry Volume K Tons Forecast, by Phase 2020 & 2033
- Table 61: Global Helium Industry Revenue billion Forecast, by Application 2020 & 2033
- Table 62: Global Helium Industry Volume K Tons Forecast, by Application 2020 & 2033
- Table 63: Global Helium Industry Revenue billion Forecast, by End-user Industry 2020 & 2033
- Table 64: Global Helium Industry Volume K Tons Forecast, by End-user Industry 2020 & 2033
- Table 65: Global Helium Industry Revenue billion Forecast, by Country 2020 & 2033
- Table 66: Global Helium Industry Volume K Tons Forecast, by Country 2020 & 2033
- Table 67: Global Helium Industry Revenue billion Forecast, by Phase 2020 & 2033
- Table 68: Global Helium Industry Volume K Tons Forecast, by Phase 2020 & 2033
- Table 69: Global Helium Industry Revenue billion Forecast, by Application 2020 & 2033
- Table 70: Global Helium Industry Volume K Tons Forecast, by Application 2020 & 2033
- Table 71: Global Helium Industry Revenue billion Forecast, by End-user Industry 2020 & 2033
- Table 72: Global Helium Industry Volume K Tons Forecast, by End-user Industry 2020 & 2033
- Table 73: Global Helium Industry Revenue billion Forecast, by Country 2020 & 2033
- Table 74: Global Helium Industry Volume K Tons Forecast, by Country 2020 & 2033
- Table 75: Global Helium Industry Revenue billion Forecast, by Phase 2020 & 2033
- Table 76: Global Helium Industry Volume K Tons Forecast, by Phase 2020 & 2033
- Table 77: Global Helium Industry Revenue billion Forecast, by Application 2020 & 2033
- Table 78: Global Helium Industry Volume K Tons Forecast, by Application 2020 & 2033
- Table 79: Global Helium Industry Revenue billion Forecast, by End-user Industry 2020 & 2033
- Table 80: Global Helium Industry Volume K Tons Forecast, by End-user Industry 2020 & 2033
- Table 81: Global Helium Industry Revenue billion Forecast, by Country 2020 & 2033
- Table 82: Global Helium Industry Volume K Tons Forecast, by Country 2020 & 2033
- Table 83: Europe Helium Industry Revenue (billion) Forecast, by Application 2020 & 2033
- Table 84: Europe Helium Industry Volume (K Tons) Forecast, by Application 2020 & 2033
- Table 85: Global Helium Industry Revenue billion Forecast, by Phase 2020 & 2033
- Table 86: Global Helium Industry Volume K Tons Forecast, by Phase 2020 & 2033
- Table 87: Global Helium Industry Revenue billion Forecast, by Application 2020 & 2033
- Table 88: Global Helium Industry Volume K Tons Forecast, by Application 2020 & 2033
- Table 89: Global Helium Industry Revenue billion Forecast, by End-user Industry 2020 & 2033
- Table 90: Global Helium Industry Volume K Tons Forecast, by End-user Industry 2020 & 2033
- Table 91: Global Helium Industry Revenue billion Forecast, by Country 2020 & 2033
- Table 92: Global Helium Industry Volume K Tons Forecast, by Country 2020 & 2033
- Table 93: Global Helium Industry Revenue billion Forecast, by Phase 2020 & 2033
- Table 94: Global Helium Industry Volume K Tons Forecast, by Phase 2020 & 2033
- Table 95: Global Helium Industry Revenue billion Forecast, by Application 2020 & 2033
- Table 96: Global Helium Industry Volume K Tons Forecast, by Application 2020 & 2033
- Table 97: Global Helium Industry Revenue billion Forecast, by End-user Industry 2020 & 2033
- Table 98: Global Helium Industry Volume K Tons Forecast, by End-user Industry 2020 & 2033
- Table 99: Global Helium Industry Revenue billion Forecast, by Country 2020 & 2033
- Table 100: Global Helium Industry Volume K Tons Forecast, by Country 2020 & 2033
- Table 101: Global Helium Industry Revenue billion Forecast, by Phase 2020 & 2033
- Table 102: Global Helium Industry Volume K Tons Forecast, by Phase 2020 & 2033
- Table 103: Global Helium Industry Revenue billion Forecast, by Application 2020 & 2033
- Table 104: Global Helium Industry Volume K Tons Forecast, by Application 2020 & 2033
- Table 105: Global Helium Industry Revenue billion Forecast, by End-user Industry 2020 & 2033
- Table 106: Global Helium Industry Volume K Tons Forecast, by End-user Industry 2020 & 2033
- Table 107: Global Helium Industry Revenue billion Forecast, by Country 2020 & 2033
- Table 108: Global Helium Industry Volume K Tons Forecast, by Country 2020 & 2033
- Table 109: Global Helium Industry Revenue billion Forecast, by Phase 2020 & 2033
- Table 110: Global Helium Industry Volume K Tons Forecast, by Phase 2020 & 2033
- Table 111: Global Helium Industry Revenue billion Forecast, by Application 2020 & 2033
- Table 112: Global Helium Industry Volume K Tons Forecast, by Application 2020 & 2033
- Table 113: Global Helium Industry Revenue billion Forecast, by End-user Industry 2020 & 2033
- Table 114: Global Helium Industry Volume K Tons Forecast, by End-user Industry 2020 & 2033
- Table 115: Global Helium Industry Revenue billion Forecast, by Country 2020 & 2033
- Table 116: Global Helium Industry Volume K Tons Forecast, by Country 2020 & 2033
- Table 117: Global Helium Industry Revenue billion Forecast, by Phase 2020 & 2033
- Table 118: Global Helium Industry Volume K Tons Forecast, by Phase 2020 & 2033
- Table 119: Global Helium Industry Revenue billion Forecast, by Application 2020 & 2033
- Table 120: Global Helium Industry Volume K Tons Forecast, by Application 2020 & 2033
- Table 121: Global Helium Industry Revenue billion Forecast, by End-user Industry 2020 & 2033
- Table 122: Global Helium Industry Volume K Tons Forecast, by End-user Industry 2020 & 2033
- Table 123: Global Helium Industry Revenue billion Forecast, by Country 2020 & 2033
- Table 124: Global Helium Industry Volume K Tons Forecast, by Country 2020 & 2033
- Table 125: Global Helium Industry Revenue billion Forecast, by Phase 2020 & 2033
- Table 126: Global Helium Industry Volume K Tons Forecast, by Phase 2020 & 2033
- Table 127: Global Helium Industry Revenue billion Forecast, by Application 2020 & 2033
- Table 128: Global Helium Industry Volume K Tons Forecast, by Application 2020 & 2033
- Table 129: Global Helium Industry Revenue billion Forecast, by End-user Industry 2020 & 2033
- Table 130: Global Helium Industry Volume K Tons Forecast, by End-user Industry 2020 & 2033
- Table 131: Global Helium Industry Revenue billion Forecast, by Country 2020 & 2033
- Table 132: Global Helium Industry Volume K Tons Forecast, by Country 2020 & 2033
- Table 133: Rest of the World Helium Industry Revenue (billion) Forecast, by Application 2020 & 2033
- Table 134: Rest of the World Helium Industry Volume (K Tons) Forecast, by Application 2020 & 2033
- Table 135: Global Helium Industry Revenue billion Forecast, by Phase 2020 & 2033
- Table 136: Global Helium Industry Volume K Tons Forecast, by Phase 2020 & 2033
- Table 137: Global Helium Industry Revenue billion Forecast, by Application 2020 & 2033
- Table 138: Global Helium Industry Volume K Tons Forecast, by Application 2020 & 2033
- Table 139: Global Helium Industry Revenue billion Forecast, by End-user Industry 2020 & 2033
- Table 140: Global Helium Industry Volume K Tons Forecast, by End-user Industry 2020 & 2033
- Table 141: Global Helium Industry Revenue billion Forecast, by Country 2020 & 2033
- Table 142: Global Helium Industry Volume K Tons Forecast, by Country 2020 & 2033
- Table 143: Global Helium Industry Revenue billion Forecast, by Phase 2020 & 2033
- Table 144: Global Helium Industry Volume K Tons Forecast, by Phase 2020 & 2033
- Table 145: Global Helium Industry Revenue billion Forecast, by Application 2020 & 2033
- Table 146: Global Helium Industry Volume K Tons Forecast, by Application 2020 & 2033
- Table 147: Global Helium Industry Revenue billion Forecast, by End-user Industry 2020 & 2033
- Table 148: Global Helium Industry Volume K Tons Forecast, by End-user Industry 2020 & 2033
- Table 149: Global Helium Industry Revenue billion Forecast, by Country 2020 & 2033
- Table 150: Global Helium Industry Volume K Tons Forecast, by Country 2020 & 2033
Frequently Asked Questions
1. What is the projected Compound Annual Growth Rate (CAGR) of the Helium Industry?
The projected CAGR is approximately 3.05%.
2. Which companies are prominent players in the Helium Industry?
Key companies in the market include Gazprom, Linde PLC, Pgnig Sa (Orlen), Exxon Mobil Corporation, Air Products Inc, NexAir LLC, Gulf Cryo, Matheson Tri-Gas Inc, Iwatani Corporation, Messer Group GmbH, Qatarenergy Lng, Air Liquide, Weil Group*List Not Exhaustive, Renergen.
3. What are the main segments of the Helium Industry?
The market segments include Phase, Application, End-user Industry.
4. Can you provide details about the market size?
The market size is estimated to be USD 3.36 billion as of 2022.
5. What are some drivers contributing to market growth?
Increasing Consumption of Helium Across the Semiconductor Industry; Growing Utilization of Helium Across Aviation Industry.
6. What are the notable trends driving market growth?
Increasing Demand from the Healthcare Industry.
7. Are there any restraints impacting market growth?
Expensive Extraction Process; Inconsistent Supply of Helium.
8. Can you provide examples of recent developments in the market?
July 2022: Helios Specialty Gases and Iwatani Corporation signed an agreement involving Iwatani, supplying liquid helium to Helious’s transfer facilities in Gujarat, Telangana, and Rajasthan.
9. What pricing options are available for accessing the report?
Pricing options include single-user, multi-user, and enterprise licenses priced at USD 4750, USD 5250, and USD 8750 respectively.
10. Is the market size provided in terms of value or volume?
The market size is provided in terms of value, measured in billion and volume, measured in K Tons.
11. Are there any specific market keywords associated with the report?
Yes, the market keyword associated with the report is "Helium Industry," which aids in identifying and referencing the specific market segment covered.
12. How do I determine which pricing option suits my needs best?
The pricing options vary based on user requirements and access needs. Individual users may opt for single-user licenses, while businesses requiring broader access may choose multi-user or enterprise licenses for cost-effective access to the report.
13. Are there any additional resources or data provided in the Helium Industry report?
While the report offers comprehensive insights, it's advisable to review the specific contents or supplementary materials provided to ascertain if additional resources or data are available.
14. How can I stay updated on further developments or reports in the Helium Industry?
To stay informed about further developments, trends, and reports in the Helium Industry, consider subscribing to industry newsletters, following relevant companies and organizations, or regularly checking reputable industry news sources and publications.
Methodology
Step 1 - Identification of Relevant Samples Size from Population Database


Step 2 - Approaches for Defining Global Market Size (Value, Volume* & Price*)

Note*: In applicable scenarios
Step 3 - Data Sources
Primary Research
- Web Analytics
- Survey Reports
- Research Institute
- Latest Research Reports
- Opinion Leaders
Secondary Research
- Annual Reports
- White Paper
- Latest Press Release
- Industry Association
- Paid Database
- Investor Presentations

Step 4 - Data Triangulation
Involves using different sources of information in order to increase the validity of a study
These sources are likely to be stakeholders in a program - participants, other researchers, program staff, other community members, and so on.
Then we put all data in single framework & apply various statistical tools to find out the dynamic on the market.
During the analysis stage, feedback from the stakeholder groups would be compared to determine areas of agreement as well as areas of divergence