


Key Insights
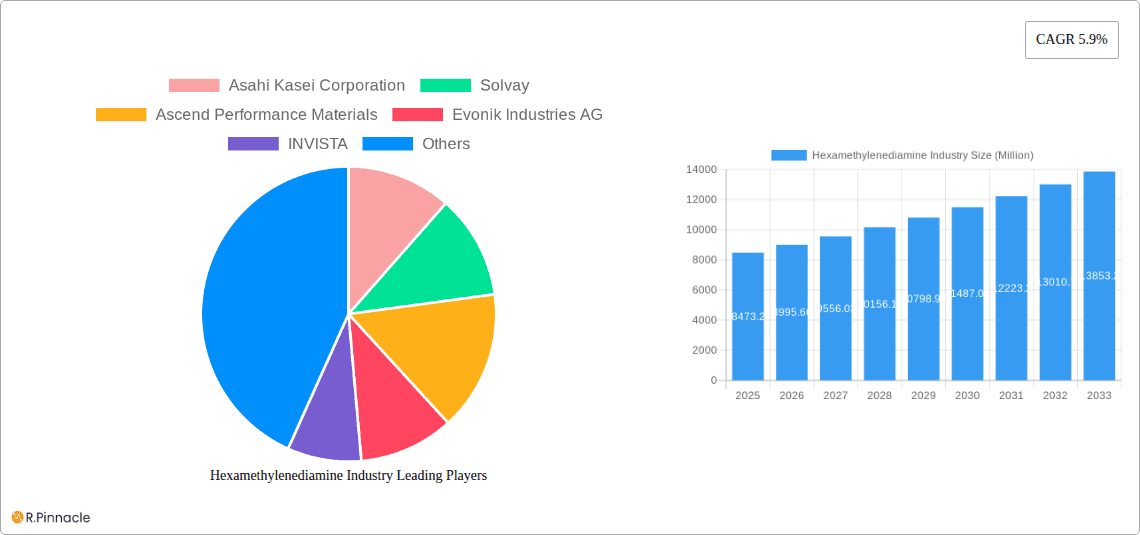
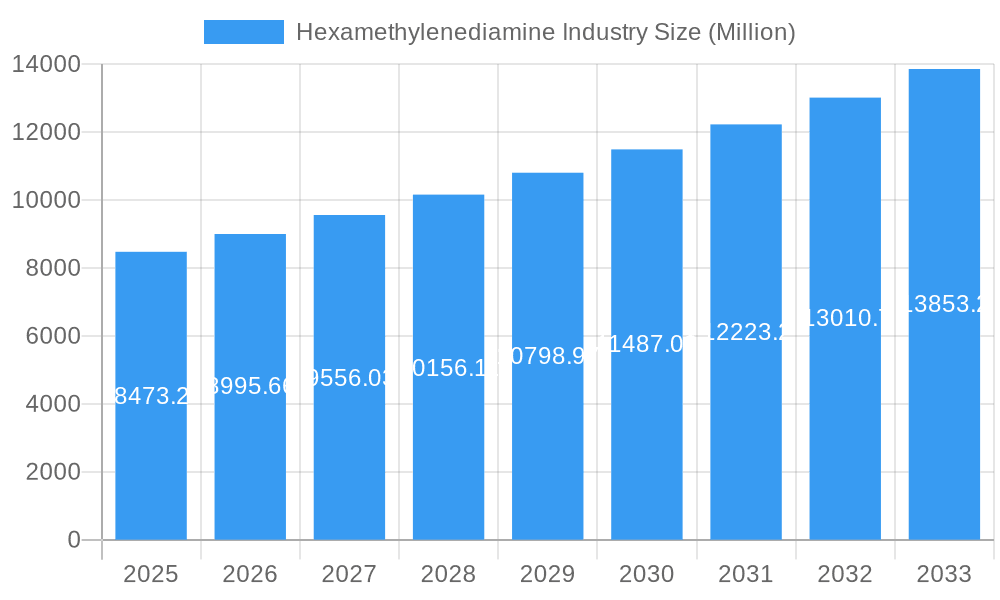
The Hexamethylenediamine (HMDA) market, valued at $8,473.20 million in 2025, is projected to experience robust growth, driven by increasing demand from key application segments like nylon production and coatings. A Compound Annual Growth Rate (CAGR) of 5.9% from 2025 to 2033 indicates a substantial market expansion. The textile and automotive industries are major end-users, fueled by the growing global need for durable and lightweight materials. Advances in bio-based HMDA production are emerging as a significant trend, aligning with the increasing focus on sustainability and reducing reliance on petroleum-based resources. However, fluctuating raw material prices and stringent environmental regulations pose challenges to market growth. Competition among established players like Asahi Kasei, Solvay, and BASF, along with the emergence of innovative companies, shapes the market landscape. Regional variations exist, with North America and Asia-Pacific expected to dominate market share due to significant industrial activity and robust infrastructure. The forecast period (2025-2033) anticipates continued expansion, driven by technological advancements and the expanding global economy. Specifically, the increasing adoption of HMDA in high-performance materials and the growth of emerging economies will likely fuel further market expansion.
Hexamethylenediamine Industry Market Size (In Billion)

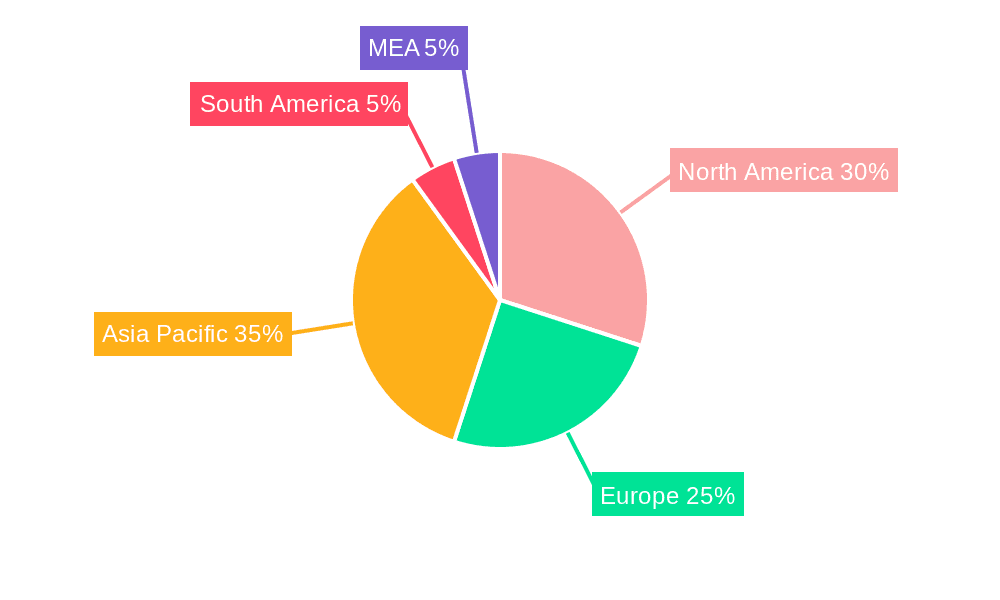
The market segmentation highlights the diverse applications of HMDA. Nylon production remains the dominant segment, followed by its use as an intermediate in coatings. The biocides segment is witnessing growth, driven by the increasing demand for environmentally friendly solutions. Other applications, such as curing agents and lubricants, contribute significantly. Geographically, the Asia-Pacific region is poised for significant growth, fueled by rapid industrialization and increasing demand from the automotive and textile sectors. North America will continue to hold a substantial market share, propelled by robust domestic demand and technological innovation. Europe also maintains a considerable presence, but market growth may be comparatively slower compared to Asia-Pacific due to stringent regulatory frameworks.
Hexamethylenediamine Industry Company Market Share
Hexamethylenediamine (HMDA) Industry Report: 2019-2033
This comprehensive report provides an in-depth analysis of the global hexamethylenediamine industry, offering invaluable insights for industry professionals, investors, and stakeholders. Covering the period from 2019 to 2033, with a focus on 2025, this report meticulously examines market dynamics, competitive landscapes, and future growth potential. The report leverages extensive data and analysis to provide actionable intelligence on market size, segmentation, growth drivers, and challenges, forecasting significant trends to 2033.
Hexamethylenediamine Industry Market Structure & Innovation Trends
This section analyzes the competitive landscape of the HMDA market, encompassing market concentration, innovation drivers, regulatory frameworks, and merger & acquisition (M&A) activities. The report examines the market share held by key players like Asahi Kasei Corporation, Solvay, Ascend Performance Materials, Evonik Industries AG, INVISTA, DOW, BASF SE, Alfa Aesar, Genomatica Inc, TORAY INDUSTRIES INC, Radici Partecipazioni SpA, and Shenma Industrial Co Ltd. The analysis includes an assessment of the impact of recent M&A activities, estimating their total value at approximately xx Million, and how they've reshaped the market structure. The report also details the regulatory landscape, highlighting its influence on innovation and market access. The analysis considers the impact of substitute products and evolving end-user demographics on market trends. Innovation drivers are discussed, focusing on advancements in sustainable production methods and the development of new applications.
- Market Concentration: The report provides a detailed analysis of market share distribution among key players.
- Innovation Drivers: Focus on sustainable production (bio-based HMDA) and new applications.
- Regulatory Framework: Analysis of relevant regulations and their impact on market dynamics.
- Product Substitutes: Assessment of competitive pressures from alternative materials.
- M&A Activities: Review of recent mergers and acquisitions, with estimated deal values.
- End-user Demographics: Analysis of changing demand patterns across various end-use sectors.
Hexamethylenediamine Industry Market Dynamics & Trends
This section delves into the driving forces shaping the HMDA market's growth trajectory. The analysis covers various factors, including technological advancements, evolving consumer preferences, and competitive dynamics. The report projects a Compound Annual Growth Rate (CAGR) of xx% during the forecast period (2025-2033), with market penetration expected to reach xx% by 2033. Key market drivers are identified, and their influence on market growth is analyzed. Technological disruptions, particularly the emergence of bio-based HMDA, are evaluated for their impact on the market. Competitive dynamics are assessed, including strategies adopted by leading players to maintain or gain market share.
Dominant Regions & Segments in Hexamethylenediamine Industry
This section identifies the leading regions and segments within the HMDA market. The analysis covers key application segments (Nylon Production, Intermediate for Coatings, Biocides, Other Applications) and end-user industries (Textile, Plastics, Automotive, Other End-user Industries). The report highlights the dominant region(s) and explains the factors contributing to their leadership.
Leading Regions: (Detailed analysis with supporting paragraphs for each region)
- Key Drivers: Economic growth, infrastructure development, government policies.
Leading Segments: (Detailed analysis with supporting paragraphs for each segment)
- Application: Nylon Production (dominance analysis)
- End-user Industry: Textile (dominance analysis)
Hexamethylenediamine Industry Product Innovations
This section summarizes recent product developments and innovations in the HMDA market. The focus is on technological advancements, such as the shift towards bio-based HMDA, and their impact on market competitiveness and product applications. New applications for HMDA and their commercial viability are also discussed.
Report Scope & Segmentation Analysis
This report segments the HMDA market by application (Nylon Production, Intermediate for Coatings, Biocides, Other Applications) and end-user industry (Textile, Plastics, Automotive, Other End-user Industries). Each segment’s market size, growth projections, and competitive dynamics are analyzed. The report provides detailed market size estimates for each segment in Million for the historical period (2019-2024), base year (2025), and forecast period (2025-2033).
Key Drivers of Hexamethylenediamine Industry Growth
This section outlines the key factors driving the growth of the HMDA market. These include technological advancements (e.g., bio-based HMDA production), economic growth in key end-use industries, and supportive government policies. Specific examples of these drivers are provided.
Challenges in the Hexamethylenediamine Industry Sector
This section discusses the challenges facing the HMDA industry, including regulatory hurdles, supply chain disruptions, and intense competition. The report quantifies the impact of these challenges on market growth.
Emerging Opportunities in Hexamethylenediamine Industry
This section highlights emerging opportunities within the HMDA market, such as the expansion into new applications and regions, and the adoption of innovative technologies.
Leading Players in the Hexamethylenediamine Industry Market
- Asahi Kasei Corporation
- Solvay
- Ascend Performance Materials
- Evonik Industries AG
- INVISTA
- DOW
- BASF SE
- Alfa Aesar
- Genomatica Inc
- TORAY INDUSTRIES INC
- Radici Partecipazioni SpA
- Shenma Industrial Co Ltd
Key Developments in Hexamethylenediamine Industry Industry
- January 2022: BASF SE announced plans to build a new HMDA plant in Chlaampe, France, increasing its annual production capacity to 260,000 metric tons by 2024.
- March 2022: Asahi Kasei Corporation partnered with Genomatica Inc. to commercialize renewable nylon 6,6 using Genomatica's bio-based HMDA building block.
Future Outlook for Hexamethylenediamine Industry Market
The HMDA market is poised for significant growth, driven by increasing demand from key end-use sectors and the adoption of sustainable production methods. Strategic opportunities exist for companies to expand their market share through innovation, strategic partnerships, and geographical expansion. The report forecasts a positive outlook, with continued growth expected throughout the forecast period.
Hexamethylenediamine Industry Segmentation
-
1. Application
- 1.1. Nylon Production
- 1.2. Intermediate for Coatings
- 1.3. Biocides
- 1.4. Other Ap
-
2. End-user Industry
- 2.1. Textile
- 2.2. Plastics
- 2.3. Automotive
- 2.4. Other En
Hexamethylenediamine Industry Segmentation By Geography
-
1. Asia Pacific
- 1.1. China
- 1.2. India
- 1.3. Japan
- 1.4. South Korea
- 1.5. Rest of Asia Pacific
-
2. North America
- 2.1. United States
- 2.2. Canada
- 2.3. Mexico
-
3. Europe
- 3.1. Germany
- 3.2. United Kingdom
- 3.3. Italy
- 3.4. France
- 3.5. Rest of Europe
-
4. South America
- 4.1. Brazil
- 4.2. Argentina
- 4.3. Rest of South America
-
5. Middle East and Africa
- 5.1. Saudi Arabia
- 5.2. South Africa
- 5.3. Rest of Middle East and Africa
Hexamethylenediamine Industry Regional Market Share
Geographic Coverage of Hexamethylenediamine Industry
Hexamethylenediamine Industry REPORT HIGHLIGHTS
| Aspects | Details |
|---|---|
| Study Period | 2020-2034 |
| Base Year | 2025 |
| Estimated Year | 2026 |
| Forecast Period | 2026-2034 |
| Historical Period | 2020-2025 |
| Growth Rate | CAGR of 5.9% from 2020-2034 |
| Segmentation |
|
Table of Contents
- 1. Introduction
- 1.1. Research Scope
- 1.2. Market Segmentation
- 1.3. Research Methodology
- 1.4. Definitions and Assumptions
- 2. Executive Summary
- 2.1. Introduction
- 3. Market Dynamics
- 3.1. Introduction
- 3.2. Market Drivers
- 3.2.1. Increasing Consumption of Nylon 66 Resins; The Rising Demand for Hexamethylenediamine in Automotive and Textile Industries; Other Drivers
- 3.3. Market Restrains
- 3.3.1. Increased Usage of of Bio-based Raw Materials for Nylon Production; Other Restraints
- 3.4. Market Trends
- 3.4.1. Textile End-User Industry to Dominate the Market
- 4. Market Factor Analysis
- 4.1. Porters Five Forces
- 4.2. Supply/Value Chain
- 4.3. PESTEL analysis
- 4.4. Market Entropy
- 4.5. Patent/Trademark Analysis
- 5. Global Hexamethylenediamine Industry Analysis, Insights and Forecast, 2020-2032
- 5.1. Market Analysis, Insights and Forecast - by Application
- 5.1.1. Nylon Production
- 5.1.2. Intermediate for Coatings
- 5.1.3. Biocides
- 5.1.4. Other Ap
- 5.2. Market Analysis, Insights and Forecast - by End-user Industry
- 5.2.1. Textile
- 5.2.2. Plastics
- 5.2.3. Automotive
- 5.2.4. Other En
- 5.3. Market Analysis, Insights and Forecast - by Region
- 5.3.1. Asia Pacific
- 5.3.2. North America
- 5.3.3. Europe
- 5.3.4. South America
- 5.3.5. Middle East and Africa
- 5.1. Market Analysis, Insights and Forecast - by Application
- 6. Asia Pacific Hexamethylenediamine Industry Analysis, Insights and Forecast, 2020-2032
- 6.1. Market Analysis, Insights and Forecast - by Application
- 6.1.1. Nylon Production
- 6.1.2. Intermediate for Coatings
- 6.1.3. Biocides
- 6.1.4. Other Ap
- 6.2. Market Analysis, Insights and Forecast - by End-user Industry
- 6.2.1. Textile
- 6.2.2. Plastics
- 6.2.3. Automotive
- 6.2.4. Other En
- 6.1. Market Analysis, Insights and Forecast - by Application
- 7. North America Hexamethylenediamine Industry Analysis, Insights and Forecast, 2020-2032
- 7.1. Market Analysis, Insights and Forecast - by Application
- 7.1.1. Nylon Production
- 7.1.2. Intermediate for Coatings
- 7.1.3. Biocides
- 7.1.4. Other Ap
- 7.2. Market Analysis, Insights and Forecast - by End-user Industry
- 7.2.1. Textile
- 7.2.2. Plastics
- 7.2.3. Automotive
- 7.2.4. Other En
- 7.1. Market Analysis, Insights and Forecast - by Application
- 8. Europe Hexamethylenediamine Industry Analysis, Insights and Forecast, 2020-2032
- 8.1. Market Analysis, Insights and Forecast - by Application
- 8.1.1. Nylon Production
- 8.1.2. Intermediate for Coatings
- 8.1.3. Biocides
- 8.1.4. Other Ap
- 8.2. Market Analysis, Insights and Forecast - by End-user Industry
- 8.2.1. Textile
- 8.2.2. Plastics
- 8.2.3. Automotive
- 8.2.4. Other En
- 8.1. Market Analysis, Insights and Forecast - by Application
- 9. South America Hexamethylenediamine Industry Analysis, Insights and Forecast, 2020-2032
- 9.1. Market Analysis, Insights and Forecast - by Application
- 9.1.1. Nylon Production
- 9.1.2. Intermediate for Coatings
- 9.1.3. Biocides
- 9.1.4. Other Ap
- 9.2. Market Analysis, Insights and Forecast - by End-user Industry
- 9.2.1. Textile
- 9.2.2. Plastics
- 9.2.3. Automotive
- 9.2.4. Other En
- 9.1. Market Analysis, Insights and Forecast - by Application
- 10. Middle East and Africa Hexamethylenediamine Industry Analysis, Insights and Forecast, 2020-2032
- 10.1. Market Analysis, Insights and Forecast - by Application
- 10.1.1. Nylon Production
- 10.1.2. Intermediate for Coatings
- 10.1.3. Biocides
- 10.1.4. Other Ap
- 10.2. Market Analysis, Insights and Forecast - by End-user Industry
- 10.2.1. Textile
- 10.2.2. Plastics
- 10.2.3. Automotive
- 10.2.4. Other En
- 10.1. Market Analysis, Insights and Forecast - by Application
- 11. Competitive Analysis
- 11.1. Global Market Share Analysis 2025
- 11.2. Company Profiles
- 11.2.1 Asahi Kasei Corporation
- 11.2.1.1. Overview
- 11.2.1.2. Products
- 11.2.1.3. SWOT Analysis
- 11.2.1.4. Recent Developments
- 11.2.1.5. Financials (Based on Availability)
- 11.2.2 Solvay
- 11.2.2.1. Overview
- 11.2.2.2. Products
- 11.2.2.3. SWOT Analysis
- 11.2.2.4. Recent Developments
- 11.2.2.5. Financials (Based on Availability)
- 11.2.3 Ascend Performance Materials
- 11.2.3.1. Overview
- 11.2.3.2. Products
- 11.2.3.3. SWOT Analysis
- 11.2.3.4. Recent Developments
- 11.2.3.5. Financials (Based on Availability)
- 11.2.4 Evonik Industries AG
- 11.2.4.1. Overview
- 11.2.4.2. Products
- 11.2.4.3. SWOT Analysis
- 11.2.4.4. Recent Developments
- 11.2.4.5. Financials (Based on Availability)
- 11.2.5 INVISTA
- 11.2.5.1. Overview
- 11.2.5.2. Products
- 11.2.5.3. SWOT Analysis
- 11.2.5.4. Recent Developments
- 11.2.5.5. Financials (Based on Availability)
- 11.2.6 DOW
- 11.2.6.1. Overview
- 11.2.6.2. Products
- 11.2.6.3. SWOT Analysis
- 11.2.6.4. Recent Developments
- 11.2.6.5. Financials (Based on Availability)
- 11.2.7 BASF SE
- 11.2.7.1. Overview
- 11.2.7.2. Products
- 11.2.7.3. SWOT Analysis
- 11.2.7.4. Recent Developments
- 11.2.7.5. Financials (Based on Availability)
- 11.2.8 Alfa Aesar
- 11.2.8.1. Overview
- 11.2.8.2. Products
- 11.2.8.3. SWOT Analysis
- 11.2.8.4. Recent Developments
- 11.2.8.5. Financials (Based on Availability)
- 11.2.9 Genomatica Inc
- 11.2.9.1. Overview
- 11.2.9.2. Products
- 11.2.9.3. SWOT Analysis
- 11.2.9.4. Recent Developments
- 11.2.9.5. Financials (Based on Availability)
- 11.2.10 TORAY INDUSTRIES INC
- 11.2.10.1. Overview
- 11.2.10.2. Products
- 11.2.10.3. SWOT Analysis
- 11.2.10.4. Recent Developments
- 11.2.10.5. Financials (Based on Availability)
- 11.2.11 Radici Partecipazioni SpA
- 11.2.11.1. Overview
- 11.2.11.2. Products
- 11.2.11.3. SWOT Analysis
- 11.2.11.4. Recent Developments
- 11.2.11.5. Financials (Based on Availability)
- 11.2.12 Shenma Industrial Co Ltd
- 11.2.12.1. Overview
- 11.2.12.2. Products
- 11.2.12.3. SWOT Analysis
- 11.2.12.4. Recent Developments
- 11.2.12.5. Financials (Based on Availability)
- 11.2.1 Asahi Kasei Corporation
List of Figures
- Figure 1: Global Hexamethylenediamine Industry Revenue Breakdown (Million, %) by Region 2025 & 2033
- Figure 2: Global Hexamethylenediamine Industry Volume Breakdown (K Tons, %) by Region 2025 & 2033
- Figure 3: Asia Pacific Hexamethylenediamine Industry Revenue (Million), by Application 2025 & 2033
- Figure 4: Asia Pacific Hexamethylenediamine Industry Volume (K Tons), by Application 2025 & 2033
- Figure 5: Asia Pacific Hexamethylenediamine Industry Revenue Share (%), by Application 2025 & 2033
- Figure 6: Asia Pacific Hexamethylenediamine Industry Volume Share (%), by Application 2025 & 2033
- Figure 7: Asia Pacific Hexamethylenediamine Industry Revenue (Million), by End-user Industry 2025 & 2033
- Figure 8: Asia Pacific Hexamethylenediamine Industry Volume (K Tons), by End-user Industry 2025 & 2033
- Figure 9: Asia Pacific Hexamethylenediamine Industry Revenue Share (%), by End-user Industry 2025 & 2033
- Figure 10: Asia Pacific Hexamethylenediamine Industry Volume Share (%), by End-user Industry 2025 & 2033
- Figure 11: Asia Pacific Hexamethylenediamine Industry Revenue (Million), by Country 2025 & 2033
- Figure 12: Asia Pacific Hexamethylenediamine Industry Volume (K Tons), by Country 2025 & 2033
- Figure 13: Asia Pacific Hexamethylenediamine Industry Revenue Share (%), by Country 2025 & 2033
- Figure 14: Asia Pacific Hexamethylenediamine Industry Volume Share (%), by Country 2025 & 2033
- Figure 15: North America Hexamethylenediamine Industry Revenue (Million), by Application 2025 & 2033
- Figure 16: North America Hexamethylenediamine Industry Volume (K Tons), by Application 2025 & 2033
- Figure 17: North America Hexamethylenediamine Industry Revenue Share (%), by Application 2025 & 2033
- Figure 18: North America Hexamethylenediamine Industry Volume Share (%), by Application 2025 & 2033
- Figure 19: North America Hexamethylenediamine Industry Revenue (Million), by End-user Industry 2025 & 2033
- Figure 20: North America Hexamethylenediamine Industry Volume (K Tons), by End-user Industry 2025 & 2033
- Figure 21: North America Hexamethylenediamine Industry Revenue Share (%), by End-user Industry 2025 & 2033
- Figure 22: North America Hexamethylenediamine Industry Volume Share (%), by End-user Industry 2025 & 2033
- Figure 23: North America Hexamethylenediamine Industry Revenue (Million), by Country 2025 & 2033
- Figure 24: North America Hexamethylenediamine Industry Volume (K Tons), by Country 2025 & 2033
- Figure 25: North America Hexamethylenediamine Industry Revenue Share (%), by Country 2025 & 2033
- Figure 26: North America Hexamethylenediamine Industry Volume Share (%), by Country 2025 & 2033
- Figure 27: Europe Hexamethylenediamine Industry Revenue (Million), by Application 2025 & 2033
- Figure 28: Europe Hexamethylenediamine Industry Volume (K Tons), by Application 2025 & 2033
- Figure 29: Europe Hexamethylenediamine Industry Revenue Share (%), by Application 2025 & 2033
- Figure 30: Europe Hexamethylenediamine Industry Volume Share (%), by Application 2025 & 2033
- Figure 31: Europe Hexamethylenediamine Industry Revenue (Million), by End-user Industry 2025 & 2033
- Figure 32: Europe Hexamethylenediamine Industry Volume (K Tons), by End-user Industry 2025 & 2033
- Figure 33: Europe Hexamethylenediamine Industry Revenue Share (%), by End-user Industry 2025 & 2033
- Figure 34: Europe Hexamethylenediamine Industry Volume Share (%), by End-user Industry 2025 & 2033
- Figure 35: Europe Hexamethylenediamine Industry Revenue (Million), by Country 2025 & 2033
- Figure 36: Europe Hexamethylenediamine Industry Volume (K Tons), by Country 2025 & 2033
- Figure 37: Europe Hexamethylenediamine Industry Revenue Share (%), by Country 2025 & 2033
- Figure 38: Europe Hexamethylenediamine Industry Volume Share (%), by Country 2025 & 2033
- Figure 39: South America Hexamethylenediamine Industry Revenue (Million), by Application 2025 & 2033
- Figure 40: South America Hexamethylenediamine Industry Volume (K Tons), by Application 2025 & 2033
- Figure 41: South America Hexamethylenediamine Industry Revenue Share (%), by Application 2025 & 2033
- Figure 42: South America Hexamethylenediamine Industry Volume Share (%), by Application 2025 & 2033
- Figure 43: South America Hexamethylenediamine Industry Revenue (Million), by End-user Industry 2025 & 2033
- Figure 44: South America Hexamethylenediamine Industry Volume (K Tons), by End-user Industry 2025 & 2033
- Figure 45: South America Hexamethylenediamine Industry Revenue Share (%), by End-user Industry 2025 & 2033
- Figure 46: South America Hexamethylenediamine Industry Volume Share (%), by End-user Industry 2025 & 2033
- Figure 47: South America Hexamethylenediamine Industry Revenue (Million), by Country 2025 & 2033
- Figure 48: South America Hexamethylenediamine Industry Volume (K Tons), by Country 2025 & 2033
- Figure 49: South America Hexamethylenediamine Industry Revenue Share (%), by Country 2025 & 2033
- Figure 50: South America Hexamethylenediamine Industry Volume Share (%), by Country 2025 & 2033
- Figure 51: Middle East and Africa Hexamethylenediamine Industry Revenue (Million), by Application 2025 & 2033
- Figure 52: Middle East and Africa Hexamethylenediamine Industry Volume (K Tons), by Application 2025 & 2033
- Figure 53: Middle East and Africa Hexamethylenediamine Industry Revenue Share (%), by Application 2025 & 2033
- Figure 54: Middle East and Africa Hexamethylenediamine Industry Volume Share (%), by Application 2025 & 2033
- Figure 55: Middle East and Africa Hexamethylenediamine Industry Revenue (Million), by End-user Industry 2025 & 2033
- Figure 56: Middle East and Africa Hexamethylenediamine Industry Volume (K Tons), by End-user Industry 2025 & 2033
- Figure 57: Middle East and Africa Hexamethylenediamine Industry Revenue Share (%), by End-user Industry 2025 & 2033
- Figure 58: Middle East and Africa Hexamethylenediamine Industry Volume Share (%), by End-user Industry 2025 & 2033
- Figure 59: Middle East and Africa Hexamethylenediamine Industry Revenue (Million), by Country 2025 & 2033
- Figure 60: Middle East and Africa Hexamethylenediamine Industry Volume (K Tons), by Country 2025 & 2033
- Figure 61: Middle East and Africa Hexamethylenediamine Industry Revenue Share (%), by Country 2025 & 2033
- Figure 62: Middle East and Africa Hexamethylenediamine Industry Volume Share (%), by Country 2025 & 2033
List of Tables
- Table 1: Global Hexamethylenediamine Industry Revenue Million Forecast, by Application 2020 & 2033
- Table 2: Global Hexamethylenediamine Industry Volume K Tons Forecast, by Application 2020 & 2033
- Table 3: Global Hexamethylenediamine Industry Revenue Million Forecast, by End-user Industry 2020 & 2033
- Table 4: Global Hexamethylenediamine Industry Volume K Tons Forecast, by End-user Industry 2020 & 2033
- Table 5: Global Hexamethylenediamine Industry Revenue Million Forecast, by Region 2020 & 2033
- Table 6: Global Hexamethylenediamine Industry Volume K Tons Forecast, by Region 2020 & 2033
- Table 7: Global Hexamethylenediamine Industry Revenue Million Forecast, by Application 2020 & 2033
- Table 8: Global Hexamethylenediamine Industry Volume K Tons Forecast, by Application 2020 & 2033
- Table 9: Global Hexamethylenediamine Industry Revenue Million Forecast, by End-user Industry 2020 & 2033
- Table 10: Global Hexamethylenediamine Industry Volume K Tons Forecast, by End-user Industry 2020 & 2033
- Table 11: Global Hexamethylenediamine Industry Revenue Million Forecast, by Country 2020 & 2033
- Table 12: Global Hexamethylenediamine Industry Volume K Tons Forecast, by Country 2020 & 2033
- Table 13: China Hexamethylenediamine Industry Revenue (Million) Forecast, by Application 2020 & 2033
- Table 14: China Hexamethylenediamine Industry Volume (K Tons) Forecast, by Application 2020 & 2033
- Table 15: India Hexamethylenediamine Industry Revenue (Million) Forecast, by Application 2020 & 2033
- Table 16: India Hexamethylenediamine Industry Volume (K Tons) Forecast, by Application 2020 & 2033
- Table 17: Japan Hexamethylenediamine Industry Revenue (Million) Forecast, by Application 2020 & 2033
- Table 18: Japan Hexamethylenediamine Industry Volume (K Tons) Forecast, by Application 2020 & 2033
- Table 19: South Korea Hexamethylenediamine Industry Revenue (Million) Forecast, by Application 2020 & 2033
- Table 20: South Korea Hexamethylenediamine Industry Volume (K Tons) Forecast, by Application 2020 & 2033
- Table 21: Rest of Asia Pacific Hexamethylenediamine Industry Revenue (Million) Forecast, by Application 2020 & 2033
- Table 22: Rest of Asia Pacific Hexamethylenediamine Industry Volume (K Tons) Forecast, by Application 2020 & 2033
- Table 23: Global Hexamethylenediamine Industry Revenue Million Forecast, by Application 2020 & 2033
- Table 24: Global Hexamethylenediamine Industry Volume K Tons Forecast, by Application 2020 & 2033
- Table 25: Global Hexamethylenediamine Industry Revenue Million Forecast, by End-user Industry 2020 & 2033
- Table 26: Global Hexamethylenediamine Industry Volume K Tons Forecast, by End-user Industry 2020 & 2033
- Table 27: Global Hexamethylenediamine Industry Revenue Million Forecast, by Country 2020 & 2033
- Table 28: Global Hexamethylenediamine Industry Volume K Tons Forecast, by Country 2020 & 2033
- Table 29: United States Hexamethylenediamine Industry Revenue (Million) Forecast, by Application 2020 & 2033
- Table 30: United States Hexamethylenediamine Industry Volume (K Tons) Forecast, by Application 2020 & 2033
- Table 31: Canada Hexamethylenediamine Industry Revenue (Million) Forecast, by Application 2020 & 2033
- Table 32: Canada Hexamethylenediamine Industry Volume (K Tons) Forecast, by Application 2020 & 2033
- Table 33: Mexico Hexamethylenediamine Industry Revenue (Million) Forecast, by Application 2020 & 2033
- Table 34: Mexico Hexamethylenediamine Industry Volume (K Tons) Forecast, by Application 2020 & 2033
- Table 35: Global Hexamethylenediamine Industry Revenue Million Forecast, by Application 2020 & 2033
- Table 36: Global Hexamethylenediamine Industry Volume K Tons Forecast, by Application 2020 & 2033
- Table 37: Global Hexamethylenediamine Industry Revenue Million Forecast, by End-user Industry 2020 & 2033
- Table 38: Global Hexamethylenediamine Industry Volume K Tons Forecast, by End-user Industry 2020 & 2033
- Table 39: Global Hexamethylenediamine Industry Revenue Million Forecast, by Country 2020 & 2033
- Table 40: Global Hexamethylenediamine Industry Volume K Tons Forecast, by Country 2020 & 2033
- Table 41: Germany Hexamethylenediamine Industry Revenue (Million) Forecast, by Application 2020 & 2033
- Table 42: Germany Hexamethylenediamine Industry Volume (K Tons) Forecast, by Application 2020 & 2033
- Table 43: United Kingdom Hexamethylenediamine Industry Revenue (Million) Forecast, by Application 2020 & 2033
- Table 44: United Kingdom Hexamethylenediamine Industry Volume (K Tons) Forecast, by Application 2020 & 2033
- Table 45: Italy Hexamethylenediamine Industry Revenue (Million) Forecast, by Application 2020 & 2033
- Table 46: Italy Hexamethylenediamine Industry Volume (K Tons) Forecast, by Application 2020 & 2033
- Table 47: France Hexamethylenediamine Industry Revenue (Million) Forecast, by Application 2020 & 2033
- Table 48: France Hexamethylenediamine Industry Volume (K Tons) Forecast, by Application 2020 & 2033
- Table 49: Rest of Europe Hexamethylenediamine Industry Revenue (Million) Forecast, by Application 2020 & 2033
- Table 50: Rest of Europe Hexamethylenediamine Industry Volume (K Tons) Forecast, by Application 2020 & 2033
- Table 51: Global Hexamethylenediamine Industry Revenue Million Forecast, by Application 2020 & 2033
- Table 52: Global Hexamethylenediamine Industry Volume K Tons Forecast, by Application 2020 & 2033
- Table 53: Global Hexamethylenediamine Industry Revenue Million Forecast, by End-user Industry 2020 & 2033
- Table 54: Global Hexamethylenediamine Industry Volume K Tons Forecast, by End-user Industry 2020 & 2033
- Table 55: Global Hexamethylenediamine Industry Revenue Million Forecast, by Country 2020 & 2033
- Table 56: Global Hexamethylenediamine Industry Volume K Tons Forecast, by Country 2020 & 2033
- Table 57: Brazil Hexamethylenediamine Industry Revenue (Million) Forecast, by Application 2020 & 2033
- Table 58: Brazil Hexamethylenediamine Industry Volume (K Tons) Forecast, by Application 2020 & 2033
- Table 59: Argentina Hexamethylenediamine Industry Revenue (Million) Forecast, by Application 2020 & 2033
- Table 60: Argentina Hexamethylenediamine Industry Volume (K Tons) Forecast, by Application 2020 & 2033
- Table 61: Rest of South America Hexamethylenediamine Industry Revenue (Million) Forecast, by Application 2020 & 2033
- Table 62: Rest of South America Hexamethylenediamine Industry Volume (K Tons) Forecast, by Application 2020 & 2033
- Table 63: Global Hexamethylenediamine Industry Revenue Million Forecast, by Application 2020 & 2033
- Table 64: Global Hexamethylenediamine Industry Volume K Tons Forecast, by Application 2020 & 2033
- Table 65: Global Hexamethylenediamine Industry Revenue Million Forecast, by End-user Industry 2020 & 2033
- Table 66: Global Hexamethylenediamine Industry Volume K Tons Forecast, by End-user Industry 2020 & 2033
- Table 67: Global Hexamethylenediamine Industry Revenue Million Forecast, by Country 2020 & 2033
- Table 68: Global Hexamethylenediamine Industry Volume K Tons Forecast, by Country 2020 & 2033
- Table 69: Saudi Arabia Hexamethylenediamine Industry Revenue (Million) Forecast, by Application 2020 & 2033
- Table 70: Saudi Arabia Hexamethylenediamine Industry Volume (K Tons) Forecast, by Application 2020 & 2033
- Table 71: South Africa Hexamethylenediamine Industry Revenue (Million) Forecast, by Application 2020 & 2033
- Table 72: South Africa Hexamethylenediamine Industry Volume (K Tons) Forecast, by Application 2020 & 2033
- Table 73: Rest of Middle East and Africa Hexamethylenediamine Industry Revenue (Million) Forecast, by Application 2020 & 2033
- Table 74: Rest of Middle East and Africa Hexamethylenediamine Industry Volume (K Tons) Forecast, by Application 2020 & 2033
Frequently Asked Questions
1. What is the projected Compound Annual Growth Rate (CAGR) of the Hexamethylenediamine Industry?
The projected CAGR is approximately 5.9%.
2. Which companies are prominent players in the Hexamethylenediamine Industry?
Key companies in the market include Asahi Kasei Corporation, Solvay, Ascend Performance Materials, Evonik Industries AG, INVISTA, DOW, BASF SE, Alfa Aesar, Genomatica Inc, TORAY INDUSTRIES INC, Radici Partecipazioni SpA, Shenma Industrial Co Ltd.
3. What are the main segments of the Hexamethylenediamine Industry?
The market segments include Application, End-user Industry.
4. Can you provide details about the market size?
The market size is estimated to be USD 8,473.20 Million as of 2022.
5. What are some drivers contributing to market growth?
Increasing Consumption of Nylon 66 Resins; The Rising Demand for Hexamethylenediamine in Automotive and Textile Industries; Other Drivers.
6. What are the notable trends driving market growth?
Textile End-User Industry to Dominate the Market.
7. Are there any restraints impacting market growth?
Increased Usage of of Bio-based Raw Materials for Nylon Production; Other Restraints.
8. Can you provide examples of recent developments in the market?
March 2022: Asahi Kasei Corporation announced a strategic partnership with Genomatica Inc. to commercialize renewable nylon 6,6 made from Genomatica’s bio-based hexamethylenediamine building block. The partnership will help Asahi Kasei Corporation to further strengthen its market for hexamethylenediamine.
9. What pricing options are available for accessing the report?
Pricing options include single-user, multi-user, and enterprise licenses priced at USD 4750, USD 5250, and USD 8750 respectively.
10. Is the market size provided in terms of value or volume?
The market size is provided in terms of value, measured in Million and volume, measured in K Tons.
11. Are there any specific market keywords associated with the report?
Yes, the market keyword associated with the report is "Hexamethylenediamine Industry," which aids in identifying and referencing the specific market segment covered.
12. How do I determine which pricing option suits my needs best?
The pricing options vary based on user requirements and access needs. Individual users may opt for single-user licenses, while businesses requiring broader access may choose multi-user or enterprise licenses for cost-effective access to the report.
13. Are there any additional resources or data provided in the Hexamethylenediamine Industry report?
While the report offers comprehensive insights, it's advisable to review the specific contents or supplementary materials provided to ascertain if additional resources or data are available.
14. How can I stay updated on further developments or reports in the Hexamethylenediamine Industry?
To stay informed about further developments, trends, and reports in the Hexamethylenediamine Industry, consider subscribing to industry newsletters, following relevant companies and organizations, or regularly checking reputable industry news sources and publications.
Methodology
Step 1 - Identification of Relevant Samples Size from Population Database


Step 2 - Approaches for Defining Global Market Size (Value, Volume* & Price*)

Note*: In applicable scenarios
Step 3 - Data Sources
Primary Research
- Web Analytics
- Survey Reports
- Research Institute
- Latest Research Reports
- Opinion Leaders
Secondary Research
- Annual Reports
- White Paper
- Latest Press Release
- Industry Association
- Paid Database
- Investor Presentations

Step 4 - Data Triangulation
Involves using different sources of information in order to increase the validity of a study
These sources are likely to be stakeholders in a program - participants, other researchers, program staff, other community members, and so on.
Then we put all data in single framework & apply various statistical tools to find out the dynamic on the market.
During the analysis stage, feedback from the stakeholder groups would be compared to determine areas of agreement as well as areas of divergence