

Key Insights
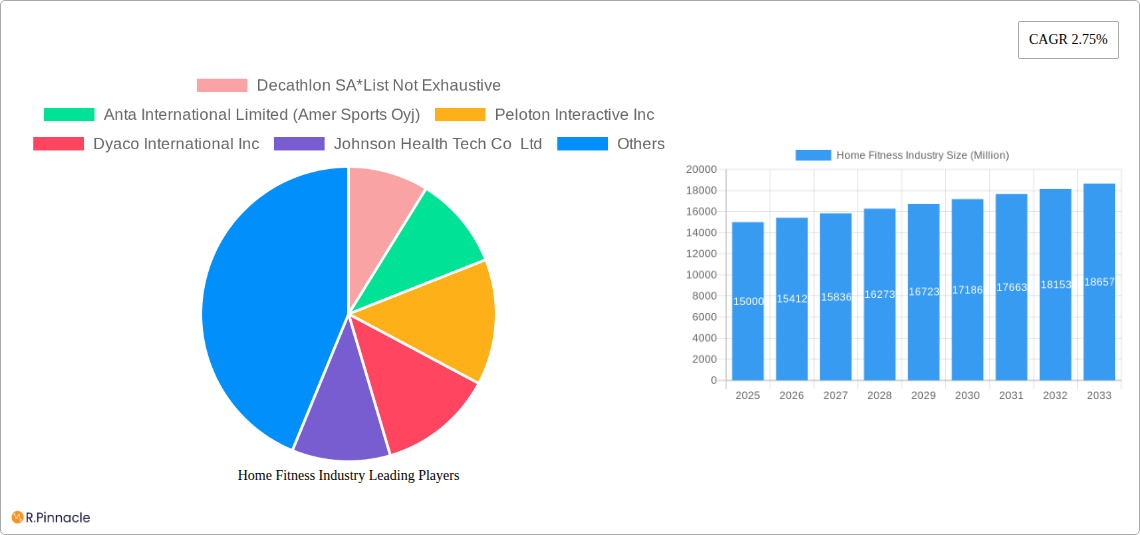
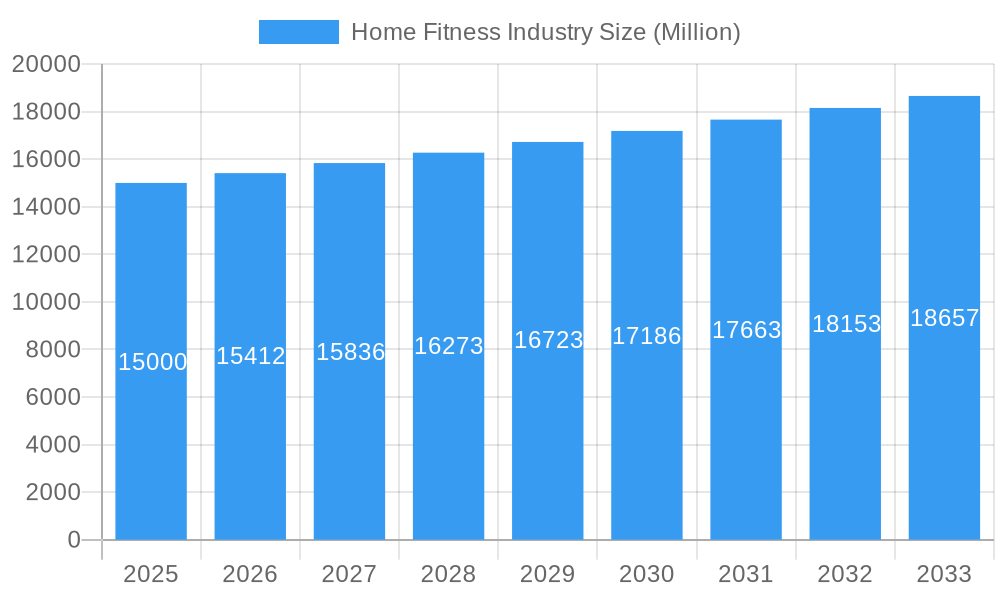
The global home fitness equipment market, valued at approximately $15 billion in 2025, is projected to experience steady growth, driven by several key factors. The increasing prevalence of sedentary lifestyles, coupled with rising health consciousness and a growing awareness of the importance of preventative healthcare, fuels demand for convenient and accessible home workout solutions. The COVID-19 pandemic significantly accelerated this trend, with many consumers prioritizing at-home fitness options due to gym closures and social distancing measures. This shift in consumer preference is expected to persist, albeit at a more moderate pace than during the peak pandemic years. The market is segmented by distribution channels, with online retail stores witnessing substantial growth due to the convenience and wide selection offered. Product-wise, treadmills, elliptical machines, and stationary cycles remain dominant, while strength training equipment and other emerging fitness technologies show significant potential for future growth. Competitive landscape analysis reveals key players such as Decathlon, Peloton, and Johnson Health Tech actively innovating with smart fitness equipment, connected apps, and subscription-based services to enhance user experience and engagement. Geographical distribution shows robust demand in North America and Europe, while the Asia-Pacific region is anticipated to demonstrate significant growth potential due to increasing disposable incomes and adoption of fitness-oriented lifestyles. However, factors such as high initial investment costs for premium equipment and the potential for limited space in urban dwellings could act as restraints on market expansion. Despite these challenges, the market's positive trajectory is expected to continue throughout the forecast period (2025-2033).
Home Fitness Industry Market Size (In Billion)
The continued integration of technology within home fitness equipment is a significant driver of growth. Smart fitness equipment with interactive features, personalized workout plans, and connectivity to fitness tracking apps enhances user engagement and provides data-driven insights. This aspect is contributing to the growing popularity of subscription-based services, creating recurring revenue streams for manufacturers and further propelling market expansion. Furthermore, the rise of online fitness coaching and virtual classes complements home fitness equipment, providing a holistic fitness solution. This trend expands the market beyond simply equipment sales, offering an integrated ecosystem for at-home workout routines. The increasing preference for personalized fitness experiences, combined with the convenience and affordability of home fitness options, creates a favourable market environment, suggesting substantial growth and a promising future for the industry. However, maintaining innovation and addressing concerns regarding equipment quality and durability remain crucial for sustainable market growth.
Home Fitness Industry Company Market Share
Home Fitness Industry Market Report: 2019-2033
This comprehensive report provides a detailed analysis of the global home fitness industry, offering invaluable insights for industry professionals, investors, and strategic decision-makers. With a study period spanning 2019-2033, including a base year of 2025 and a forecast period of 2025-2033, this report unveils the market's dynamic landscape, growth trajectories, and future potential. The report covers a market valued at xx Million in 2025, projected to reach xx Million by 2033, exhibiting a robust Compound Annual Growth Rate (CAGR) of xx%.
Home Fitness Industry Market Structure & Innovation Trends
This section analyzes the competitive landscape, innovation drivers, and regulatory factors shaping the home fitness market. We examine market concentration, identifying key players and their market share. The analysis includes an assessment of mergers and acquisitions (M&A) activities, detailing deal values and their impact on market dynamics. The report also explores innovation drivers such as technological advancements, evolving consumer preferences, and regulatory frameworks. Product substitutes, end-user demographics, and the overall market structure are comprehensively examined.
- Market Concentration: The home fitness market exhibits a moderately concentrated structure, with key players holding significant market share. We detail the market share of top players such as Decathlon SA, Anta International Limited (Amer Sports Oyj), and Peloton Interactive Inc.
- M&A Activities: The report analyzes significant M&A deals in the industry, quantifying their financial impact and strategic implications. For example, we examine deal values of notable acquisitions and their effect on market consolidation.
Home Fitness Industry Market Dynamics & Trends
This in-depth analysis explores the key forces driving market growth, including technological advancements, shifting consumer preferences, and competitive pressures. We delve into specific metrics like CAGR and market penetration rates for various product segments and distribution channels. The impact of technological disruptions, such as the rise of connected fitness platforms, is also analyzed in detail. We examine the competitive dynamics between established players and emerging entrants, highlighting their strategies and market positions.
Dominant Regions & Segments in Home Fitness Industry
This section identifies the leading regions, countries, and market segments within the home fitness industry. We provide a detailed analysis of dominance by both distribution channel (Offline Retail Stores, Online Retail Stores, Direct Selling) and product type (Treadmills, Elliptical Machines, Stationary Cycles, Rowing Machines, Strength Training Equipment, Other Product Types). Key drivers for dominance in each region and segment are examined using specific examples.
- By Distribution Channel: The report analyzes the growth and market share of each distribution channel, identifying factors like consumer behavior, logistical infrastructure, and marketing strategies that contribute to their success.
- By Product Type: A detailed analysis is provided for each product type, evaluating factors like technological advancements, price points, and consumer preferences that drive their respective market positions.
Home Fitness Industry Product Innovations
This section highlights recent product developments in the home fitness industry, emphasizing technological trends and their impact on market positioning. We examine how companies are leveraging technology to enhance user experience, functionality, and engagement, including the integration of smart features and connected fitness platforms. The analysis focuses on competitive advantages derived from product innovation and market fit.
Report Scope & Segmentation Analysis
This report provides a comprehensive segmentation analysis of the home fitness industry by distribution channel (Offline Retail Stores, Online Retail Stores, Direct Selling) and product type (Treadmills, Elliptical Machines, Stationary Cycles, Rowing Machines, Strength Training Equipment, Other Product Types). We present growth projections, market sizes, and a competitive landscape analysis for each segment.
Key Drivers of Home Fitness Industry Growth
This section identifies and analyses the key factors driving growth within the home fitness industry. We explore technological advancements, economic factors (such as rising disposable incomes and increased health awareness), and regulatory influences that are shaping market expansion. Specific examples of these factors and their impact on market growth are provided.
Challenges in the Home Fitness Industry Sector
This section highlights the challenges and restraints facing the home fitness industry. We discuss regulatory hurdles, supply chain disruptions, and intense competitive pressures, quantifying their impacts on market dynamics and growth.
Emerging Opportunities in Home Fitness Industry
This section explores emerging opportunities within the home fitness industry, focusing on new markets, technological advancements, and evolving consumer preferences. We identify potential areas for expansion and growth, highlighting opportunities for innovation and market penetration.
Leading Players in the Home Fitness Industry Market
- Decathlon SA
- Anta International Limited (Amer Sports Oyj)
- Peloton Interactive Inc
- Dyaco International Inc
- Johnson Health Tech Co Ltd
- Nautilus Inc
- Technogym SpA
- TRUE Fitness
- Icon Health & Fitness Inc (iFIT Health & Fitness Inc.)
- Origin Fitness Ltd (Anytime Leisure Limited)
Key Developments in Home Fitness Industry
- August 2021: Johnson Health Tech Co. Ltd acquired Matrix Fitness South Africa, expanding its African market presence.
- June 2021: ICON Health & Fitness rebranded to iFIT Health & Fitness Inc., emphasizing its connected fitness offerings and its 5 Million+ member base.
- January 2021: Nautilus Inc. launched next-generation Bowflex products integrated with the JRNY Digital Fitness Platform.
Future Outlook for Home Fitness Industry Market
This section summarizes the growth accelerators expected to shape the future of the home fitness industry. We examine the long-term market potential, identifying strategic opportunities for growth and innovation. The analysis focuses on factors that are expected to drive sustained market expansion in the coming years.
Home Fitness Industry Segmentation
-
1. Product Type
- 1.1. Treadmills
- 1.2. Elliptical Machines
- 1.3. Stationary Cycles
- 1.4. Rowing Machines
- 1.5. Strength Training Equipment
- 1.6. Other Product Types
-
2. Distribution Channel
- 2.1. Offline Retail Stores
- 2.2. Online Retail Stores
- 2.3. Direct Selling
Home Fitness Industry Segmentation By Geography
-
1. North America
- 1.1. United States
- 1.2. Canada
- 1.3. Mexico
- 1.4. Rest of North America
-
2. Europe
- 2.1. United Kingdom
- 2.2. Germany
- 2.3. Spain
- 2.4. France
- 2.5. Italy
- 2.6. Russia
- 2.7. Rest of Europe
-
3. Asia Pacific
- 3.1. China
- 3.2. Japan
- 3.3. India
- 3.4. Australia
- 3.5. Rest of Asia Pacific
-
4. South America
- 4.1. Brazil
- 4.2. Argentina
- 4.3. Rest of South America
-
5. Middle East and Africa
- 5.1. South Africa
- 5.2. United Arab Emirates
- 5.3. Rest of Middle East and Africa
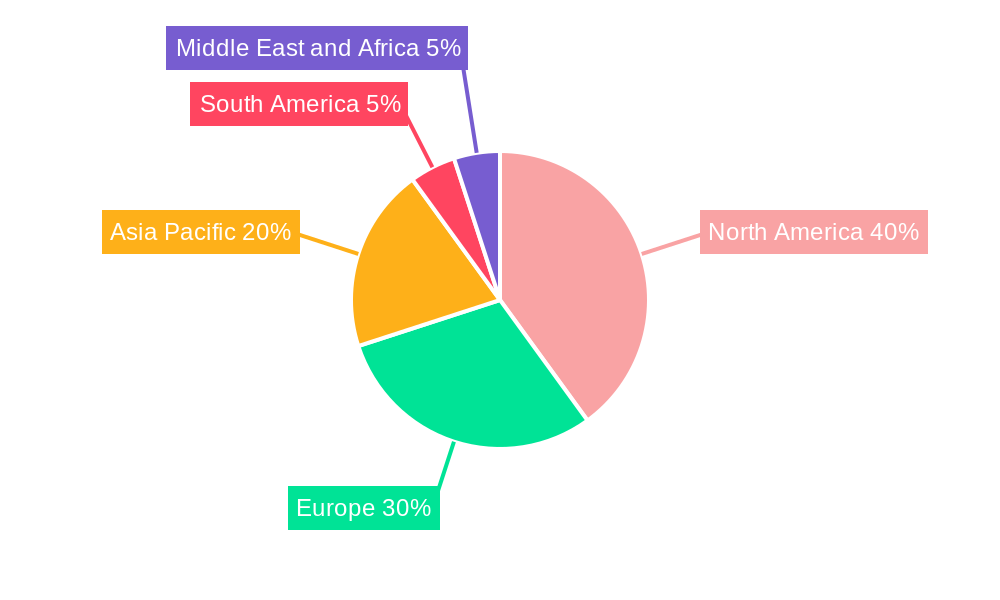
Home Fitness Industry Regional Market Share
Geographic Coverage of Home Fitness Industry
Home Fitness Industry REPORT HIGHLIGHTS
| Aspects | Details |
|---|---|
| Study Period | 2020-2034 |
| Base Year | 2025 |
| Estimated Year | 2026 |
| Forecast Period | 2026-2034 |
| Historical Period | 2020-2025 |
| Growth Rate | CAGR of 6.81% from 2020-2034 |
| Segmentation |
|
Table of Contents
- 1. Introduction
- 1.1. Research Scope
- 1.2. Market Segmentation
- 1.3. Research Objective
- 1.4. Definitions and Assumptions
- 2. Executive Summary
- 2.1. Market Snapshot
- 3. Market Dynamics
- 3.1. Market Drivers
- 3.2. Market Restrains
- 3.3. Market Trends
- 3.4. Market Opportunities
- 4. Market Factor Analysis
- 4.1. Porters Five Forces
- 4.1.1. Bargaining Power of Suppliers
- 4.1.2. Bargaining Power of Buyers
- 4.1.3. Threat of New Entrants
- 4.1.4. Threat of Substitutes
- 4.1.5. Competitive Rivalry
- 4.2. PESTEL analysis
- 4.3. BCG Analysis
- 4.3.1. Stars (High Growth, High Market Share)
- 4.3.2. Cash Cows (Low Growth, High Market Share)
- 4.3.3. Question Mark (High Growth, Low Market Share)
- 4.3.4. Dogs (Low Growth, Low Market Share)
- 4.4. Ansoff Matrix Analysis
- 4.5. Supply Chain Analysis
- 4.6. Regulatory Landscape
- 4.7. Current Market Potential and Opportunity Assessment (TAM–SAM–SOM Framework)
- 4.8. PRI Analyst Note
- 4.1. Porters Five Forces
- 5. Market Analysis, Insights and Forecast 2021-2033
- 5.1. Market Analysis, Insights and Forecast - by Product Type
- 5.1.1. Treadmills
- 5.1.2. Elliptical Machines
- 5.1.3. Stationary Cycles
- 5.1.4. Rowing Machines
- 5.1.5. Strength Training Equipment
- 5.1.6. Other Product Types
- 5.2. Market Analysis, Insights and Forecast - by Distribution Channel
- 5.2.1. Offline Retail Stores
- 5.2.2. Online Retail Stores
- 5.2.3. Direct Selling
- 5.3. Market Analysis, Insights and Forecast - by Region
- 5.3.1. North America
- 5.3.2. Europe
- 5.3.3. Asia Pacific
- 5.3.4. South America
- 5.3.5. Middle East and Africa
- 5.1. Market Analysis, Insights and Forecast - by Product Type
- 6. Global Home Fitness Industry Analysis, Insights and Forecast, 2021-2033
- 6.1. Market Analysis, Insights and Forecast - by Product Type
- 6.1.1. Treadmills
- 6.1.2. Elliptical Machines
- 6.1.3. Stationary Cycles
- 6.1.4. Rowing Machines
- 6.1.5. Strength Training Equipment
- 6.1.6. Other Product Types
- 6.2. Market Analysis, Insights and Forecast - by Distribution Channel
- 6.2.1. Offline Retail Stores
- 6.2.2. Online Retail Stores
- 6.2.3. Direct Selling
- 6.1. Market Analysis, Insights and Forecast - by Product Type
- 7. North America Home Fitness Industry Analysis, Insights and Forecast, 2020-2032
- 7.1. Market Analysis, Insights and Forecast - by Product Type
- 7.1.1. Treadmills
- 7.1.2. Elliptical Machines
- 7.1.3. Stationary Cycles
- 7.1.4. Rowing Machines
- 7.1.5. Strength Training Equipment
- 7.1.6. Other Product Types
- 7.2. Market Analysis, Insights and Forecast - by Distribution Channel
- 7.2.1. Offline Retail Stores
- 7.2.2. Online Retail Stores
- 7.2.3. Direct Selling
- 7.1. Market Analysis, Insights and Forecast - by Product Type
- 8. Europe Home Fitness Industry Analysis, Insights and Forecast, 2020-2032
- 8.1. Market Analysis, Insights and Forecast - by Product Type
- 8.1.1. Treadmills
- 8.1.2. Elliptical Machines
- 8.1.3. Stationary Cycles
- 8.1.4. Rowing Machines
- 8.1.5. Strength Training Equipment
- 8.1.6. Other Product Types
- 8.2. Market Analysis, Insights and Forecast - by Distribution Channel
- 8.2.1. Offline Retail Stores
- 8.2.2. Online Retail Stores
- 8.2.3. Direct Selling
- 8.1. Market Analysis, Insights and Forecast - by Product Type
- 9. Asia Pacific Home Fitness Industry Analysis, Insights and Forecast, 2020-2032
- 9.1. Market Analysis, Insights and Forecast - by Product Type
- 9.1.1. Treadmills
- 9.1.2. Elliptical Machines
- 9.1.3. Stationary Cycles
- 9.1.4. Rowing Machines
- 9.1.5. Strength Training Equipment
- 9.1.6. Other Product Types
- 9.2. Market Analysis, Insights and Forecast - by Distribution Channel
- 9.2.1. Offline Retail Stores
- 9.2.2. Online Retail Stores
- 9.2.3. Direct Selling
- 9.1. Market Analysis, Insights and Forecast - by Product Type
- 10. South America Home Fitness Industry Analysis, Insights and Forecast, 2020-2032
- 10.1. Market Analysis, Insights and Forecast - by Product Type
- 10.1.1. Treadmills
- 10.1.2. Elliptical Machines
- 10.1.3. Stationary Cycles
- 10.1.4. Rowing Machines
- 10.1.5. Strength Training Equipment
- 10.1.6. Other Product Types
- 10.2. Market Analysis, Insights and Forecast - by Distribution Channel
- 10.2.1. Offline Retail Stores
- 10.2.2. Online Retail Stores
- 10.2.3. Direct Selling
- 10.1. Market Analysis, Insights and Forecast - by Product Type
- 11. Middle East and Africa Home Fitness Industry Analysis, Insights and Forecast, 2020-2032
- 11.1. Market Analysis, Insights and Forecast - by Product Type
- 11.1.1. Treadmills
- 11.1.2. Elliptical Machines
- 11.1.3. Stationary Cycles
- 11.1.4. Rowing Machines
- 11.1.5. Strength Training Equipment
- 11.1.6. Other Product Types
- 11.2. Market Analysis, Insights and Forecast - by Distribution Channel
- 11.2.1. Offline Retail Stores
- 11.2.2. Online Retail Stores
- 11.2.3. Direct Selling
- 11.1. Market Analysis, Insights and Forecast - by Product Type
- 12. Competitive Analysis
- 12.1. Company Profiles
- 12.1.1 Decathlon SA*List Not Exhaustive
- 12.1.1.1. Company Overview
- 12.1.1.2. Products
- 12.1.1.3. Company Financials
- 12.1.1.4. SWOT Analysis
- 12.1.2 Anta International Limited (Amer Sports Oyj)
- 12.1.2.1. Company Overview
- 12.1.2.2. Products
- 12.1.2.3. Company Financials
- 12.1.2.4. SWOT Analysis
- 12.1.3 Peloton Interactive Inc
- 12.1.3.1. Company Overview
- 12.1.3.2. Products
- 12.1.3.3. Company Financials
- 12.1.3.4. SWOT Analysis
- 12.1.4 Dyaco International Inc
- 12.1.4.1. Company Overview
- 12.1.4.2. Products
- 12.1.4.3. Company Financials
- 12.1.4.4. SWOT Analysis
- 12.1.5 Johnson Health Tech Co Ltd
- 12.1.5.1. Company Overview
- 12.1.5.2. Products
- 12.1.5.3. Company Financials
- 12.1.5.4. SWOT Analysis
- 12.1.6 Nautilus Inc
- 12.1.6.1. Company Overview
- 12.1.6.2. Products
- 12.1.6.3. Company Financials
- 12.1.6.4. SWOT Analysis
- 12.1.7 Technogym SpA
- 12.1.7.1. Company Overview
- 12.1.7.2. Products
- 12.1.7.3. Company Financials
- 12.1.7.4. SWOT Analysis
- 12.1.8 TRUE Fitness
- 12.1.8.1. Company Overview
- 12.1.8.2. Products
- 12.1.8.3. Company Financials
- 12.1.8.4. SWOT Analysis
- 12.1.9 Icon Health & Fitness Inc
- 12.1.9.1. Company Overview
- 12.1.9.2. Products
- 12.1.9.3. Company Financials
- 12.1.9.4. SWOT Analysis
- 12.1.10 Origin Fitness Ltd (Anytime Leisure Limited)
- 12.1.10.1. Company Overview
- 12.1.10.2. Products
- 12.1.10.3. Company Financials
- 12.1.10.4. SWOT Analysis
- 12.1.1 Decathlon SA*List Not Exhaustive
- 12.2. Market Entropy
- 12.2.1 Company's Key Areas Served
- 12.2.2 Recent Developments
- 12.3. Company Market Share Analysis 2025
- 12.3.1 Top 5 Companies Market Share Analysis
- 12.3.2 Top 3 Companies Market Share Analysis
- 12.4. List of Potential Customers
- 13. Research Methodology
List of Figures
- Figure 1: Global Home Fitness Industry Revenue Breakdown (billion, %) by Region 2025 & 2033
- Figure 2: North America Home Fitness Industry Revenue (billion), by Product Type 2025 & 2033
- Figure 3: North America Home Fitness Industry Revenue Share (%), by Product Type 2025 & 2033
- Figure 4: North America Home Fitness Industry Revenue (billion), by Distribution Channel 2025 & 2033
- Figure 5: North America Home Fitness Industry Revenue Share (%), by Distribution Channel 2025 & 2033
- Figure 6: North America Home Fitness Industry Revenue (billion), by Country 2025 & 2033
- Figure 7: North America Home Fitness Industry Revenue Share (%), by Country 2025 & 2033
- Figure 8: Europe Home Fitness Industry Revenue (billion), by Product Type 2025 & 2033
- Figure 9: Europe Home Fitness Industry Revenue Share (%), by Product Type 2025 & 2033
- Figure 10: Europe Home Fitness Industry Revenue (billion), by Distribution Channel 2025 & 2033
- Figure 11: Europe Home Fitness Industry Revenue Share (%), by Distribution Channel 2025 & 2033
- Figure 12: Europe Home Fitness Industry Revenue (billion), by Country 2025 & 2033
- Figure 13: Europe Home Fitness Industry Revenue Share (%), by Country 2025 & 2033
- Figure 14: Asia Pacific Home Fitness Industry Revenue (billion), by Product Type 2025 & 2033
- Figure 15: Asia Pacific Home Fitness Industry Revenue Share (%), by Product Type 2025 & 2033
- Figure 16: Asia Pacific Home Fitness Industry Revenue (billion), by Distribution Channel 2025 & 2033
- Figure 17: Asia Pacific Home Fitness Industry Revenue Share (%), by Distribution Channel 2025 & 2033
- Figure 18: Asia Pacific Home Fitness Industry Revenue (billion), by Country 2025 & 2033
- Figure 19: Asia Pacific Home Fitness Industry Revenue Share (%), by Country 2025 & 2033
- Figure 20: South America Home Fitness Industry Revenue (billion), by Product Type 2025 & 2033
- Figure 21: South America Home Fitness Industry Revenue Share (%), by Product Type 2025 & 2033
- Figure 22: South America Home Fitness Industry Revenue (billion), by Distribution Channel 2025 & 2033
- Figure 23: South America Home Fitness Industry Revenue Share (%), by Distribution Channel 2025 & 2033
- Figure 24: South America Home Fitness Industry Revenue (billion), by Country 2025 & 2033
- Figure 25: South America Home Fitness Industry Revenue Share (%), by Country 2025 & 2033
- Figure 26: Middle East and Africa Home Fitness Industry Revenue (billion), by Product Type 2025 & 2033
- Figure 27: Middle East and Africa Home Fitness Industry Revenue Share (%), by Product Type 2025 & 2033
- Figure 28: Middle East and Africa Home Fitness Industry Revenue (billion), by Distribution Channel 2025 & 2033
- Figure 29: Middle East and Africa Home Fitness Industry Revenue Share (%), by Distribution Channel 2025 & 2033
- Figure 30: Middle East and Africa Home Fitness Industry Revenue (billion), by Country 2025 & 2033
- Figure 31: Middle East and Africa Home Fitness Industry Revenue Share (%), by Country 2025 & 2033
List of Tables
- Table 1: Global Home Fitness Industry Revenue billion Forecast, by Product Type 2020 & 2033
- Table 2: Global Home Fitness Industry Revenue billion Forecast, by Distribution Channel 2020 & 2033
- Table 3: Global Home Fitness Industry Revenue billion Forecast, by Region 2020 & 2033
- Table 4: Global Home Fitness Industry Revenue billion Forecast, by Product Type 2020 & 2033
- Table 5: Global Home Fitness Industry Revenue billion Forecast, by Distribution Channel 2020 & 2033
- Table 6: Global Home Fitness Industry Revenue billion Forecast, by Country 2020 & 2033
- Table 7: United States Home Fitness Industry Revenue (billion) Forecast, by Application 2020 & 2033
- Table 8: Canada Home Fitness Industry Revenue (billion) Forecast, by Application 2020 & 2033
- Table 9: Mexico Home Fitness Industry Revenue (billion) Forecast, by Application 2020 & 2033
- Table 10: Rest of North America Home Fitness Industry Revenue (billion) Forecast, by Application 2020 & 2033
- Table 11: Global Home Fitness Industry Revenue billion Forecast, by Product Type 2020 & 2033
- Table 12: Global Home Fitness Industry Revenue billion Forecast, by Distribution Channel 2020 & 2033
- Table 13: Global Home Fitness Industry Revenue billion Forecast, by Country 2020 & 2033
- Table 14: United Kingdom Home Fitness Industry Revenue (billion) Forecast, by Application 2020 & 2033
- Table 15: Germany Home Fitness Industry Revenue (billion) Forecast, by Application 2020 & 2033
- Table 16: Spain Home Fitness Industry Revenue (billion) Forecast, by Application 2020 & 2033
- Table 17: France Home Fitness Industry Revenue (billion) Forecast, by Application 2020 & 2033
- Table 18: Italy Home Fitness Industry Revenue (billion) Forecast, by Application 2020 & 2033
- Table 19: Russia Home Fitness Industry Revenue (billion) Forecast, by Application 2020 & 2033
- Table 20: Rest of Europe Home Fitness Industry Revenue (billion) Forecast, by Application 2020 & 2033
- Table 21: Global Home Fitness Industry Revenue billion Forecast, by Product Type 2020 & 2033
- Table 22: Global Home Fitness Industry Revenue billion Forecast, by Distribution Channel 2020 & 2033
- Table 23: Global Home Fitness Industry Revenue billion Forecast, by Country 2020 & 2033
- Table 24: China Home Fitness Industry Revenue (billion) Forecast, by Application 2020 & 2033
- Table 25: Japan Home Fitness Industry Revenue (billion) Forecast, by Application 2020 & 2033
- Table 26: India Home Fitness Industry Revenue (billion) Forecast, by Application 2020 & 2033
- Table 27: Australia Home Fitness Industry Revenue (billion) Forecast, by Application 2020 & 2033
- Table 28: Rest of Asia Pacific Home Fitness Industry Revenue (billion) Forecast, by Application 2020 & 2033
- Table 29: Global Home Fitness Industry Revenue billion Forecast, by Product Type 2020 & 2033
- Table 30: Global Home Fitness Industry Revenue billion Forecast, by Distribution Channel 2020 & 2033
- Table 31: Global Home Fitness Industry Revenue billion Forecast, by Country 2020 & 2033
- Table 32: Brazil Home Fitness Industry Revenue (billion) Forecast, by Application 2020 & 2033
- Table 33: Argentina Home Fitness Industry Revenue (billion) Forecast, by Application 2020 & 2033
- Table 34: Rest of South America Home Fitness Industry Revenue (billion) Forecast, by Application 2020 & 2033
- Table 35: Global Home Fitness Industry Revenue billion Forecast, by Product Type 2020 & 2033
- Table 36: Global Home Fitness Industry Revenue billion Forecast, by Distribution Channel 2020 & 2033
- Table 37: Global Home Fitness Industry Revenue billion Forecast, by Country 2020 & 2033
- Table 38: South Africa Home Fitness Industry Revenue (billion) Forecast, by Application 2020 & 2033
- Table 39: United Arab Emirates Home Fitness Industry Revenue (billion) Forecast, by Application 2020 & 2033
- Table 40: Rest of Middle East and Africa Home Fitness Industry Revenue (billion) Forecast, by Application 2020 & 2033
Frequently Asked Questions
1. What is the projected Compound Annual Growth Rate (CAGR) of the Home Fitness Industry?
The projected CAGR is approximately 6.81%.
2. Which companies are prominent players in the Home Fitness Industry?
Key companies in the market include Decathlon SA*List Not Exhaustive, Anta International Limited (Amer Sports Oyj), Peloton Interactive Inc, Dyaco International Inc, Johnson Health Tech Co Ltd, Nautilus Inc, Technogym SpA, TRUE Fitness, Icon Health & Fitness Inc, Origin Fitness Ltd (Anytime Leisure Limited).
3. What are the main segments of the Home Fitness Industry?
The market segments include Product Type, Distribution Channel.
4. Can you provide details about the market size?
The market size is estimated to be USD 12.88 billion as of 2022.
5. What are some drivers contributing to market growth?
Aggressive Marketing and Strategic Investments by Key Players; Growing Prevalence of Smokeless Tobacco Supported By Growth in Production of Tobacco.
6. What are the notable trends driving market growth?
Rising Health Awareness Among the Consumers.
7. Are there any restraints impacting market growth?
Stringent Government Regulations Leading to Ban on Smokeless Tobacco.
8. Can you provide examples of recent developments in the market?
August 2021: Johnson Health Tech Co. Ltd acquired Matrix Fitness South Africa, a distributor for JHT prior to the acquisition, becoming the first fitness equipment company to have a wholly-owned subsidiary in Africa. The major strategy behind this move was to expand the business in the African region, which will result in positive revenue growth in the long term.
9. What pricing options are available for accessing the report?
Pricing options include single-user, multi-user, and enterprise licenses priced at USD 4750, USD 5250, and USD 8750 respectively.
10. Is the market size provided in terms of value or volume?
The market size is provided in terms of value, measured in billion.
11. Are there any specific market keywords associated with the report?
Yes, the market keyword associated with the report is "Home Fitness Industry," which aids in identifying and referencing the specific market segment covered.
12. How do I determine which pricing option suits my needs best?
The pricing options vary based on user requirements and access needs. Individual users may opt for single-user licenses, while businesses requiring broader access may choose multi-user or enterprise licenses for cost-effective access to the report.
13. Are there any additional resources or data provided in the Home Fitness Industry report?
While the report offers comprehensive insights, it's advisable to review the specific contents or supplementary materials provided to ascertain if additional resources or data are available.
14. How can I stay updated on further developments or reports in the Home Fitness Industry?
To stay informed about further developments, trends, and reports in the Home Fitness Industry, consider subscribing to industry newsletters, following relevant companies and organizations, or regularly checking reputable industry news sources and publications.
Methodology
Step 1 - Identification of Relevant Samples Size from Population Database


Step 2 - Approaches for Defining Global Market Size (Value, Volume* & Price*)

Note*: In applicable scenarios
Step 3 - Data Sources
Primary Research
- Web Analytics
- Survey Reports
- Research Institute
- Latest Research Reports
- Opinion Leaders
Secondary Research
- Annual Reports
- White Paper
- Latest Press Release
- Industry Association
- Paid Database
- Investor Presentations

Step 4 - Data Triangulation
Involves using different sources of information in order to increase the validity of a study
These sources are likely to be stakeholders in a program - participants, other researchers, program staff, other community members, and so on.
Then we put all data in single framework & apply various statistical tools to find out the dynamic on the market.
During the analysis stage, feedback from the stakeholder groups would be compared to determine areas of agreement as well as areas of divergence