

Key Insights
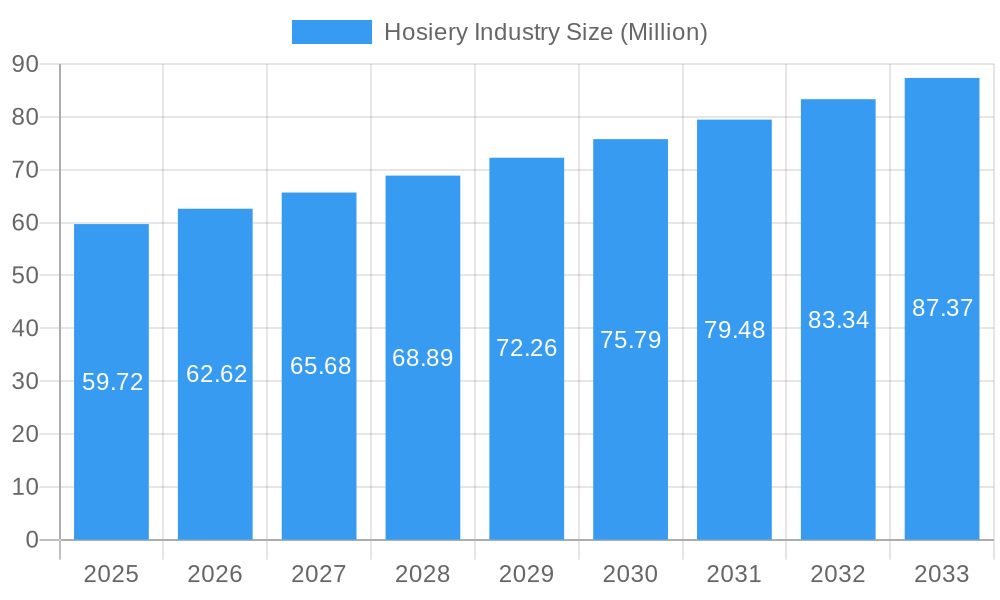
The global hosiery market, valued at $59.72 million in 2025, is projected to experience robust growth, exhibiting a Compound Annual Growth Rate (CAGR) of 4.86% from 2025 to 2033. This expansion is driven by several key factors. The increasing popularity of comfortable and fashionable hosiery amongst both men and women fuels demand across various product types, including body stockings, socks, knee highs, and hold-ups. Furthermore, the rise of online retail channels provides convenient access for consumers, boosting market penetration. Expanding consumer disposable incomes, particularly in developing economies within the Asia-Pacific region, contribute significantly to the market's growth trajectory. However, the market faces certain challenges, including the emergence of alternative legwear options and fluctuations in raw material prices which impact production costs and profitability. The competitive landscape is dynamic, with established players like Hanesbrands and Jockey International Inc. alongside newer brands such as Skims and Heist Studios vying for market share through innovation in product design, materials, and marketing strategies. Different regional markets demonstrate varying growth rates, with North America and Europe currently holding significant shares but Asia-Pacific poised for substantial expansion due to its large and growing population.
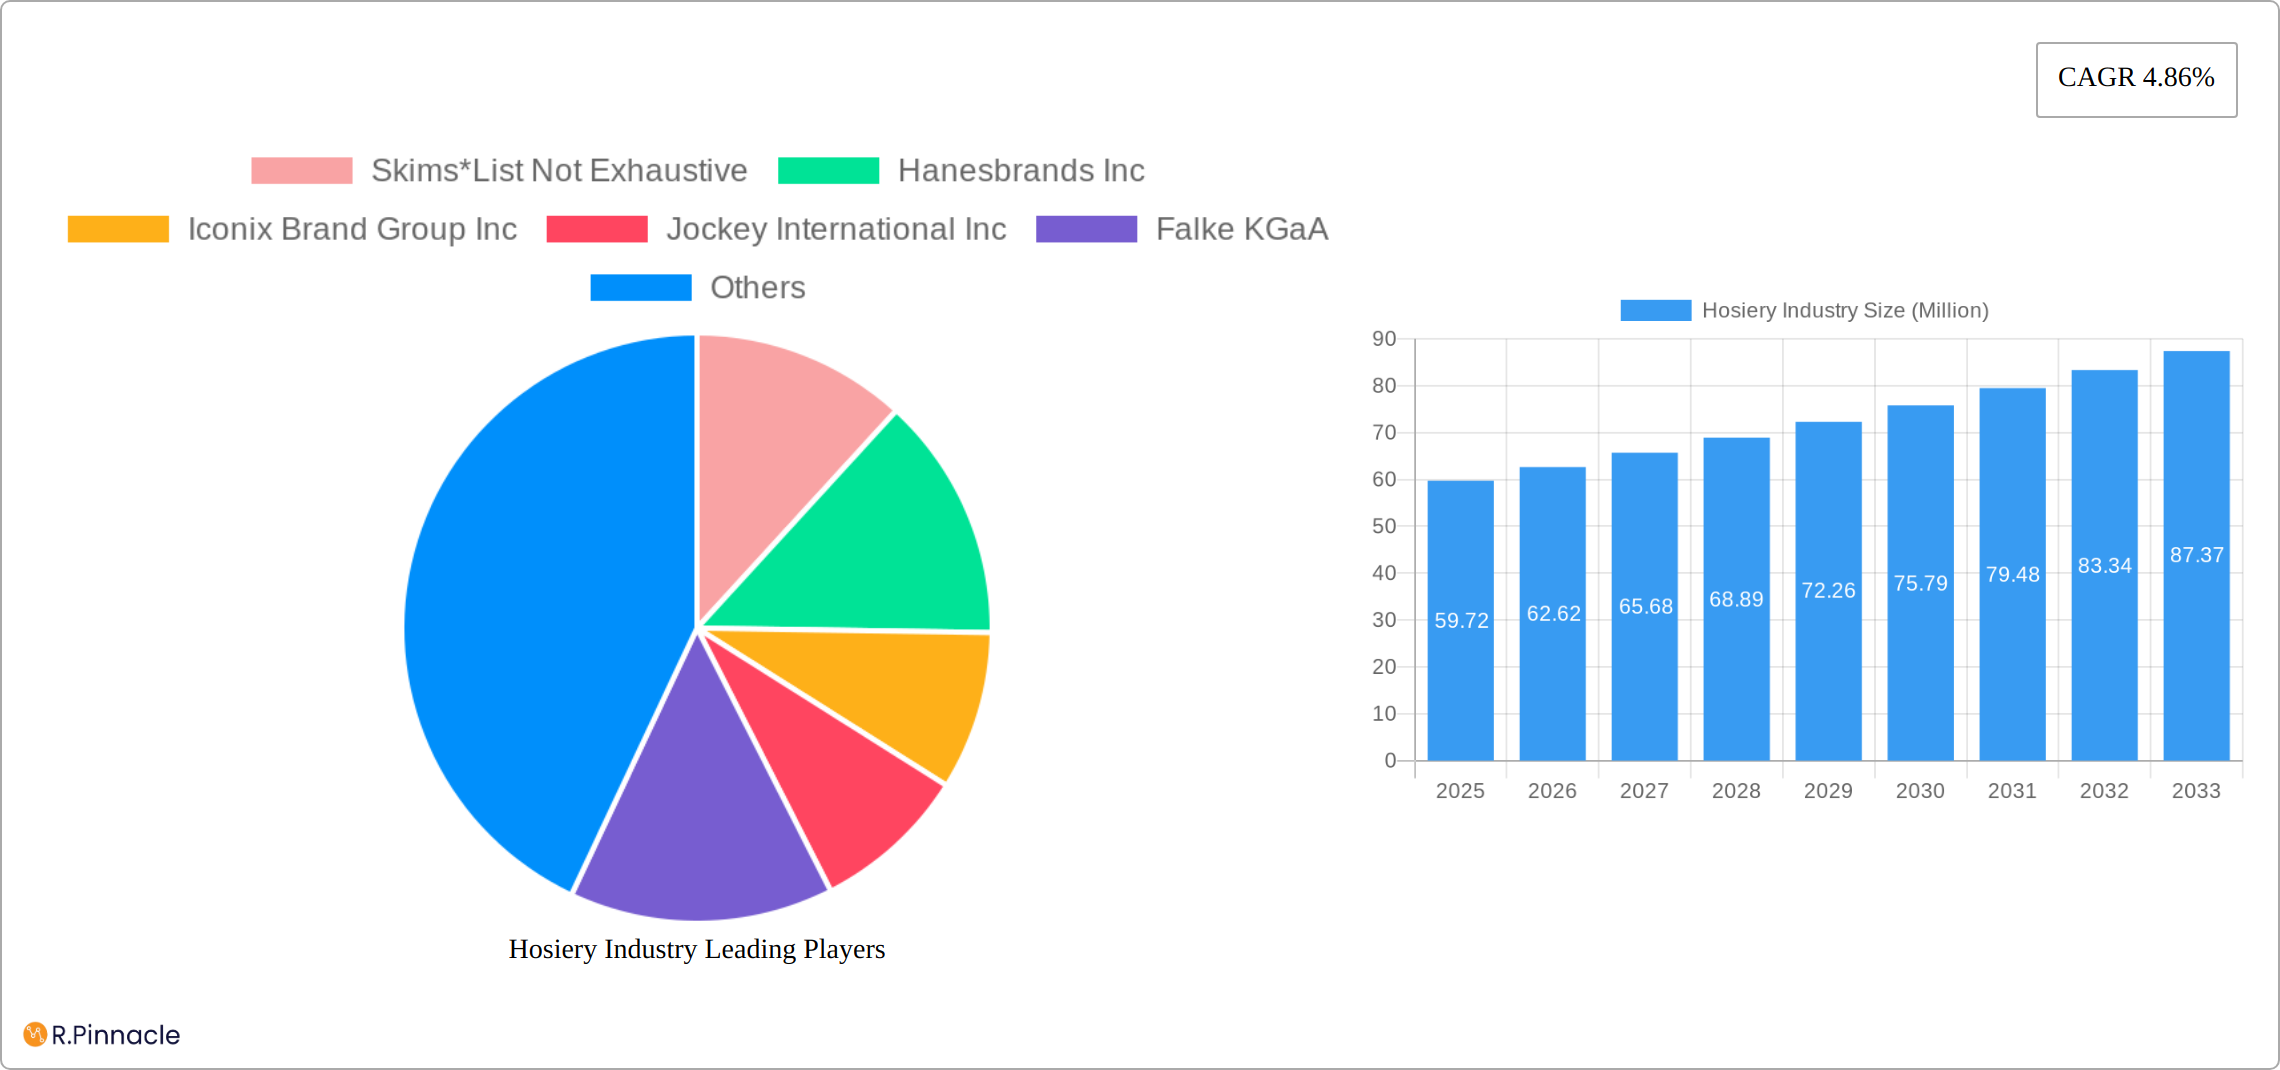
Hosiery Industry Market Size (In Million)
Segmentation within the hosiery market reveals further insights into growth drivers. The women's segment is currently the largest, but the men's segment is showing promising growth, driven by increased awareness of men's hosiery and fashion trends. Online retail channels are experiencing the fastest growth rates within the distribution network due to its convenient and accessible nature. Product diversification, with innovative materials and designs, is key for brands to maintain a competitive edge. Future market developments will likely center on sustainable and ethically sourced materials to appeal to the growing environmentally conscious consumer base. Strategic partnerships, innovative marketing campaigns, and the integration of technology in the supply chain will play a crucial role in shaping the future of the hosiery industry.
Hosiery Industry Company Market Share
Hosiery Industry Market Report: 2019-2033
This comprehensive report provides a detailed analysis of the global hosiery industry, offering invaluable insights for industry professionals, investors, and strategic decision-makers. Covering the period from 2019 to 2033, with a base year of 2025, this report examines market dynamics, key players, and future trends to provide a complete understanding of this evolving market. The global hosiery market is projected to reach xx Million by 2033, exhibiting a CAGR of xx% during the forecast period (2025-2033).
Hosiery Industry Market Structure & Innovation Trends
The hosiery industry is characterized by a mix of large multinational corporations and smaller niche players. Market concentration is moderate, with a few dominant players holding significant market share but numerous smaller companies catering to specific segments or geographic regions. Hanesbrands Inc. and Jockey International Inc. are prominent examples of established players, while newer brands like Skims and Heist Studios are disrupting the market with innovative products and marketing strategies. The global market value in 2024 is estimated to be xx Million. M&A activity in the sector has been relatively low in recent years, with deal values averaging xx Million. Innovation drivers include the growing demand for sustainable and functional hosiery, technological advancements in fabric production, and evolving consumer preferences for comfort and style. Regulatory frameworks vary across countries, impacting material sourcing and labeling requirements. Product substitutes include leggings and other legwear, posing a competitive challenge. End-user demographics are shifting toward a more diverse and inclusive market, leading to the development of specialized products.
Hosiery Industry Market Dynamics & Trends
The hosiery market is undergoing a dynamic transformation driven by evolving consumer preferences and technological advancements. Demand for comfortable, functional, and fashionable hosiery is surging across demographics, fueling substantial market growth. This growth is propelled by several key factors:
- Technological Innovation: Advancements in fiber technology, manufacturing processes, and sustainable production methods are revolutionizing the industry, leading to higher-quality, more comfortable, and environmentally conscious products.
- Shifting Consumer Preferences: Consumers increasingly seek innovative materials (like bamboo or recycled fibers), enhanced comfort features (such as Falke's pressure-free socks), and sustainable production practices (as exemplified by Heist Studio's commitment to recycled materials). This demand drives the development of specialized hosiery for various activities and lifestyles.
- E-commerce Expansion: The rise of online retail is reshaping distribution channels, fostering direct-to-consumer engagement and expanding market reach beyond traditional brick-and-mortar stores.
- Competitive Landscape: The market features both established brands leveraging their brand equity and newer entrants disrupting the industry with innovative products and targeted marketing strategies. This competition fosters innovation and drives down prices for consumers.
- Economic Factors: Fluctuations in global economies and disposable incomes directly impact consumer spending on non-essential items like hosiery. Economic growth in emerging markets presents significant opportunities.
The future of the hosiery market is expected to be shaped by a confluence of these factors, leading to continuous evolution and innovation within the industry.
Dominant Regions & Segments in Hosiery Industry
Leading Regions: North America and Europe currently hold the largest market share due to high consumer spending and well-established retail infrastructure. However, the Asia-Pacific region is poised for significant growth fueled by rising disposable incomes and a growing fashion-conscious population.
Leading Product Type: Socks remain the dominant segment due to their widespread use and diverse applications (athletic, casual, dress). However, we are also seeing strong growth in specialized hosiery segments like compression socks, body stockings, and shapewear, driven by increased health awareness and fashion trends.
Leading End-User: While women traditionally represent the largest end-user segment, the men's hosiery market is experiencing notable growth, driven by a wider range of styles and increased awareness of the benefits of specialized hosiery for comfort and performance.
Leading Distribution Channel: Online retail is rapidly gaining market share due to its convenience and broad reach. Specialty stores continue to cater to specific customer segments with curated selections, while supermarkets/hypermarkets maintain a significant presence, particularly for basic hosiery products.
The dominance of these segments is influenced by a combination of factors including consumer preferences for comfort, convenience, and fashion; robust retail infrastructure; increased purchasing power; and government support for textile industries in key regions.
Hosiery Industry Product Innovations
Recent innovations in the hosiery industry focus on enhanced comfort, sustainability, and functionality. Falke's pressure-free running socks, Heist Studio's sustainable tights, and Skims' diverse sock collection exemplify these trends. Technological advancements in fiber technology, including the use of recycled materials and innovative yarn structures, contribute to improved performance and eco-friendly production. These innovations target specific consumer needs and preferences, enhancing market fit and fostering competitive advantages.
Report Scope & Segmentation Analysis
This report provides a detailed segmentation analysis of the global hosiery market, offering a comprehensive overview across key parameters:
Product Type: The report meticulously analyzes market size, growth projections, competitive dynamics, and consumer demand for various product types, including body stockings, socks (further categorized by type, e.g., athletic, dress, casual), knee highs, hold-ups, and other specialized hosiery. Technological developments influencing each segment are also highlighted.
End-User: A detailed analysis of the men's and women's segments is provided, considering demographic trends, consumer preferences, and the effectiveness of marketing strategies tailored to each group. Growth projections are based on market research and future trend predictions.
Distribution Channel: The report comprehensively examines market size, growth projections, and competitive landscapes for each distribution channel: supermarkets/hypermarkets, specialty stores, online retail stores, and other channels. The analysis considers the strengths and weaknesses of each channel in reaching target customer segments.
Key Drivers of Hosiery Industry Growth
The hosiery industry's growth is fueled by several key factors. Rising disposable incomes, particularly in developing economies, are driving increased consumer spending on apparel and accessories. Technological advancements in fiber production and manufacturing processes lead to improved product quality, comfort, and durability. Growing consumer preference for comfort, style, and functionality is shaping product innovation and market growth. E-commerce expansion provides new distribution avenues and enhances market access.
Challenges in the Hosiery Industry Sector
The hosiery industry faces several challenges. Fluctuating raw material prices and supply chain disruptions can impact profitability and production efficiency. Intense competition from both established and emerging brands requires continuous innovation and brand building. Stricter environmental regulations necessitate sustainable manufacturing practices, presenting operational and cost challenges. Economic downturns can lead to reduced consumer spending on non-essential items like hosiery.
Emerging Opportunities in Hosiery Industry
The hosiery market presents several compelling opportunities for growth and innovation:
- Sustainable and Ethical Production: Growing consumer demand for environmentally friendly and ethically sourced hosiery creates significant opportunities for companies adopting eco-friendly manufacturing practices and transparent supply chains.
- Athleisure and Activewear: The rise of athleisure and activewear continues to fuel demand for specialized performance hosiery designed for comfort, breathability, and moisture-wicking capabilities.
- Personalization and Customization: Offering personalized and customized hosiery allows companies to cater to individual needs and preferences, creating niche market opportunities and enhancing customer loyalty.
- Expansion into New Markets: Untapped markets in developing economies present significant growth potential, requiring tailored strategies to meet local consumer needs and preferences.
- Technological Advancements in Materials and Manufacturing: Continued innovation in materials science and manufacturing processes will lead to the creation of new product categories and improvements in existing ones.
Leading Players in the Hosiery Industry Market
- Hanesbrands Inc
- Iconix Brand Group Inc
- Jockey International Inc
- Falke KGaA
- Gilfin S P A (Golden Lady Company S P A)
- Lanvin Group (Wolford AG)
- Spanx Inc
- Heist Studios
- CSP International Fashion Group S P A
- Carolina Hosiery Mill Inc (Carolina Ultimate Real Tree)
- G-III Apparel Group (Donna Karan International)
- Skims
Key Developments in Hosiery Industry
- September 2021: SKIMS expanded its product portfolio with the launch of its first sock collection, demonstrating the growing importance of this segment for major players.
- October 2021: Heist Studios further solidified the trend towards sustainable products with the launch of four new sustainable tights, highlighting the increasing consumer demand for eco-conscious choices.
- May 2022: Falke's introduction of pressure-free running socks showcased the ongoing technological advancements in comfort and performance features within the hosiery industry, driving innovation and consumer interest.
- [Add More Recent Developments Here]: Include other significant developments, acquisitions, product launches, or industry partnerships to keep the content current.
Future Outlook for Hosiery Industry Market
The hosiery industry's future looks promising, driven by continuous product innovation, expanding distribution channels, and evolving consumer preferences. Growth will be influenced by factors such as increasing disposable incomes, technological advancements, and sustainability initiatives. Companies adopting innovative technologies and sustainable practices are well-positioned for success. The market is expected to witness a sustained period of growth, driven by the evolving needs and preferences of consumers across various demographics and geographic locations.
Hosiery Industry Segmentation
-
1. Product Type
- 1.1. Body stockings
- 1.2. Socks
- 1.3. Knee highs, Hold-ups
- 1.4. Other Product Types
-
2. End-User
- 2.1. Men
- 2.2. Women
-
3. Distribution Channel
- 3.1. Supermarkets/Hypermarkets
- 3.2. Specialty Stores
- 3.3. Online Retail Stores
- 3.4. Other Distribution Channels
Hosiery Industry Segmentation By Geography
-
1. North America
- 1.1. United States
- 1.2. Canada
- 1.3. Mexico
- 1.4. Rest of North America
-
2. Europe
- 2.1. Spain
- 2.2. United Kingdom
- 2.3. Germany
- 2.4. France
- 2.5. Italy
- 2.6. Russia
- 2.7. Rest of Europe
-
3. Asia Pacific
- 3.1. China
- 3.2. Japan
- 3.3. India
- 3.4. Australia
- 3.5. Rest of Asia Pacific
-
4. South America
- 4.1. Brazil
- 4.2. Argentina
- 4.3. Rest of South America
-
5. Middle East and Africa
- 5.1. South Africa
- 5.2. Saudi Arabia
- 5.3. Rest of Middle East and Africa
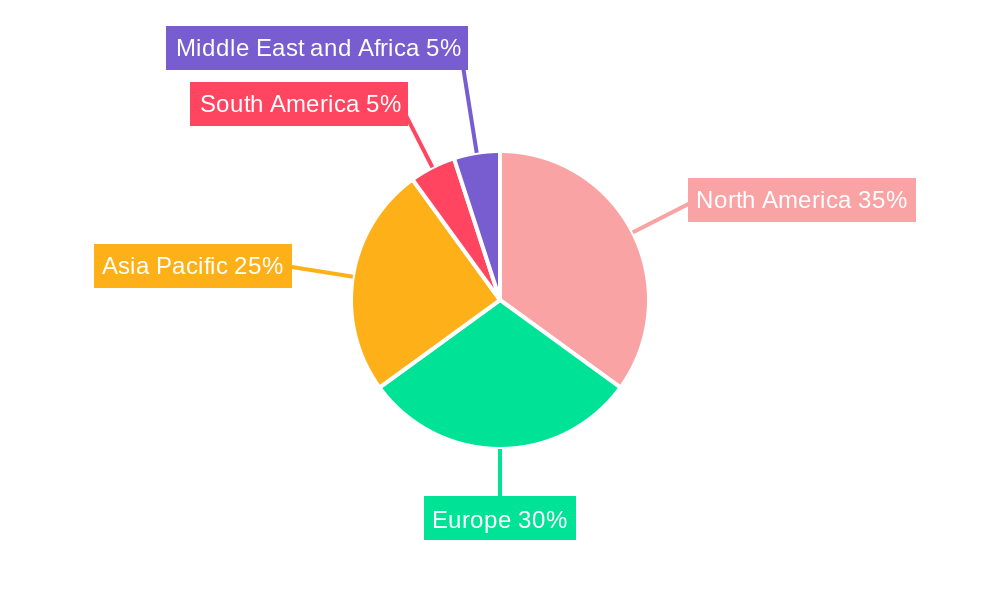
Hosiery Industry Regional Market Share
Geographic Coverage of Hosiery Industry
Hosiery Industry REPORT HIGHLIGHTS
| Aspects | Details |
|---|---|
| Study Period | 2020-2034 |
| Base Year | 2025 |
| Estimated Year | 2026 |
| Forecast Period | 2026-2034 |
| Historical Period | 2020-2025 |
| Growth Rate | CAGR of 4.86% from 2020-2034 |
| Segmentation |
|
Table of Contents
- 1. Introduction
- 1.1. Research Scope
- 1.2. Market Segmentation
- 1.3. Research Objective
- 1.4. Definitions and Assumptions
- 2. Executive Summary
- 2.1. Market Snapshot
- 3. Market Dynamics
- 3.1. Market Drivers
- 3.2. Market Restrains
- 3.3. Market Trends
- 3.4. Market Opportunities
- 4. Market Factor Analysis
- 4.1. Porters Five Forces
- 4.1.1. Bargaining Power of Suppliers
- 4.1.2. Bargaining Power of Buyers
- 4.1.3. Threat of New Entrants
- 4.1.4. Threat of Substitutes
- 4.1.5. Competitive Rivalry
- 4.2. PESTEL analysis
- 4.3. BCG Analysis
- 4.3.1. Stars (High Growth, High Market Share)
- 4.3.2. Cash Cows (Low Growth, High Market Share)
- 4.3.3. Question Mark (High Growth, Low Market Share)
- 4.3.4. Dogs (Low Growth, Low Market Share)
- 4.4. Ansoff Matrix Analysis
- 4.5. Supply Chain Analysis
- 4.6. Regulatory Landscape
- 4.7. Current Market Potential and Opportunity Assessment (TAM–SAM–SOM Framework)
- 4.8. PRI Analyst Note
- 4.1. Porters Five Forces
- 5. Market Analysis, Insights and Forecast 2021-2033
- 5.1. Market Analysis, Insights and Forecast - by Product Type
- 5.1.1. Body stockings
- 5.1.2. Socks
- 5.1.3. Knee highs, Hold-ups
- 5.1.4. Other Product Types
- 5.2. Market Analysis, Insights and Forecast - by End-User
- 5.2.1. Men
- 5.2.2. Women
- 5.3. Market Analysis, Insights and Forecast - by Distribution Channel
- 5.3.1. Supermarkets/Hypermarkets
- 5.3.2. Specialty Stores
- 5.3.3. Online Retail Stores
- 5.3.4. Other Distribution Channels
- 5.4. Market Analysis, Insights and Forecast - by Region
- 5.4.1. North America
- 5.4.2. Europe
- 5.4.3. Asia Pacific
- 5.4.4. South America
- 5.4.5. Middle East and Africa
- 5.1. Market Analysis, Insights and Forecast - by Product Type
- 6. Global Hosiery Industry Analysis, Insights and Forecast, 2021-2033
- 6.1. Market Analysis, Insights and Forecast - by Product Type
- 6.1.1. Body stockings
- 6.1.2. Socks
- 6.1.3. Knee highs, Hold-ups
- 6.1.4. Other Product Types
- 6.2. Market Analysis, Insights and Forecast - by End-User
- 6.2.1. Men
- 6.2.2. Women
- 6.3. Market Analysis, Insights and Forecast - by Distribution Channel
- 6.3.1. Supermarkets/Hypermarkets
- 6.3.2. Specialty Stores
- 6.3.3. Online Retail Stores
- 6.3.4. Other Distribution Channels
- 6.1. Market Analysis, Insights and Forecast - by Product Type
- 7. North America Hosiery Industry Analysis, Insights and Forecast, 2020-2032
- 7.1. Market Analysis, Insights and Forecast - by Product Type
- 7.1.1. Body stockings
- 7.1.2. Socks
- 7.1.3. Knee highs, Hold-ups
- 7.1.4. Other Product Types
- 7.2. Market Analysis, Insights and Forecast - by End-User
- 7.2.1. Men
- 7.2.2. Women
- 7.3. Market Analysis, Insights and Forecast - by Distribution Channel
- 7.3.1. Supermarkets/Hypermarkets
- 7.3.2. Specialty Stores
- 7.3.3. Online Retail Stores
- 7.3.4. Other Distribution Channels
- 7.1. Market Analysis, Insights and Forecast - by Product Type
- 8. Europe Hosiery Industry Analysis, Insights and Forecast, 2020-2032
- 8.1. Market Analysis, Insights and Forecast - by Product Type
- 8.1.1. Body stockings
- 8.1.2. Socks
- 8.1.3. Knee highs, Hold-ups
- 8.1.4. Other Product Types
- 8.2. Market Analysis, Insights and Forecast - by End-User
- 8.2.1. Men
- 8.2.2. Women
- 8.3. Market Analysis, Insights and Forecast - by Distribution Channel
- 8.3.1. Supermarkets/Hypermarkets
- 8.3.2. Specialty Stores
- 8.3.3. Online Retail Stores
- 8.3.4. Other Distribution Channels
- 8.1. Market Analysis, Insights and Forecast - by Product Type
- 9. Asia Pacific Hosiery Industry Analysis, Insights and Forecast, 2020-2032
- 9.1. Market Analysis, Insights and Forecast - by Product Type
- 9.1.1. Body stockings
- 9.1.2. Socks
- 9.1.3. Knee highs, Hold-ups
- 9.1.4. Other Product Types
- 9.2. Market Analysis, Insights and Forecast - by End-User
- 9.2.1. Men
- 9.2.2. Women
- 9.3. Market Analysis, Insights and Forecast - by Distribution Channel
- 9.3.1. Supermarkets/Hypermarkets
- 9.3.2. Specialty Stores
- 9.3.3. Online Retail Stores
- 9.3.4. Other Distribution Channels
- 9.1. Market Analysis, Insights and Forecast - by Product Type
- 10. South America Hosiery Industry Analysis, Insights and Forecast, 2020-2032
- 10.1. Market Analysis, Insights and Forecast - by Product Type
- 10.1.1. Body stockings
- 10.1.2. Socks
- 10.1.3. Knee highs, Hold-ups
- 10.1.4. Other Product Types
- 10.2. Market Analysis, Insights and Forecast - by End-User
- 10.2.1. Men
- 10.2.2. Women
- 10.3. Market Analysis, Insights and Forecast - by Distribution Channel
- 10.3.1. Supermarkets/Hypermarkets
- 10.3.2. Specialty Stores
- 10.3.3. Online Retail Stores
- 10.3.4. Other Distribution Channels
- 10.1. Market Analysis, Insights and Forecast - by Product Type
- 11. Middle East and Africa Hosiery Industry Analysis, Insights and Forecast, 2020-2032
- 11.1. Market Analysis, Insights and Forecast - by Product Type
- 11.1.1. Body stockings
- 11.1.2. Socks
- 11.1.3. Knee highs, Hold-ups
- 11.1.4. Other Product Types
- 11.2. Market Analysis, Insights and Forecast - by End-User
- 11.2.1. Men
- 11.2.2. Women
- 11.3. Market Analysis, Insights and Forecast - by Distribution Channel
- 11.3.1. Supermarkets/Hypermarkets
- 11.3.2. Specialty Stores
- 11.3.3. Online Retail Stores
- 11.3.4. Other Distribution Channels
- 11.1. Market Analysis, Insights and Forecast - by Product Type
- 12. Competitive Analysis
- 12.1. Company Profiles
- 12.1.1 Skims*List Not Exhaustive
- 12.1.1.1. Company Overview
- 12.1.1.2. Products
- 12.1.1.3. Company Financials
- 12.1.1.4. SWOT Analysis
- 12.1.2 Hanesbrands Inc
- 12.1.2.1. Company Overview
- 12.1.2.2. Products
- 12.1.2.3. Company Financials
- 12.1.2.4. SWOT Analysis
- 12.1.3 Iconix Brand Group Inc
- 12.1.3.1. Company Overview
- 12.1.3.2. Products
- 12.1.3.3. Company Financials
- 12.1.3.4. SWOT Analysis
- 12.1.4 Jockey International Inc
- 12.1.4.1. Company Overview
- 12.1.4.2. Products
- 12.1.4.3. Company Financials
- 12.1.4.4. SWOT Analysis
- 12.1.5 Falke KGaA
- 12.1.5.1. Company Overview
- 12.1.5.2. Products
- 12.1.5.3. Company Financials
- 12.1.5.4. SWOT Analysis
- 12.1.6 Gilfin S P A (Golden Lady Company S P A)
- 12.1.6.1. Company Overview
- 12.1.6.2. Products
- 12.1.6.3. Company Financials
- 12.1.6.4. SWOT Analysis
- 12.1.7 Lanvin Group (Wolford AG)
- 12.1.7.1. Company Overview
- 12.1.7.2. Products
- 12.1.7.3. Company Financials
- 12.1.7.4. SWOT Analysis
- 12.1.8 Spanx Inc
- 12.1.8.1. Company Overview
- 12.1.8.2. Products
- 12.1.8.3. Company Financials
- 12.1.8.4. SWOT Analysis
- 12.1.9 Heist Studios
- 12.1.9.1. Company Overview
- 12.1.9.2. Products
- 12.1.9.3. Company Financials
- 12.1.9.4. SWOT Analysis
- 12.1.10 CSP International Fashion Group S P A
- 12.1.10.1. Company Overview
- 12.1.10.2. Products
- 12.1.10.3. Company Financials
- 12.1.10.4. SWOT Analysis
- 12.1.11 Carolina Hosiery Mill Inc (Carolina Ultimate Real Tree)
- 12.1.11.1. Company Overview
- 12.1.11.2. Products
- 12.1.11.3. Company Financials
- 12.1.11.4. SWOT Analysis
- 12.1.12 G-III Apparel Group (Donna Karan International)
- 12.1.12.1. Company Overview
- 12.1.12.2. Products
- 12.1.12.3. Company Financials
- 12.1.12.4. SWOT Analysis
- 12.1.1 Skims*List Not Exhaustive
- 12.2. Market Entropy
- 12.2.1 Company's Key Areas Served
- 12.2.2 Recent Developments
- 12.3. Company Market Share Analysis 2025
- 12.3.1 Top 5 Companies Market Share Analysis
- 12.3.2 Top 3 Companies Market Share Analysis
- 12.4. List of Potential Customers
- 13. Research Methodology
List of Figures
- Figure 1: Global Hosiery Industry Revenue Breakdown (Million, %) by Region 2025 & 2033
- Figure 2: Global Hosiery Industry Volume Breakdown (K Units, %) by Region 2025 & 2033
- Figure 3: North America Hosiery Industry Revenue (Million), by Product Type 2025 & 2033
- Figure 4: North America Hosiery Industry Volume (K Units), by Product Type 2025 & 2033
- Figure 5: North America Hosiery Industry Revenue Share (%), by Product Type 2025 & 2033
- Figure 6: North America Hosiery Industry Volume Share (%), by Product Type 2025 & 2033
- Figure 7: North America Hosiery Industry Revenue (Million), by End-User 2025 & 2033
- Figure 8: North America Hosiery Industry Volume (K Units), by End-User 2025 & 2033
- Figure 9: North America Hosiery Industry Revenue Share (%), by End-User 2025 & 2033
- Figure 10: North America Hosiery Industry Volume Share (%), by End-User 2025 & 2033
- Figure 11: North America Hosiery Industry Revenue (Million), by Distribution Channel 2025 & 2033
- Figure 12: North America Hosiery Industry Volume (K Units), by Distribution Channel 2025 & 2033
- Figure 13: North America Hosiery Industry Revenue Share (%), by Distribution Channel 2025 & 2033
- Figure 14: North America Hosiery Industry Volume Share (%), by Distribution Channel 2025 & 2033
- Figure 15: North America Hosiery Industry Revenue (Million), by Country 2025 & 2033
- Figure 16: North America Hosiery Industry Volume (K Units), by Country 2025 & 2033
- Figure 17: North America Hosiery Industry Revenue Share (%), by Country 2025 & 2033
- Figure 18: North America Hosiery Industry Volume Share (%), by Country 2025 & 2033
- Figure 19: Europe Hosiery Industry Revenue (Million), by Product Type 2025 & 2033
- Figure 20: Europe Hosiery Industry Volume (K Units), by Product Type 2025 & 2033
- Figure 21: Europe Hosiery Industry Revenue Share (%), by Product Type 2025 & 2033
- Figure 22: Europe Hosiery Industry Volume Share (%), by Product Type 2025 & 2033
- Figure 23: Europe Hosiery Industry Revenue (Million), by End-User 2025 & 2033
- Figure 24: Europe Hosiery Industry Volume (K Units), by End-User 2025 & 2033
- Figure 25: Europe Hosiery Industry Revenue Share (%), by End-User 2025 & 2033
- Figure 26: Europe Hosiery Industry Volume Share (%), by End-User 2025 & 2033
- Figure 27: Europe Hosiery Industry Revenue (Million), by Distribution Channel 2025 & 2033
- Figure 28: Europe Hosiery Industry Volume (K Units), by Distribution Channel 2025 & 2033
- Figure 29: Europe Hosiery Industry Revenue Share (%), by Distribution Channel 2025 & 2033
- Figure 30: Europe Hosiery Industry Volume Share (%), by Distribution Channel 2025 & 2033
- Figure 31: Europe Hosiery Industry Revenue (Million), by Country 2025 & 2033
- Figure 32: Europe Hosiery Industry Volume (K Units), by Country 2025 & 2033
- Figure 33: Europe Hosiery Industry Revenue Share (%), by Country 2025 & 2033
- Figure 34: Europe Hosiery Industry Volume Share (%), by Country 2025 & 2033
- Figure 35: Asia Pacific Hosiery Industry Revenue (Million), by Product Type 2025 & 2033
- Figure 36: Asia Pacific Hosiery Industry Volume (K Units), by Product Type 2025 & 2033
- Figure 37: Asia Pacific Hosiery Industry Revenue Share (%), by Product Type 2025 & 2033
- Figure 38: Asia Pacific Hosiery Industry Volume Share (%), by Product Type 2025 & 2033
- Figure 39: Asia Pacific Hosiery Industry Revenue (Million), by End-User 2025 & 2033
- Figure 40: Asia Pacific Hosiery Industry Volume (K Units), by End-User 2025 & 2033
- Figure 41: Asia Pacific Hosiery Industry Revenue Share (%), by End-User 2025 & 2033
- Figure 42: Asia Pacific Hosiery Industry Volume Share (%), by End-User 2025 & 2033
- Figure 43: Asia Pacific Hosiery Industry Revenue (Million), by Distribution Channel 2025 & 2033
- Figure 44: Asia Pacific Hosiery Industry Volume (K Units), by Distribution Channel 2025 & 2033
- Figure 45: Asia Pacific Hosiery Industry Revenue Share (%), by Distribution Channel 2025 & 2033
- Figure 46: Asia Pacific Hosiery Industry Volume Share (%), by Distribution Channel 2025 & 2033
- Figure 47: Asia Pacific Hosiery Industry Revenue (Million), by Country 2025 & 2033
- Figure 48: Asia Pacific Hosiery Industry Volume (K Units), by Country 2025 & 2033
- Figure 49: Asia Pacific Hosiery Industry Revenue Share (%), by Country 2025 & 2033
- Figure 50: Asia Pacific Hosiery Industry Volume Share (%), by Country 2025 & 2033
- Figure 51: South America Hosiery Industry Revenue (Million), by Product Type 2025 & 2033
- Figure 52: South America Hosiery Industry Volume (K Units), by Product Type 2025 & 2033
- Figure 53: South America Hosiery Industry Revenue Share (%), by Product Type 2025 & 2033
- Figure 54: South America Hosiery Industry Volume Share (%), by Product Type 2025 & 2033
- Figure 55: South America Hosiery Industry Revenue (Million), by End-User 2025 & 2033
- Figure 56: South America Hosiery Industry Volume (K Units), by End-User 2025 & 2033
- Figure 57: South America Hosiery Industry Revenue Share (%), by End-User 2025 & 2033
- Figure 58: South America Hosiery Industry Volume Share (%), by End-User 2025 & 2033
- Figure 59: South America Hosiery Industry Revenue (Million), by Distribution Channel 2025 & 2033
- Figure 60: South America Hosiery Industry Volume (K Units), by Distribution Channel 2025 & 2033
- Figure 61: South America Hosiery Industry Revenue Share (%), by Distribution Channel 2025 & 2033
- Figure 62: South America Hosiery Industry Volume Share (%), by Distribution Channel 2025 & 2033
- Figure 63: South America Hosiery Industry Revenue (Million), by Country 2025 & 2033
- Figure 64: South America Hosiery Industry Volume (K Units), by Country 2025 & 2033
- Figure 65: South America Hosiery Industry Revenue Share (%), by Country 2025 & 2033
- Figure 66: South America Hosiery Industry Volume Share (%), by Country 2025 & 2033
- Figure 67: Middle East and Africa Hosiery Industry Revenue (Million), by Product Type 2025 & 2033
- Figure 68: Middle East and Africa Hosiery Industry Volume (K Units), by Product Type 2025 & 2033
- Figure 69: Middle East and Africa Hosiery Industry Revenue Share (%), by Product Type 2025 & 2033
- Figure 70: Middle East and Africa Hosiery Industry Volume Share (%), by Product Type 2025 & 2033
- Figure 71: Middle East and Africa Hosiery Industry Revenue (Million), by End-User 2025 & 2033
- Figure 72: Middle East and Africa Hosiery Industry Volume (K Units), by End-User 2025 & 2033
- Figure 73: Middle East and Africa Hosiery Industry Revenue Share (%), by End-User 2025 & 2033
- Figure 74: Middle East and Africa Hosiery Industry Volume Share (%), by End-User 2025 & 2033
- Figure 75: Middle East and Africa Hosiery Industry Revenue (Million), by Distribution Channel 2025 & 2033
- Figure 76: Middle East and Africa Hosiery Industry Volume (K Units), by Distribution Channel 2025 & 2033
- Figure 77: Middle East and Africa Hosiery Industry Revenue Share (%), by Distribution Channel 2025 & 2033
- Figure 78: Middle East and Africa Hosiery Industry Volume Share (%), by Distribution Channel 2025 & 2033
- Figure 79: Middle East and Africa Hosiery Industry Revenue (Million), by Country 2025 & 2033
- Figure 80: Middle East and Africa Hosiery Industry Volume (K Units), by Country 2025 & 2033
- Figure 81: Middle East and Africa Hosiery Industry Revenue Share (%), by Country 2025 & 2033
- Figure 82: Middle East and Africa Hosiery Industry Volume Share (%), by Country 2025 & 2033
List of Tables
- Table 1: Global Hosiery Industry Revenue Million Forecast, by Product Type 2020 & 2033
- Table 2: Global Hosiery Industry Volume K Units Forecast, by Product Type 2020 & 2033
- Table 3: Global Hosiery Industry Revenue Million Forecast, by End-User 2020 & 2033
- Table 4: Global Hosiery Industry Volume K Units Forecast, by End-User 2020 & 2033
- Table 5: Global Hosiery Industry Revenue Million Forecast, by Distribution Channel 2020 & 2033
- Table 6: Global Hosiery Industry Volume K Units Forecast, by Distribution Channel 2020 & 2033
- Table 7: Global Hosiery Industry Revenue Million Forecast, by Region 2020 & 2033
- Table 8: Global Hosiery Industry Volume K Units Forecast, by Region 2020 & 2033
- Table 9: Global Hosiery Industry Revenue Million Forecast, by Product Type 2020 & 2033
- Table 10: Global Hosiery Industry Volume K Units Forecast, by Product Type 2020 & 2033
- Table 11: Global Hosiery Industry Revenue Million Forecast, by End-User 2020 & 2033
- Table 12: Global Hosiery Industry Volume K Units Forecast, by End-User 2020 & 2033
- Table 13: Global Hosiery Industry Revenue Million Forecast, by Distribution Channel 2020 & 2033
- Table 14: Global Hosiery Industry Volume K Units Forecast, by Distribution Channel 2020 & 2033
- Table 15: Global Hosiery Industry Revenue Million Forecast, by Country 2020 & 2033
- Table 16: Global Hosiery Industry Volume K Units Forecast, by Country 2020 & 2033
- Table 17: United States Hosiery Industry Revenue (Million) Forecast, by Application 2020 & 2033
- Table 18: United States Hosiery Industry Volume (K Units) Forecast, by Application 2020 & 2033
- Table 19: Canada Hosiery Industry Revenue (Million) Forecast, by Application 2020 & 2033
- Table 20: Canada Hosiery Industry Volume (K Units) Forecast, by Application 2020 & 2033
- Table 21: Mexico Hosiery Industry Revenue (Million) Forecast, by Application 2020 & 2033
- Table 22: Mexico Hosiery Industry Volume (K Units) Forecast, by Application 2020 & 2033
- Table 23: Rest of North America Hosiery Industry Revenue (Million) Forecast, by Application 2020 & 2033
- Table 24: Rest of North America Hosiery Industry Volume (K Units) Forecast, by Application 2020 & 2033
- Table 25: Global Hosiery Industry Revenue Million Forecast, by Product Type 2020 & 2033
- Table 26: Global Hosiery Industry Volume K Units Forecast, by Product Type 2020 & 2033
- Table 27: Global Hosiery Industry Revenue Million Forecast, by End-User 2020 & 2033
- Table 28: Global Hosiery Industry Volume K Units Forecast, by End-User 2020 & 2033
- Table 29: Global Hosiery Industry Revenue Million Forecast, by Distribution Channel 2020 & 2033
- Table 30: Global Hosiery Industry Volume K Units Forecast, by Distribution Channel 2020 & 2033
- Table 31: Global Hosiery Industry Revenue Million Forecast, by Country 2020 & 2033
- Table 32: Global Hosiery Industry Volume K Units Forecast, by Country 2020 & 2033
- Table 33: Spain Hosiery Industry Revenue (Million) Forecast, by Application 2020 & 2033
- Table 34: Spain Hosiery Industry Volume (K Units) Forecast, by Application 2020 & 2033
- Table 35: United Kingdom Hosiery Industry Revenue (Million) Forecast, by Application 2020 & 2033
- Table 36: United Kingdom Hosiery Industry Volume (K Units) Forecast, by Application 2020 & 2033
- Table 37: Germany Hosiery Industry Revenue (Million) Forecast, by Application 2020 & 2033
- Table 38: Germany Hosiery Industry Volume (K Units) Forecast, by Application 2020 & 2033
- Table 39: France Hosiery Industry Revenue (Million) Forecast, by Application 2020 & 2033
- Table 40: France Hosiery Industry Volume (K Units) Forecast, by Application 2020 & 2033
- Table 41: Italy Hosiery Industry Revenue (Million) Forecast, by Application 2020 & 2033
- Table 42: Italy Hosiery Industry Volume (K Units) Forecast, by Application 2020 & 2033
- Table 43: Russia Hosiery Industry Revenue (Million) Forecast, by Application 2020 & 2033
- Table 44: Russia Hosiery Industry Volume (K Units) Forecast, by Application 2020 & 2033
- Table 45: Rest of Europe Hosiery Industry Revenue (Million) Forecast, by Application 2020 & 2033
- Table 46: Rest of Europe Hosiery Industry Volume (K Units) Forecast, by Application 2020 & 2033
- Table 47: Global Hosiery Industry Revenue Million Forecast, by Product Type 2020 & 2033
- Table 48: Global Hosiery Industry Volume K Units Forecast, by Product Type 2020 & 2033
- Table 49: Global Hosiery Industry Revenue Million Forecast, by End-User 2020 & 2033
- Table 50: Global Hosiery Industry Volume K Units Forecast, by End-User 2020 & 2033
- Table 51: Global Hosiery Industry Revenue Million Forecast, by Distribution Channel 2020 & 2033
- Table 52: Global Hosiery Industry Volume K Units Forecast, by Distribution Channel 2020 & 2033
- Table 53: Global Hosiery Industry Revenue Million Forecast, by Country 2020 & 2033
- Table 54: Global Hosiery Industry Volume K Units Forecast, by Country 2020 & 2033
- Table 55: China Hosiery Industry Revenue (Million) Forecast, by Application 2020 & 2033
- Table 56: China Hosiery Industry Volume (K Units) Forecast, by Application 2020 & 2033
- Table 57: Japan Hosiery Industry Revenue (Million) Forecast, by Application 2020 & 2033
- Table 58: Japan Hosiery Industry Volume (K Units) Forecast, by Application 2020 & 2033
- Table 59: India Hosiery Industry Revenue (Million) Forecast, by Application 2020 & 2033
- Table 60: India Hosiery Industry Volume (K Units) Forecast, by Application 2020 & 2033
- Table 61: Australia Hosiery Industry Revenue (Million) Forecast, by Application 2020 & 2033
- Table 62: Australia Hosiery Industry Volume (K Units) Forecast, by Application 2020 & 2033
- Table 63: Rest of Asia Pacific Hosiery Industry Revenue (Million) Forecast, by Application 2020 & 2033
- Table 64: Rest of Asia Pacific Hosiery Industry Volume (K Units) Forecast, by Application 2020 & 2033
- Table 65: Global Hosiery Industry Revenue Million Forecast, by Product Type 2020 & 2033
- Table 66: Global Hosiery Industry Volume K Units Forecast, by Product Type 2020 & 2033
- Table 67: Global Hosiery Industry Revenue Million Forecast, by End-User 2020 & 2033
- Table 68: Global Hosiery Industry Volume K Units Forecast, by End-User 2020 & 2033
- Table 69: Global Hosiery Industry Revenue Million Forecast, by Distribution Channel 2020 & 2033
- Table 70: Global Hosiery Industry Volume K Units Forecast, by Distribution Channel 2020 & 2033
- Table 71: Global Hosiery Industry Revenue Million Forecast, by Country 2020 & 2033
- Table 72: Global Hosiery Industry Volume K Units Forecast, by Country 2020 & 2033
- Table 73: Brazil Hosiery Industry Revenue (Million) Forecast, by Application 2020 & 2033
- Table 74: Brazil Hosiery Industry Volume (K Units) Forecast, by Application 2020 & 2033
- Table 75: Argentina Hosiery Industry Revenue (Million) Forecast, by Application 2020 & 2033
- Table 76: Argentina Hosiery Industry Volume (K Units) Forecast, by Application 2020 & 2033
- Table 77: Rest of South America Hosiery Industry Revenue (Million) Forecast, by Application 2020 & 2033
- Table 78: Rest of South America Hosiery Industry Volume (K Units) Forecast, by Application 2020 & 2033
- Table 79: Global Hosiery Industry Revenue Million Forecast, by Product Type 2020 & 2033
- Table 80: Global Hosiery Industry Volume K Units Forecast, by Product Type 2020 & 2033
- Table 81: Global Hosiery Industry Revenue Million Forecast, by End-User 2020 & 2033
- Table 82: Global Hosiery Industry Volume K Units Forecast, by End-User 2020 & 2033
- Table 83: Global Hosiery Industry Revenue Million Forecast, by Distribution Channel 2020 & 2033
- Table 84: Global Hosiery Industry Volume K Units Forecast, by Distribution Channel 2020 & 2033
- Table 85: Global Hosiery Industry Revenue Million Forecast, by Country 2020 & 2033
- Table 86: Global Hosiery Industry Volume K Units Forecast, by Country 2020 & 2033
- Table 87: South Africa Hosiery Industry Revenue (Million) Forecast, by Application 2020 & 2033
- Table 88: South Africa Hosiery Industry Volume (K Units) Forecast, by Application 2020 & 2033
- Table 89: Saudi Arabia Hosiery Industry Revenue (Million) Forecast, by Application 2020 & 2033
- Table 90: Saudi Arabia Hosiery Industry Volume (K Units) Forecast, by Application 2020 & 2033
- Table 91: Rest of Middle East and Africa Hosiery Industry Revenue (Million) Forecast, by Application 2020 & 2033
- Table 92: Rest of Middle East and Africa Hosiery Industry Volume (K Units) Forecast, by Application 2020 & 2033
Frequently Asked Questions
1. What is the projected Compound Annual Growth Rate (CAGR) of the Hosiery Industry?
The projected CAGR is approximately 4.86%.
2. Which companies are prominent players in the Hosiery Industry?
Key companies in the market include Skims*List Not Exhaustive, Hanesbrands Inc, Iconix Brand Group Inc, Jockey International Inc, Falke KGaA, Gilfin S P A (Golden Lady Company S P A), Lanvin Group (Wolford AG), Spanx Inc, Heist Studios, CSP International Fashion Group S P A, Carolina Hosiery Mill Inc (Carolina Ultimate Real Tree), G-III Apparel Group (Donna Karan International).
3. What are the main segments of the Hosiery Industry?
The market segments include Product Type, End-User, Distribution Channel.
4. Can you provide details about the market size?
The market size is estimated to be USD 59.72 Million as of 2022.
5. What are some drivers contributing to market growth?
Fast Fashion Trend; Inflating Income Level of Individuals.
6. What are the notable trends driving market growth?
Innovative Garments Dominates the Market.
7. Are there any restraints impacting market growth?
The Presence Of Counterfeit Products.
8. Can you provide examples of recent developments in the market?
In May 2022, Falke Introduced New Pressure-Free Running Socks. Falke's new Pressure-Free sock incorporates a unique design feature to reduce the potential hotspot across the bridge of the foot. Falke has inserted a striated pad of channels on top of the foot that may move dynamically in response to foot movements. This helps to spread movement pressure and relieve pressure buildup in this area.
9. What pricing options are available for accessing the report?
Pricing options include single-user, multi-user, and enterprise licenses priced at USD 4750, USD 5250, and USD 8750 respectively.
10. Is the market size provided in terms of value or volume?
The market size is provided in terms of value, measured in Million and volume, measured in K Units.
11. Are there any specific market keywords associated with the report?
Yes, the market keyword associated with the report is "Hosiery Industry," which aids in identifying and referencing the specific market segment covered.
12. How do I determine which pricing option suits my needs best?
The pricing options vary based on user requirements and access needs. Individual users may opt for single-user licenses, while businesses requiring broader access may choose multi-user or enterprise licenses for cost-effective access to the report.
13. Are there any additional resources or data provided in the Hosiery Industry report?
While the report offers comprehensive insights, it's advisable to review the specific contents or supplementary materials provided to ascertain if additional resources or data are available.
14. How can I stay updated on further developments or reports in the Hosiery Industry?
To stay informed about further developments, trends, and reports in the Hosiery Industry, consider subscribing to industry newsletters, following relevant companies and organizations, or regularly checking reputable industry news sources and publications.
Methodology
Step 1 - Identification of Relevant Samples Size from Population Database


Step 2 - Approaches for Defining Global Market Size (Value, Volume* & Price*)

Note*: In applicable scenarios
Step 3 - Data Sources
Primary Research
- Web Analytics
- Survey Reports
- Research Institute
- Latest Research Reports
- Opinion Leaders
Secondary Research
- Annual Reports
- White Paper
- Latest Press Release
- Industry Association
- Paid Database
- Investor Presentations

Step 4 - Data Triangulation
Involves using different sources of information in order to increase the validity of a study
These sources are likely to be stakeholders in a program - participants, other researchers, program staff, other community members, and so on.
Then we put all data in single framework & apply various statistical tools to find out the dynamic on the market.
During the analysis stage, feedback from the stakeholder groups would be compared to determine areas of agreement as well as areas of divergence