Key Insights
The Netherlands hospitality industry, valued at €3.95 billion in 2025, is projected for significant expansion with a Compound Annual Growth Rate (CAGR) of 3.5% through 2033. This growth is propelled by the Netherlands' robust tourism sector, characterized by rich cultural attractions, popular urban destinations such as Amsterdam, and its strategic European location. Increased business travel within the EU and a growing preference for sustainable and experiential tourism are further stimulating demand across hotel segments. The market is segmented, featuring established chains like Hilton and InterContinental alongside independent hotels, serving a diverse clientele from budget-conscious travelers to luxury seekers. Key market players, including Bastion Hotel Group, Louvre Hotels Group, and AccorHotels, indicate a moderately concentrated market, with loyalty programs enhancing customer retention and revenue. Potential economic fluctuations and global uncertainties may present challenges, while the continued rise of online booking platforms and intensified competition offer both opportunities and obstacles. Future success hinges on adopting sustainable practices and delivering personalized guest experiences.
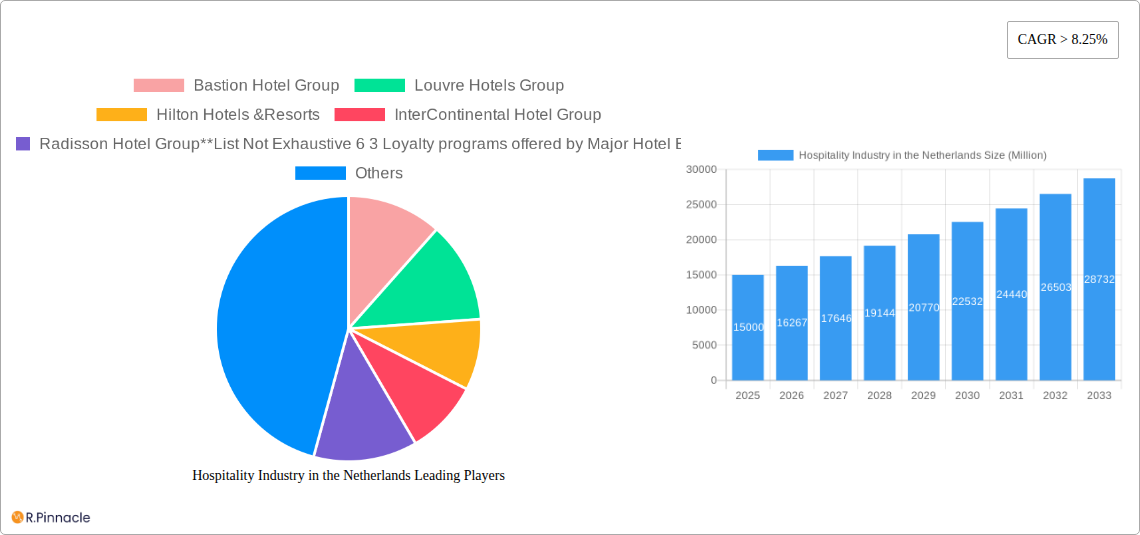
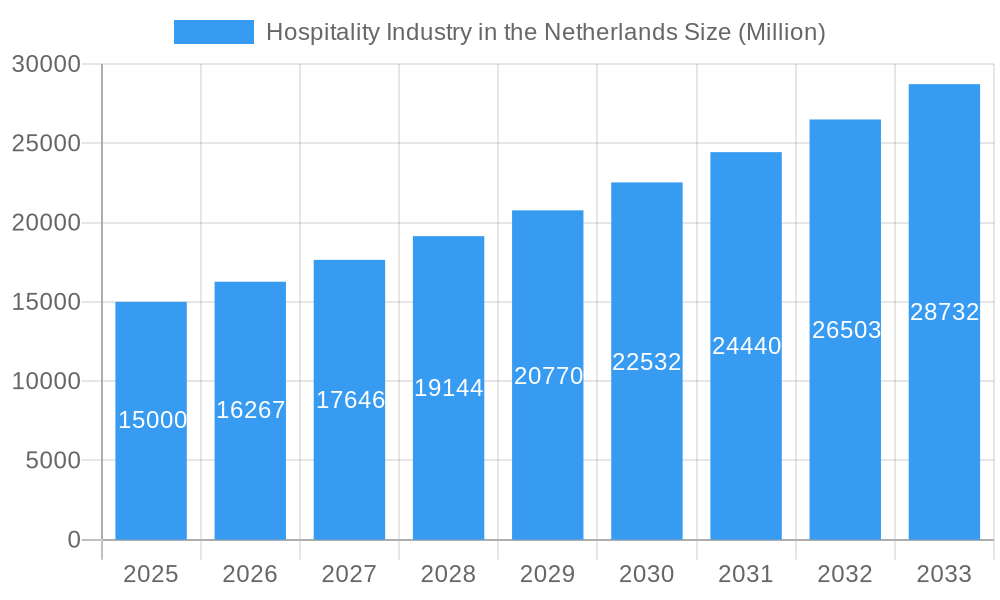
Hospitality Industry in the Netherlands Market Size (In Billion)
The competitive landscape features a dynamic mix of international hotel chains and local groups, including prominent brands such as Marriott International, NH Hotels, and Fletcher Hotels, underscoring intense market competition. While precise market share distribution necessitates further analysis, diverse segmentations—encompassing serviced apartments, budget and economy hotels, mid-scale, and luxury hotels—cater to a broad range of consumer preferences and income levels. Understanding the competitive strategies, including pricing, branding, and service offerings of key players, is essential for grasping overall market dynamics. Adapting to evolving consumer behavior, technological advancements in revenue management and online booking, and changing post-pandemic travel patterns, alongside a focus on health and safety, will be critical for future growth in this evolving sector.
Hospitality Industry in the Netherlands Company Market Share
Hospitality Industry in the Netherlands Market Structure & Innovation Trends
This comprehensive report analyzes the Netherlands' hospitality industry, covering the period 2019-2033, with a focus on 2025. We delve into the market structure, examining market concentration, identifying key players like Bastion Hotel Group, Louvre Hotels Group, Hilton Hotels & Resorts, InterContinental Hotel Group, Radisson Hotel Group, Van der Valk, Marriott International, AccorHotels, NH Hotels, and Fletcher Hotels (list not exhaustive), and analyzing their market share. The report also explores innovation drivers, including the increasing adoption of augmented reality (AR) and virtual reality (VR) technologies as seen in recent initiatives by InterContinental Hotel Group and Fletcher Hotels. Regulatory frameworks, product substitutes (e.g., Airbnb), end-user demographics (e.g., business travelers vs. leisure travelers), and M&A activities, including deal values (xx Million), are also examined. The impact of these factors on the overall market size (xx Million) and growth are analyzed, providing valuable insights for industry professionals.
- Market Concentration: The Netherlands hospitality market exhibits a [Level of Concentration - e.g., moderately concentrated] structure with [Percentage]% market share held by the top five players in 2025.
- M&A Activity: A total of xx M&A deals were recorded between 2019 and 2024, with an aggregate value of xx Million.
- Innovation Drivers: Technological advancements, shifting consumer preferences, and regulatory changes are key innovation drivers.
Hospitality Industry in the Netherlands Market Dynamics & Trends
This section provides a detailed analysis of the dynamic Netherlands hospitality market, projecting growth and trends until 2033. We explore market growth drivers, such as increasing tourism and business travel, and technological disruptions, including the rise of online booking platforms and the integration of smart technologies within hotels. We examine evolving consumer preferences, highlighting the demand for unique experiences and sustainable practices. The competitive landscape is thoroughly assessed, analyzing the strategies employed by major players to maintain market share and attract customers. The report projects a Compound Annual Growth Rate (CAGR) of xx% for the forecast period (2025-2033) and estimates market penetration for key segments. The impact of external factors such as economic fluctuations and geopolitical events on market growth is also considered.
Dominant Regions & Segments in Hospitality Industry in the Netherlands
This report identifies the dominant regions and segments within the Netherlands hospitality market. We analyze performance across various segments: Chain Hotels, Independent Hotels, Service Apartments, Budget and Economy Hotels, Mid and Upper-midscale Hotels, and Luxury Hotels. The analysis reveals the leading segment(s) and explores the underlying reasons for their dominance.
- Key Drivers of Dominance:
- Economic Policies: [Explain impact of specific economic policies, e.g., tourism incentives]
- Infrastructure: [Explain impact of infrastructure, e.g., airport connectivity, transportation networks]
- Consumer Preferences: [Explain trends in consumer preferences influencing segment growth]
[Paragraph detailing dominance analysis, including market share data for each segment and regional variations. For example: "The Mid and Upper-midscale hotel segment shows the highest growth rate, driven by an increasing demand for comfortable and moderately priced accommodations among business and leisure travelers."]
Hospitality Industry in the Netherlands Product Innovations
The Netherlands hospitality industry is witnessing significant product innovation, driven by technological advancements and evolving customer expectations. Hotels are increasingly integrating technology to enhance guest experiences, such as offering mobile check-in/check-out, personalized services through AI-powered systems, and immersive virtual experiences, as exemplified by Fletcher Hotel's interactive treasure hunt. These innovations are creating competitive advantages, attracting a wider customer base and improving operational efficiency. The market is also witnessing an increasing focus on sustainability and eco-friendly practices, aligning with evolving consumer preferences.
Report Scope & Segmentation Analysis
This report provides a comprehensive analysis of the Netherlands hospitality market, segmented by type (Chain Hotels, Independent Hotels) and by segment (Service Apartments, Budget and Economy Hotels, Mid and Upper-midscale Hotels, Luxury Hotels). Each segment's growth projections, market size (in Millions), and competitive dynamics are thoroughly analyzed.
- Chain Hotels: [Growth projection, market size, competitive landscape description]
- Independent Hotels: [Growth projection, market size, competitive landscape description]
- Service Apartments: [Growth projection, market size, competitive landscape description]
- Budget and Economy Hotels: [Growth projection, market size, competitive landscape description]
- Mid and Upper-midscale Hotels: [Growth projection, market size, competitive landscape description]
- Luxury Hotels: [Growth projection, market size, competitive landscape description]
Key Drivers of Hospitality Industry in the Netherlands Growth
The growth of the Netherlands hospitality industry is fueled by several key factors. Strong economic performance attracts both business and leisure travelers. Government initiatives promoting tourism further stimulate growth. Technological advancements, such as online booking platforms and smart hotel technologies, enhance efficiency and the guest experience. Furthermore, a rising focus on sustainability and eco-friendly practices is attracting environmentally conscious tourists.
Challenges in the Hospitality Industry in the Netherlands Sector
The Netherlands hospitality sector faces challenges including rising operational costs, particularly labor costs and energy prices, impacting profitability. Intense competition from online travel agencies and alternative accommodations like Airbnb exerts pressure on pricing and market share. Furthermore, regulatory changes and potential economic downturns can significantly impact industry performance.
Emerging Opportunities in Hospitality Industry in the Netherlands
The Netherlands hospitality industry presents several emerging opportunities. The growing demand for unique and personalized experiences opens avenues for specialized services and themed accommodations. The increasing adoption of technology creates opportunities for innovative solutions enhancing guest experiences and operational efficiency. Finally, sustainable tourism initiatives and eco-friendly practices present a significant opportunity to attract environmentally conscious travelers.
Leading Players in the Hospitality Industry in the Netherlands Market
- Bastion Hotel Group
- Louvre Hotels Group
- Hilton Hotels & Resorts
- InterContinental Hotel Group
- Radisson Hotel Group
- Van der Valk
- Marriott International
- AccorHotels
- NH Hotels
- Fletcher Hotel
Loyalty Programs: [List 6 Loyalty programs offered by major hotel brands operating in the Netherlands. If unavailable, replace with "Data Unavailable"]
Key Developments in Hospitality Industry in the Netherlands Industry
- May 2022: Fletcher Hotel launched an immersive virtual treasure hunt, enhancing guest engagement.
- January 2023: InterContinental Hotel Group Netherlands introduced an Augmented Reality (AR) hotel art tour, providing a unique visitor experience.
Future Outlook for Hospitality Industry in the Netherlands Market
The future of the Netherlands hospitality industry appears promising. Continued growth in tourism, coupled with technological advancements and evolving consumer preferences, will drive market expansion. Strategic investments in sustainable practices and personalized guest experiences will be crucial for success. The industry is poised for sustained growth, offering significant opportunities for established players and new entrants alike.
Hospitality Industry in the Netherlands Segmentation
-
1. Type
- 1.1. Chain Hotels
- 1.2. Independent Hotels
-
2. Segment
- 2.1. Service Apartments
- 2.2. Budget and Economy Hotels
- 2.3. Mid and Upper mid scale Hotels
- 2.4. Luxury Hotels
Hospitality Industry in the Netherlands Segmentation By Geography
-
1. North America
- 1.1. United States
- 1.2. Canada
- 1.3. Mexico
-
2. South America
- 2.1. Brazil
- 2.2. Argentina
- 2.3. Rest of South America
-
3. Europe
- 3.1. United Kingdom
- 3.2. Germany
- 3.3. France
- 3.4. Italy
- 3.5. Spain
- 3.6. Russia
- 3.7. Benelux
- 3.8. Nordics
- 3.9. Rest of Europe
-
4. Middle East & Africa
- 4.1. Turkey
- 4.2. Israel
- 4.3. GCC
- 4.4. North Africa
- 4.5. South Africa
- 4.6. Rest of Middle East & Africa
-
5. Asia Pacific
- 5.1. China
- 5.2. India
- 5.3. Japan
- 5.4. South Korea
- 5.5. ASEAN
- 5.6. Oceania
- 5.7. Rest of Asia Pacific
Hospitality Industry in the Netherlands Regional Market Share
Geographic Coverage of Hospitality Industry in the Netherlands
Hospitality Industry in the Netherlands REPORT HIGHLIGHTS
| Aspects | Details |
|---|---|
| Study Period | 2020-2034 |
| Base Year | 2025 |
| Estimated Year | 2026 |
| Forecast Period | 2026-2034 |
| Historical Period | 2020-2025 |
| Growth Rate | CAGR of 3.5% from 2020-2034 |
| Segmentation |
|
Table of Contents
- 1. Introduction
- 1.1. Research Scope
- 1.2. Market Segmentation
- 1.3. Research Objective
- 1.4. Definitions and Assumptions
- 2. Executive Summary
- 2.1. Market Snapshot
- 3. Market Dynamics
- 3.1. Market Drivers
- 3.2. Market Restrains
- 3.3. Market Trends
- 3.4. Market Opportunities
- 4. Market Factor Analysis
- 4.1. Porters Five Forces
- 4.1.1. Bargaining Power of Suppliers
- 4.1.2. Bargaining Power of Buyers
- 4.1.3. Threat of New Entrants
- 4.1.4. Threat of Substitutes
- 4.1.5. Competitive Rivalry
- 4.2. PESTEL analysis
- 4.3. BCG Analysis
- 4.3.1. Stars (High Growth, High Market Share)
- 4.3.2. Cash Cows (Low Growth, High Market Share)
- 4.3.3. Question Mark (High Growth, Low Market Share)
- 4.3.4. Dogs (Low Growth, Low Market Share)
- 4.4. Ansoff Matrix Analysis
- 4.5. Supply Chain Analysis
- 4.6. Regulatory Landscape
- 4.7. Current Market Potential and Opportunity Assessment (TAM–SAM–SOM Framework)
- 4.8. PRI Analyst Note
- 4.1. Porters Five Forces
- 5. Market Analysis, Insights and Forecast 2021-2033
- 5.1. Market Analysis, Insights and Forecast - by Type
- 5.1.1. Chain Hotels
- 5.1.2. Independent Hotels
- 5.2. Market Analysis, Insights and Forecast - by Segment
- 5.2.1. Service Apartments
- 5.2.2. Budget and Economy Hotels
- 5.2.3. Mid and Upper mid scale Hotels
- 5.2.4. Luxury Hotels
- 5.3. Market Analysis, Insights and Forecast - by Region
- 5.3.1. North America
- 5.3.2. South America
- 5.3.3. Europe
- 5.3.4. Middle East & Africa
- 5.3.5. Asia Pacific
- 5.1. Market Analysis, Insights and Forecast - by Type
- 6. Global Hospitality Industry in the Netherlands Analysis, Insights and Forecast, 2021-2033
- 6.1. Market Analysis, Insights and Forecast - by Type
- 6.1.1. Chain Hotels
- 6.1.2. Independent Hotels
- 6.2. Market Analysis, Insights and Forecast - by Segment
- 6.2.1. Service Apartments
- 6.2.2. Budget and Economy Hotels
- 6.2.3. Mid and Upper mid scale Hotels
- 6.2.4. Luxury Hotels
- 6.1. Market Analysis, Insights and Forecast - by Type
- 7. North America Hospitality Industry in the Netherlands Analysis, Insights and Forecast, 2020-2032
- 7.1. Market Analysis, Insights and Forecast - by Type
- 7.1.1. Chain Hotels
- 7.1.2. Independent Hotels
- 7.2. Market Analysis, Insights and Forecast - by Segment
- 7.2.1. Service Apartments
- 7.2.2. Budget and Economy Hotels
- 7.2.3. Mid and Upper mid scale Hotels
- 7.2.4. Luxury Hotels
- 7.1. Market Analysis, Insights and Forecast - by Type
- 8. South America Hospitality Industry in the Netherlands Analysis, Insights and Forecast, 2020-2032
- 8.1. Market Analysis, Insights and Forecast - by Type
- 8.1.1. Chain Hotels
- 8.1.2. Independent Hotels
- 8.2. Market Analysis, Insights and Forecast - by Segment
- 8.2.1. Service Apartments
- 8.2.2. Budget and Economy Hotels
- 8.2.3. Mid and Upper mid scale Hotels
- 8.2.4. Luxury Hotels
- 8.1. Market Analysis, Insights and Forecast - by Type
- 9. Europe Hospitality Industry in the Netherlands Analysis, Insights and Forecast, 2020-2032
- 9.1. Market Analysis, Insights and Forecast - by Type
- 9.1.1. Chain Hotels
- 9.1.2. Independent Hotels
- 9.2. Market Analysis, Insights and Forecast - by Segment
- 9.2.1. Service Apartments
- 9.2.2. Budget and Economy Hotels
- 9.2.3. Mid and Upper mid scale Hotels
- 9.2.4. Luxury Hotels
- 9.1. Market Analysis, Insights and Forecast - by Type
- 10. Middle East & Africa Hospitality Industry in the Netherlands Analysis, Insights and Forecast, 2020-2032
- 10.1. Market Analysis, Insights and Forecast - by Type
- 10.1.1. Chain Hotels
- 10.1.2. Independent Hotels
- 10.2. Market Analysis, Insights and Forecast - by Segment
- 10.2.1. Service Apartments
- 10.2.2. Budget and Economy Hotels
- 10.2.3. Mid and Upper mid scale Hotels
- 10.2.4. Luxury Hotels
- 10.1. Market Analysis, Insights and Forecast - by Type
- 11. Asia Pacific Hospitality Industry in the Netherlands Analysis, Insights and Forecast, 2020-2032
- 11.1. Market Analysis, Insights and Forecast - by Type
- 11.1.1. Chain Hotels
- 11.1.2. Independent Hotels
- 11.2. Market Analysis, Insights and Forecast - by Segment
- 11.2.1. Service Apartments
- 11.2.2. Budget and Economy Hotels
- 11.2.3. Mid and Upper mid scale Hotels
- 11.2.4. Luxury Hotels
- 11.1. Market Analysis, Insights and Forecast - by Type
- 12. Competitive Analysis
- 12.1. Company Profiles
- 12.1.1 Bastion Hotel Group
- 12.1.1.1. Company Overview
- 12.1.1.2. Products
- 12.1.1.3. Company Financials
- 12.1.1.4. SWOT Analysis
- 12.1.2 Louvre Hotels Group
- 12.1.2.1. Company Overview
- 12.1.2.2. Products
- 12.1.2.3. Company Financials
- 12.1.2.4. SWOT Analysis
- 12.1.3 Hilton Hotels &Resorts
- 12.1.3.1. Company Overview
- 12.1.3.2. Products
- 12.1.3.3. Company Financials
- 12.1.3.4. SWOT Analysis
- 12.1.4 InterContinental Hotel Group
- 12.1.4.1. Company Overview
- 12.1.4.2. Products
- 12.1.4.3. Company Financials
- 12.1.4.4. SWOT Analysis
- 12.1.5 Radisson Hotel Group**List Not Exhaustive 6 3 Loyalty programs offered by Major Hotel Brand
- 12.1.5.1. Company Overview
- 12.1.5.2. Products
- 12.1.5.3. Company Financials
- 12.1.5.4. SWOT Analysis
- 12.1.6 6 COMPETITVE INTELLIGENCE6 1 Market Concentration6 2 Company profiles
- 12.1.6.1. Company Overview
- 12.1.6.2. Products
- 12.1.6.3. Company Financials
- 12.1.6.4. SWOT Analysis
- 12.1.7 Van der Valk
- 12.1.7.1. Company Overview
- 12.1.7.2. Products
- 12.1.7.3. Company Financials
- 12.1.7.4. SWOT Analysis
- 12.1.8 Marriott International
- 12.1.8.1. Company Overview
- 12.1.8.2. Products
- 12.1.8.3. Company Financials
- 12.1.8.4. SWOT Analysis
- 12.1.9 AccorHotels
- 12.1.9.1. Company Overview
- 12.1.9.2. Products
- 12.1.9.3. Company Financials
- 12.1.9.4. SWOT Analysis
- 12.1.10 NH Hotels
- 12.1.10.1. Company Overview
- 12.1.10.2. Products
- 12.1.10.3. Company Financials
- 12.1.10.4. SWOT Analysis
- 12.1.11 Fletcher Hotel
- 12.1.11.1. Company Overview
- 12.1.11.2. Products
- 12.1.11.3. Company Financials
- 12.1.11.4. SWOT Analysis
- 12.1.1 Bastion Hotel Group
- 12.2. Market Entropy
- 12.2.1 Company's Key Areas Served
- 12.2.2 Recent Developments
- 12.3. Company Market Share Analysis 2025
- 12.3.1 Top 5 Companies Market Share Analysis
- 12.3.2 Top 3 Companies Market Share Analysis
- 12.4. List of Potential Customers
- 13. Research Methodology
List of Figures
- Figure 1: Global Hospitality Industry in the Netherlands Revenue Breakdown (billion, %) by Region 2025 & 2033
- Figure 2: North America Hospitality Industry in the Netherlands Revenue (billion), by Type 2025 & 2033
- Figure 3: North America Hospitality Industry in the Netherlands Revenue Share (%), by Type 2025 & 2033
- Figure 4: North America Hospitality Industry in the Netherlands Revenue (billion), by Segment 2025 & 2033
- Figure 5: North America Hospitality Industry in the Netherlands Revenue Share (%), by Segment 2025 & 2033
- Figure 6: North America Hospitality Industry in the Netherlands Revenue (billion), by Country 2025 & 2033
- Figure 7: North America Hospitality Industry in the Netherlands Revenue Share (%), by Country 2025 & 2033
- Figure 8: South America Hospitality Industry in the Netherlands Revenue (billion), by Type 2025 & 2033
- Figure 9: South America Hospitality Industry in the Netherlands Revenue Share (%), by Type 2025 & 2033
- Figure 10: South America Hospitality Industry in the Netherlands Revenue (billion), by Segment 2025 & 2033
- Figure 11: South America Hospitality Industry in the Netherlands Revenue Share (%), by Segment 2025 & 2033
- Figure 12: South America Hospitality Industry in the Netherlands Revenue (billion), by Country 2025 & 2033
- Figure 13: South America Hospitality Industry in the Netherlands Revenue Share (%), by Country 2025 & 2033
- Figure 14: Europe Hospitality Industry in the Netherlands Revenue (billion), by Type 2025 & 2033
- Figure 15: Europe Hospitality Industry in the Netherlands Revenue Share (%), by Type 2025 & 2033
- Figure 16: Europe Hospitality Industry in the Netherlands Revenue (billion), by Segment 2025 & 2033
- Figure 17: Europe Hospitality Industry in the Netherlands Revenue Share (%), by Segment 2025 & 2033
- Figure 18: Europe Hospitality Industry in the Netherlands Revenue (billion), by Country 2025 & 2033
- Figure 19: Europe Hospitality Industry in the Netherlands Revenue Share (%), by Country 2025 & 2033
- Figure 20: Middle East & Africa Hospitality Industry in the Netherlands Revenue (billion), by Type 2025 & 2033
- Figure 21: Middle East & Africa Hospitality Industry in the Netherlands Revenue Share (%), by Type 2025 & 2033
- Figure 22: Middle East & Africa Hospitality Industry in the Netherlands Revenue (billion), by Segment 2025 & 2033
- Figure 23: Middle East & Africa Hospitality Industry in the Netherlands Revenue Share (%), by Segment 2025 & 2033
- Figure 24: Middle East & Africa Hospitality Industry in the Netherlands Revenue (billion), by Country 2025 & 2033
- Figure 25: Middle East & Africa Hospitality Industry in the Netherlands Revenue Share (%), by Country 2025 & 2033
- Figure 26: Asia Pacific Hospitality Industry in the Netherlands Revenue (billion), by Type 2025 & 2033
- Figure 27: Asia Pacific Hospitality Industry in the Netherlands Revenue Share (%), by Type 2025 & 2033
- Figure 28: Asia Pacific Hospitality Industry in the Netherlands Revenue (billion), by Segment 2025 & 2033
- Figure 29: Asia Pacific Hospitality Industry in the Netherlands Revenue Share (%), by Segment 2025 & 2033
- Figure 30: Asia Pacific Hospitality Industry in the Netherlands Revenue (billion), by Country 2025 & 2033
- Figure 31: Asia Pacific Hospitality Industry in the Netherlands Revenue Share (%), by Country 2025 & 2033
List of Tables
- Table 1: Global Hospitality Industry in the Netherlands Revenue billion Forecast, by Type 2020 & 2033
- Table 2: Global Hospitality Industry in the Netherlands Revenue billion Forecast, by Segment 2020 & 2033
- Table 3: Global Hospitality Industry in the Netherlands Revenue billion Forecast, by Region 2020 & 2033
- Table 4: Global Hospitality Industry in the Netherlands Revenue billion Forecast, by Type 2020 & 2033
- Table 5: Global Hospitality Industry in the Netherlands Revenue billion Forecast, by Segment 2020 & 2033
- Table 6: Global Hospitality Industry in the Netherlands Revenue billion Forecast, by Country 2020 & 2033
- Table 7: United States Hospitality Industry in the Netherlands Revenue (billion) Forecast, by Application 2020 & 2033
- Table 8: Canada Hospitality Industry in the Netherlands Revenue (billion) Forecast, by Application 2020 & 2033
- Table 9: Mexico Hospitality Industry in the Netherlands Revenue (billion) Forecast, by Application 2020 & 2033
- Table 10: Global Hospitality Industry in the Netherlands Revenue billion Forecast, by Type 2020 & 2033
- Table 11: Global Hospitality Industry in the Netherlands Revenue billion Forecast, by Segment 2020 & 2033
- Table 12: Global Hospitality Industry in the Netherlands Revenue billion Forecast, by Country 2020 & 2033
- Table 13: Brazil Hospitality Industry in the Netherlands Revenue (billion) Forecast, by Application 2020 & 2033
- Table 14: Argentina Hospitality Industry in the Netherlands Revenue (billion) Forecast, by Application 2020 & 2033
- Table 15: Rest of South America Hospitality Industry in the Netherlands Revenue (billion) Forecast, by Application 2020 & 2033
- Table 16: Global Hospitality Industry in the Netherlands Revenue billion Forecast, by Type 2020 & 2033
- Table 17: Global Hospitality Industry in the Netherlands Revenue billion Forecast, by Segment 2020 & 2033
- Table 18: Global Hospitality Industry in the Netherlands Revenue billion Forecast, by Country 2020 & 2033
- Table 19: United Kingdom Hospitality Industry in the Netherlands Revenue (billion) Forecast, by Application 2020 & 2033
- Table 20: Germany Hospitality Industry in the Netherlands Revenue (billion) Forecast, by Application 2020 & 2033
- Table 21: France Hospitality Industry in the Netherlands Revenue (billion) Forecast, by Application 2020 & 2033
- Table 22: Italy Hospitality Industry in the Netherlands Revenue (billion) Forecast, by Application 2020 & 2033
- Table 23: Spain Hospitality Industry in the Netherlands Revenue (billion) Forecast, by Application 2020 & 2033
- Table 24: Russia Hospitality Industry in the Netherlands Revenue (billion) Forecast, by Application 2020 & 2033
- Table 25: Benelux Hospitality Industry in the Netherlands Revenue (billion) Forecast, by Application 2020 & 2033
- Table 26: Nordics Hospitality Industry in the Netherlands Revenue (billion) Forecast, by Application 2020 & 2033
- Table 27: Rest of Europe Hospitality Industry in the Netherlands Revenue (billion) Forecast, by Application 2020 & 2033
- Table 28: Global Hospitality Industry in the Netherlands Revenue billion Forecast, by Type 2020 & 2033
- Table 29: Global Hospitality Industry in the Netherlands Revenue billion Forecast, by Segment 2020 & 2033
- Table 30: Global Hospitality Industry in the Netherlands Revenue billion Forecast, by Country 2020 & 2033
- Table 31: Turkey Hospitality Industry in the Netherlands Revenue (billion) Forecast, by Application 2020 & 2033
- Table 32: Israel Hospitality Industry in the Netherlands Revenue (billion) Forecast, by Application 2020 & 2033
- Table 33: GCC Hospitality Industry in the Netherlands Revenue (billion) Forecast, by Application 2020 & 2033
- Table 34: North Africa Hospitality Industry in the Netherlands Revenue (billion) Forecast, by Application 2020 & 2033
- Table 35: South Africa Hospitality Industry in the Netherlands Revenue (billion) Forecast, by Application 2020 & 2033
- Table 36: Rest of Middle East & Africa Hospitality Industry in the Netherlands Revenue (billion) Forecast, by Application 2020 & 2033
- Table 37: Global Hospitality Industry in the Netherlands Revenue billion Forecast, by Type 2020 & 2033
- Table 38: Global Hospitality Industry in the Netherlands Revenue billion Forecast, by Segment 2020 & 2033
- Table 39: Global Hospitality Industry in the Netherlands Revenue billion Forecast, by Country 2020 & 2033
- Table 40: China Hospitality Industry in the Netherlands Revenue (billion) Forecast, by Application 2020 & 2033
- Table 41: India Hospitality Industry in the Netherlands Revenue (billion) Forecast, by Application 2020 & 2033
- Table 42: Japan Hospitality Industry in the Netherlands Revenue (billion) Forecast, by Application 2020 & 2033
- Table 43: South Korea Hospitality Industry in the Netherlands Revenue (billion) Forecast, by Application 2020 & 2033
- Table 44: ASEAN Hospitality Industry in the Netherlands Revenue (billion) Forecast, by Application 2020 & 2033
- Table 45: Oceania Hospitality Industry in the Netherlands Revenue (billion) Forecast, by Application 2020 & 2033
- Table 46: Rest of Asia Pacific Hospitality Industry in the Netherlands Revenue (billion) Forecast, by Application 2020 & 2033
Frequently Asked Questions
1. What is the projected Compound Annual Growth Rate (CAGR) of the Hospitality Industry in the Netherlands?
The projected CAGR is approximately 3.5%.
2. Which companies are prominent players in the Hospitality Industry in the Netherlands?
Key companies in the market include Bastion Hotel Group, Louvre Hotels Group, Hilton Hotels &Resorts, InterContinental Hotel Group, Radisson Hotel Group**List Not Exhaustive 6 3 Loyalty programs offered by Major Hotel Brand, 6 COMPETITVE INTELLIGENCE6 1 Market Concentration6 2 Company profiles, Van der Valk, Marriott International, AccorHotels, NH Hotels, Fletcher Hotel.
3. What are the main segments of the Hospitality Industry in the Netherlands?
The market segments include Type, Segment.
4. Can you provide details about the market size?
The market size is estimated to be USD 3.95 billion as of 2022.
5. What are some drivers contributing to market growth?
4.; Contribution to the Economy to Generate Income for the Nation.
6. What are the notable trends driving market growth?
Tier-II Cities Are Going to Attract More Investors Thus Driving The Industry.
7. Are there any restraints impacting market growth?
4.; Long Hours of Working Pattern.
8. Can you provide examples of recent developments in the market?
January 2023: InterContinental Hotel Group, Netherlands, took the initiative on an Augmented Reality (AR) hotel art tour where visitors can interact virtually with 10 artworks in the hotel's collection, supplemented by computer-generated graphics and sound as well as written or audio narratives about the piece and artist.
9. What pricing options are available for accessing the report?
Pricing options include single-user, multi-user, and enterprise licenses priced at USD 3800, USD 4500, and USD 5800 respectively.
10. Is the market size provided in terms of value or volume?
The market size is provided in terms of value, measured in billion.
11. Are there any specific market keywords associated with the report?
Yes, the market keyword associated with the report is "Hospitality Industry in the Netherlands," which aids in identifying and referencing the specific market segment covered.
12. How do I determine which pricing option suits my needs best?
The pricing options vary based on user requirements and access needs. Individual users may opt for single-user licenses, while businesses requiring broader access may choose multi-user or enterprise licenses for cost-effective access to the report.
13. Are there any additional resources or data provided in the Hospitality Industry in the Netherlands report?
While the report offers comprehensive insights, it's advisable to review the specific contents or supplementary materials provided to ascertain if additional resources or data are available.
14. How can I stay updated on further developments or reports in the Hospitality Industry in the Netherlands?
To stay informed about further developments, trends, and reports in the Hospitality Industry in the Netherlands, consider subscribing to industry newsletters, following relevant companies and organizations, or regularly checking reputable industry news sources and publications.
Methodology
Step 1 - Identification of Relevant Samples Size from Population Database


Step 2 - Approaches for Defining Global Market Size (Value, Volume* & Price*)

Note*: In applicable scenarios
Step 3 - Data Sources
Primary Research
- Web Analytics
- Survey Reports
- Research Institute
- Latest Research Reports
- Opinion Leaders
Secondary Research
- Annual Reports
- White Paper
- Latest Press Release
- Industry Association
- Paid Database
- Investor Presentations

Step 4 - Data Triangulation
Involves using different sources of information in order to increase the validity of a study
These sources are likely to be stakeholders in a program - participants, other researchers, program staff, other community members, and so on.
Then we put all data in single framework & apply various statistical tools to find out the dynamic on the market.
During the analysis stage, feedback from the stakeholder groups would be compared to determine areas of agreement as well as areas of divergence

