


Key Insights for Image Optimization Tool Market
The global Image Optimization Tool Market is poised for robust expansion, reflecting the escalating demand for high-performance digital content across various online platforms. Valued at an estimated $9.02 billion in 2025, this market is projected to experience a compound annual growth rate (CAGR) of 11.28% over the forecast period. This significant growth is primarily propelled by the exponential proliferation of visual content, increasing internet penetration, and the critical need for superior user experience and faster website load times. Image optimization tools play a pivotal role in compressing, resizing, and converting images to optimal formats without compromising visual quality, thereby reducing bandwidth consumption and improving search engine rankings. This directly contributes to enhancing core web vitals and overall search engine optimization (SEO) strategies, which are paramount for digital visibility in the competitive online landscape. Macro tailwinds, including the continued expansion of the E-commerce Platform Market, the pervasive shift towards mobile-first browsing experiences, and the strategic importance of high-speed Content Delivery Network Market infrastructures, are further catalyzing market progression.
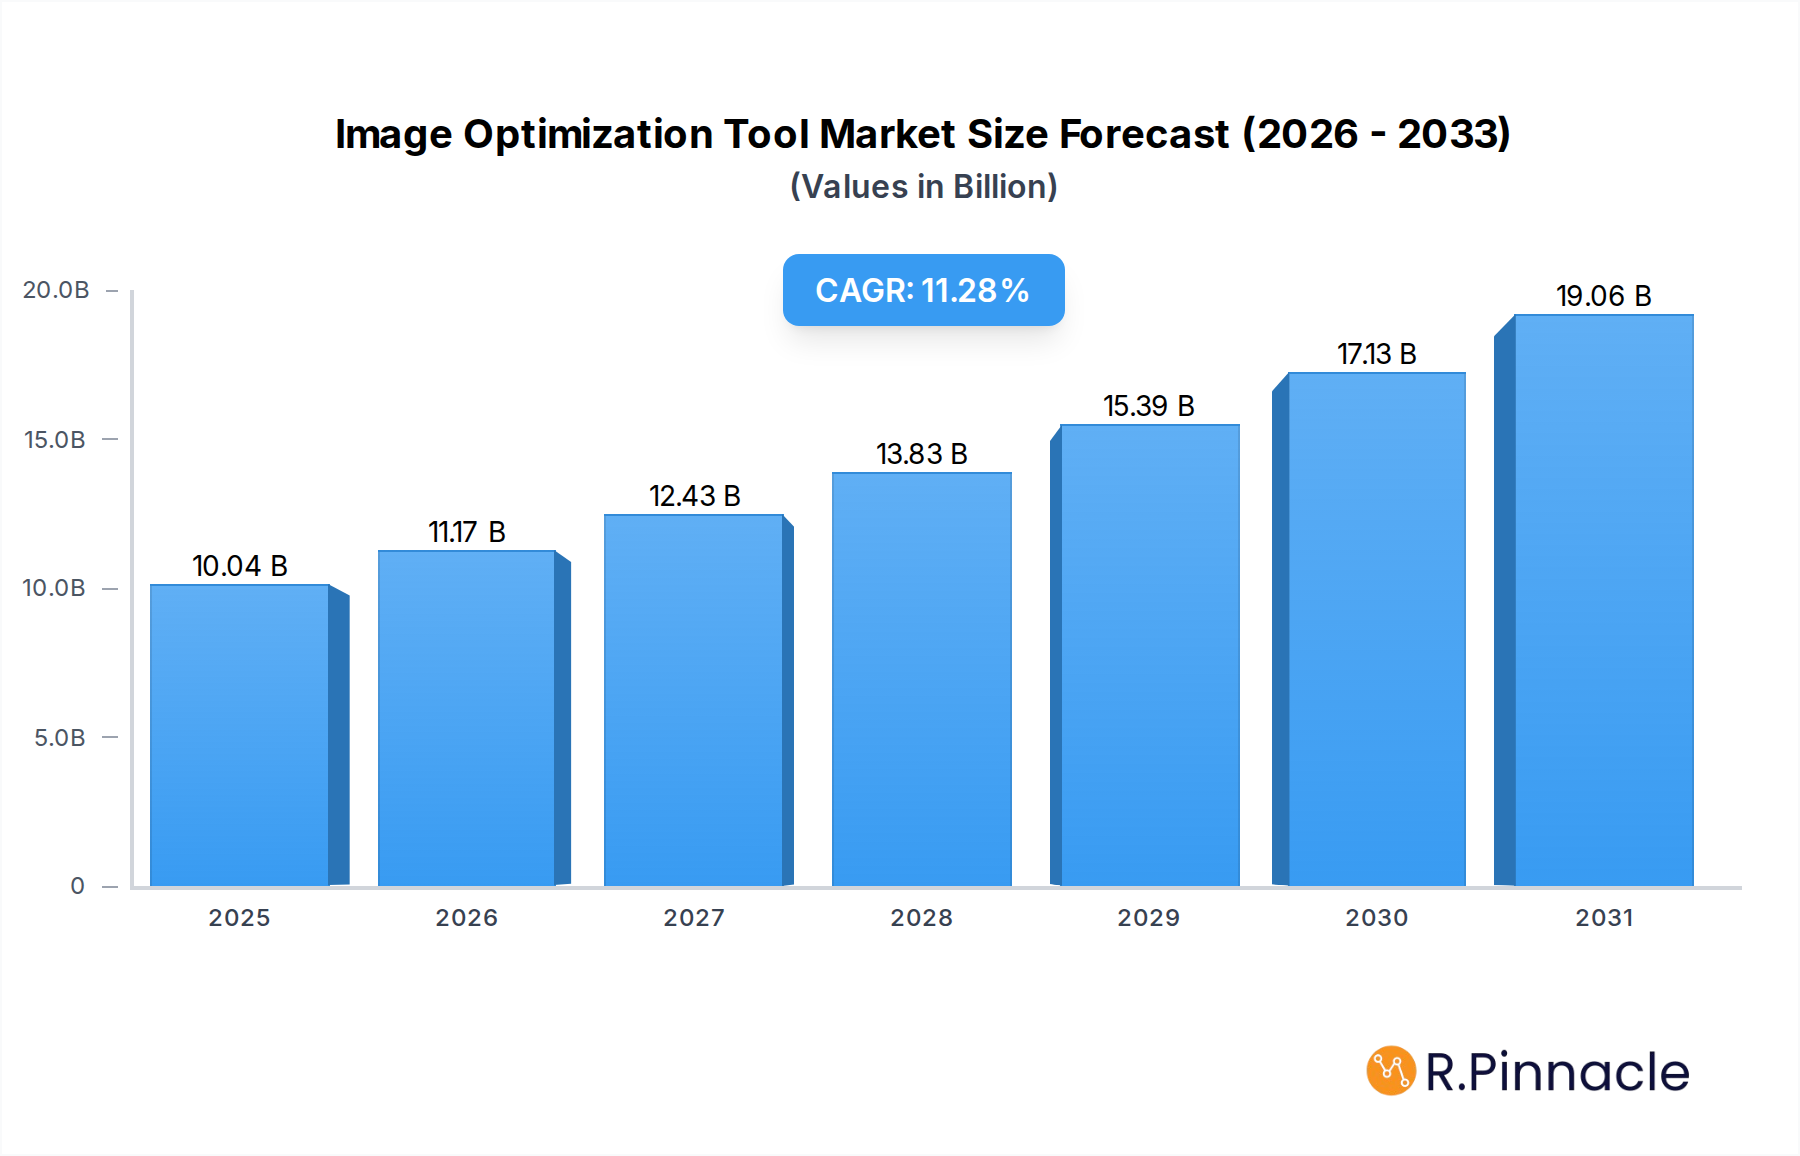
Image Optimization Tool Market Size (In Billion)

Enterprises across various sectors, from media and entertainment to retail and healthcare, are increasingly relying on these solutions to manage vast libraries of images efficiently. The growing sophistication of user demands, particularly for high-resolution imagery that loads instantaneously, underscores the indispensability of image optimization. Furthermore, advancements in Artificial Intelligence Software Market capabilities are enabling more intelligent and automated image processing, leading to enhanced quality and efficiency in areas like automatic tagging, smart cropping, and content-aware resizing. The competitive landscape is characterized by continuous innovation, with key players constantly introducing new features such as real-time optimization, AI-driven enhancements, and seamless integration with existing digital asset management and content management systems. The broader Software as a Service Market paradigm strongly supports the widespread adoption of these tools due to their subscription-based models, cloud accessibility, and reduced operational overhead for end-users. The increasing focus on sustainability also indirectly drives adoption, as optimized images contribute to lower data transfer, which can reduce energy consumption for data centers. As digital transformation accelerates globally, encompassing everything from individual bloggers to large-scale Digital Publishing Market houses, the Image Optimization Tool Market is set to maintain its upward trajectory, with a strong emphasis on integration, automation, and delivering measurable ROI through improved web performance, reduced operational costs, and enhanced user engagement. This market's future is intertwined with the evolution of visual communication and the relentless pursuit of digital efficiency.
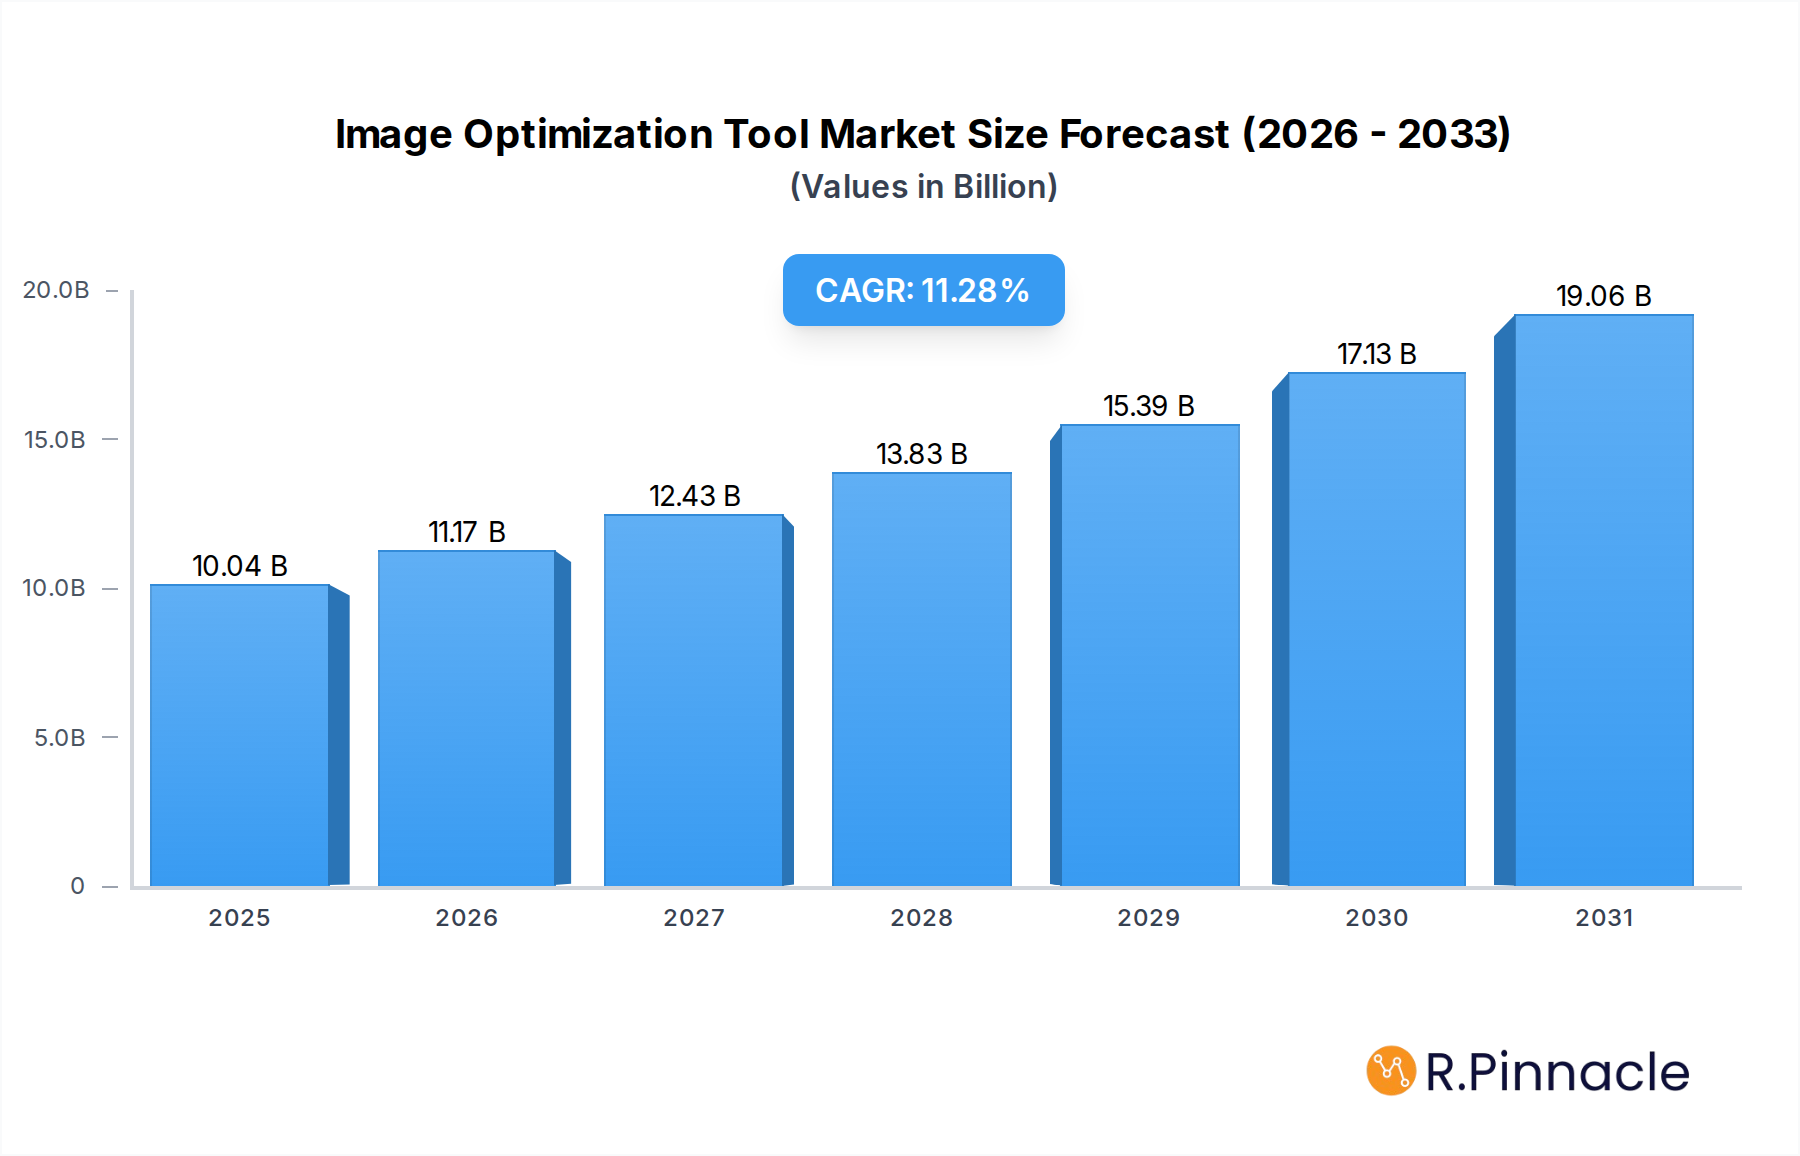
Image Optimization Tool Company Market Share
Cloud-Based Deployment Dominance in Image Optimization Tool Market
The Cloud-Based deployment model stands out as the dominant and rapidly expanding segment within the Image Optimization Tool Market, largely attributed to its inherent flexibility, scalability, and cost-effectiveness. The pervasive shift towards cloud infrastructure across the enterprise landscape has positioned cloud-based image optimization solutions as the preferred choice for businesses of all sizes, from nascent startups to large enterprises. Cloud-based platforms eliminate the need for significant upfront infrastructure investments and ongoing maintenance typically associated with on-premises solutions. This makes them particularly attractive for Small & Medium Enterprises (SMEs) seeking robust image management capabilities without extensive IT overhead, while also providing the robust scalability demanded by large digital entities.
Key players such as Cloudinary, Cloudflare, Imgix, ImageKit.io, Akamai, and Sirv are at the forefront of this segment, offering comprehensive suites that encompass not only fundamental image optimization (compression, resizing, format conversion) but also advanced features like real-time manipulation, adaptive delivery tailored to device and network conditions, and seamless integration with various content management systems (CMS), Digital Asset Management Market systems, and Content Delivery Network Market services. These platforms provide highly available and geographically distributed services, ensuring optimal image delivery speeds to users worldwide, a critical factor for global E-commerce Platform Market operations, international Digital Publishing Market initiatives, and any website focused on superior Web Performance Optimization Market. The rapid adoption of cloud-native architectures and microservices also inherently favors cloud-based image optimization, allowing for seamless integration into modern development workflows and continuous deployment pipelines.
The dominance of the Cloud-Based Software Market in this domain is further solidified by the continuous innovation cycles facilitated by cloud environments. Vendors can rapidly deploy updates, introduce new AI-powered features for automatic enhancement, content-aware cropping, or intelligent compression, and scale resources dynamically to meet fluctuating demand without service interruption. This agility and responsiveness are a stark contrast to the more rigid and slower update cycles characteristic of the On-Premises Software Market. While on-premises solutions still serve niche requirements for organizations with stringent data sovereignty, security, or regulatory compliance mandates that necessitate complete control over their infrastructure, its market share is consolidating or even diminishing relative to the rapid expansion of cloud offerings. The total cost of ownership (TCO) often favors cloud solutions when considering hardware, software licensing, IT staff, security updates, and scalability. The future trajectory suggests an even greater penetration of cloud-based models, driven by the ongoing digital transformation agenda and the overarching benefits offered by the Software as a Service Market paradigm in delivering specialized tools. The ease of access, predictable pay-per-use or subscription-based pricing models, and reduced IT burden make cloud-based image optimization solutions an indispensable component of contemporary digital strategies, ensuring its continued leadership in the Image Optimization Tool Market.
Key Market Drivers for Image Optimization Tool Market
The Image Optimization Tool Market is experiencing substantial growth propelled by several critical drivers, each underpinned by quantifiable digital trends and strategic imperatives. A primary driver is the exponential growth of visual content online, with billions of images and videos uploaded daily across social media, websites, and digital platforms. This sheer volume necessitates efficient management and delivery to maintain performance standards. For instance, studies by Akamai indicate that images constitute, on average, over 50% of a webpage's total byte size, making their optimization crucial for faster loading and reduced bounce rates.
Secondly, the increasing emphasis on web performance and user experience (UX) directly fuels demand. With Google’s Core Web Vitals becoming a key ranking factor, optimizing images for speed (Largest Contentful Paint, Cumulative Layout Shift) is no longer optional but a strategic SEO requirement. A delay of just one second in page load time can lead to a 7% reduction in conversions, highlighting the direct financial impact on businesses, particularly within the E-commerce Platform Market. This strategic imperative significantly drives the adoption of advanced image optimization solutions as part of broader Web Performance Optimization Market initiatives.
Thirdly, the proliferation of mobile internet usage mandates adaptive image delivery. Mobile devices now account for over 50% of global website traffic, requiring images to be optimized for varying screen sizes, resolutions, and network conditions without manual intervention. This demand for responsive image delivery pushes tools to offer features like automatic resizing and format conversion, ensuring a seamless experience across all devices.
Furthermore, the rise of Artificial Intelligence (AI) in content creation and enhancement is a significant catalyst. AI-based image enhancement and compression algorithms provide superior quality-to-size ratios, automatic content tagging, smart cropping, and background removal, which were previously manual and time-consuming tasks. The integration of Artificial Intelligence Software Market capabilities within image optimization platforms unlocks new levels of automation and efficiency, allowing for personalized and context-aware image delivery at scale.
Finally, the increasing operational costs associated with data storage and bandwidth serve as an economic driver. Optimized images consume less storage space on servers and require less bandwidth for delivery, translating into tangible cost savings for businesses. For Content Delivery Network Market providers, efficient image delivery is central to their service offering, as it directly impacts their infrastructure utilization and profitability. These quantifiable benefits ensure sustained investment in image optimization technologies across the digital ecosystem.
Competitive Ecosystem of Image Optimization Tool Market
The competitive landscape of the Image Optimization Tool Market is characterized by a mix of specialized vendors, cloud service providers with image optimization features, and broader digital experience platforms. Innovation focuses on AI-driven automation, real-time optimization, and seamless integration capabilities.
- Cloudinary: A prominent player offering a comprehensive cloud-based platform for image and video management, processing, and delivery, widely adopted for its powerful API and extensive features for dynamic media transformation.
- Cloudflare: Known for its robust Content Delivery Network (CDN) services, Cloudflare integrates image optimization features, including automatic image resizing and WebP conversion, as part of its broader web performance and security offerings.
- Imgix: Specializes in real-time image processing and delivery, allowing developers to manipulate images on-the-fly through URL parameters, ensuring optimal resolution and format for any device.
- ImageKit.io: Provides a complete image optimization and CDN solution, focusing on performance, developer-friendliness, and cost-efficiency with features like smart compression and automatic quality adjustments.
- TinyPNG (Voormedia): Popular for its easy-to-use image compression service, specializing in reducing PNG and JPEG file sizes with minimal quality loss, catering to individual users and small businesses.
- ShortPixel: Offers a range of image optimization plugins and APIs for websites, providing lossless, glossy, and lossy compression options along with WebP conversion and CDN integration.
- Kraken.io: A powerful image optimization and compression tool that reduces file sizes for various image formats through an intuitive API and web interface, suitable for both individual developers and large-scale projects.
- Optimole: A WordPress plugin and cloud service that optimizes images in real-time based on the visitor's browser and viewport, serving them from a global CDN for enhanced speed.
- Adobe: Through its Creative Cloud suite and Adobe Experience Cloud, Adobe offers various image editing and optimization capabilities, particularly relevant for professionals in the Digital Publishing Market and content creation industries.
- Akamai: A global leader in CDN services, Akamai provides advanced image and media optimization solutions that accelerate delivery and improve user experience for large enterprises and media companies.
- Sirv: Offers a comprehensive suite for image processing, hosting, and delivery, including responsive imaging, 360-degree spin support, and video hosting, focused on high-quality visual content.
- Gumlet: Specializes in automated image optimization, resizing, and delivery, leveraging AI to improve image quality and performance across websites and applications, integrated with a global CDN.
- Uploadcare: Provides a full-stack media platform, including file uploading, processing, and intelligent content delivery network, making it a comprehensive solution for managing user-generated content.
- Fastly Image Optimizer: An edge cloud platform that includes real-time image optimization, allowing developers to transform and deliver images from the network edge for maximum speed and efficiency.
- ImageEngine: Focuses on intelligent image optimization and CDN services, automatically detecting device capabilities and delivering the optimal image version to improve website speed and user experience.
Recent Developments & Milestones in Image Optimization Tool Market
The Image Optimization Tool Market has been dynamic, with continuous advancements driven by the escalating demand for faster web experiences and richer visual content. Key developments typically revolve around enhancing automation, integrating AI, and expanding platform compatibility.
- Q4 2024: Cloudinary announced expanded AI capabilities for automatic image tagging and advanced semantic content analysis, further streamlining Digital Asset Management Market workflows for large enterprises.
- Q3 2024: Several providers, including Imgix and ImageKit.io, rolled out enhanced video optimization features, reflecting the growing convergence of image and video content within digital strategies, crucial for the Content Delivery Network Market.
- Q2 2024: Partnerships intensified between image optimization platforms and leading E-commerce Platform Market providers, focusing on deeper integrations to automate product image delivery and improve conversion rates.
- Q1 2024: Fastly Image Optimizer introduced new real-time image transformation options directly at the edge, leveraging its global network to further reduce latency and improve load times for global users.
- Q4 2023: Investment in the Artificial Intelligence Software Market specifically for image enhancement tools saw a significant uptick, leading to more sophisticated algorithms for noise reduction, super-resolution, and intelligent cropping.
- Q3 2023: ShortPixel and Optimole released updates to their WordPress plugins, adding support for new image formats like AVIF and expanding their CDN coverage, appealing to the vast Software as a Service Market for website owners.
- Q2 2023: Cloudflare continued to enhance its image resizing and optimization features within its core CDN offering, bolstering its position as an integrated solution for Web Performance Optimization Market.
- Q1 2023: Adobe further integrated its Sensei AI capabilities into its Creative Cloud applications, offering more seamless native image optimization functionalities for designers and content creators in the Digital Publishing Market.
Regional Market Breakdown for Image Optimization Tool Market
The Image Optimization Tool Market demonstrates varied growth dynamics and adoption rates across different global regions, influenced by digital infrastructure, e-commerce penetration, and regulatory landscapes.
North America holds a significant revenue share in the Image Optimization Tool Market, characterized by early adoption of cloud technologies and a high concentration of digital-first businesses. The region benefits from a mature Software as a Service Market ecosystem and a strong emphasis on Web Performance Optimization Market, particularly in the United States and Canada. Demand is driven by large enterprises and a vibrant startup scene heavily reliant on visual content for marketing and engagement. The presence of numerous tech giants and continuous innovation in the Artificial Intelligence Software Market also contributes to its leading position.
Europe represents another substantial market, fueled by stringent data privacy regulations (like GDPR) which, while not directly impacting image optimization, drive demand for sophisticated content delivery mechanisms and secure cloud services. Countries like the UK, Germany, and France show high adoption rates, particularly in the E-commerce Platform Market and Digital Publishing Market sectors. The region's focus on digital transformation and strong cloud infrastructure makes it a fertile ground for cloud-based image optimization solutions.
Asia Pacific (APAC) is projected to be the fastest-growing region in the Image Optimization Tool Market over the forecast period. This growth is primarily driven by massive internet penetration, the explosive growth of mobile commerce, and rapid digital transformation initiatives in countries such as China, India, Japan, and South Korea. The sheer volume of online content generated and consumed, coupled with the expansion of the Content Delivery Network Market in the region, creates immense demand for optimized image delivery. Investments in cloud infrastructure and AI technologies further accelerate market expansion here.
Latin America and Middle East & Africa (MEA) are emerging markets, exhibiting considerable potential. While currently holding smaller revenue shares compared to North America and Europe, these regions are experiencing rapid digitalization, increasing smartphone adoption, and a burgeoning e-commerce sector. Investments in digital infrastructure and growing awareness of the importance of web performance are expected to drive robust growth in image optimization tool adoption in these areas in the coming years. The demand here is often for cost-effective, scalable cloud-based solutions to support growing online presences.
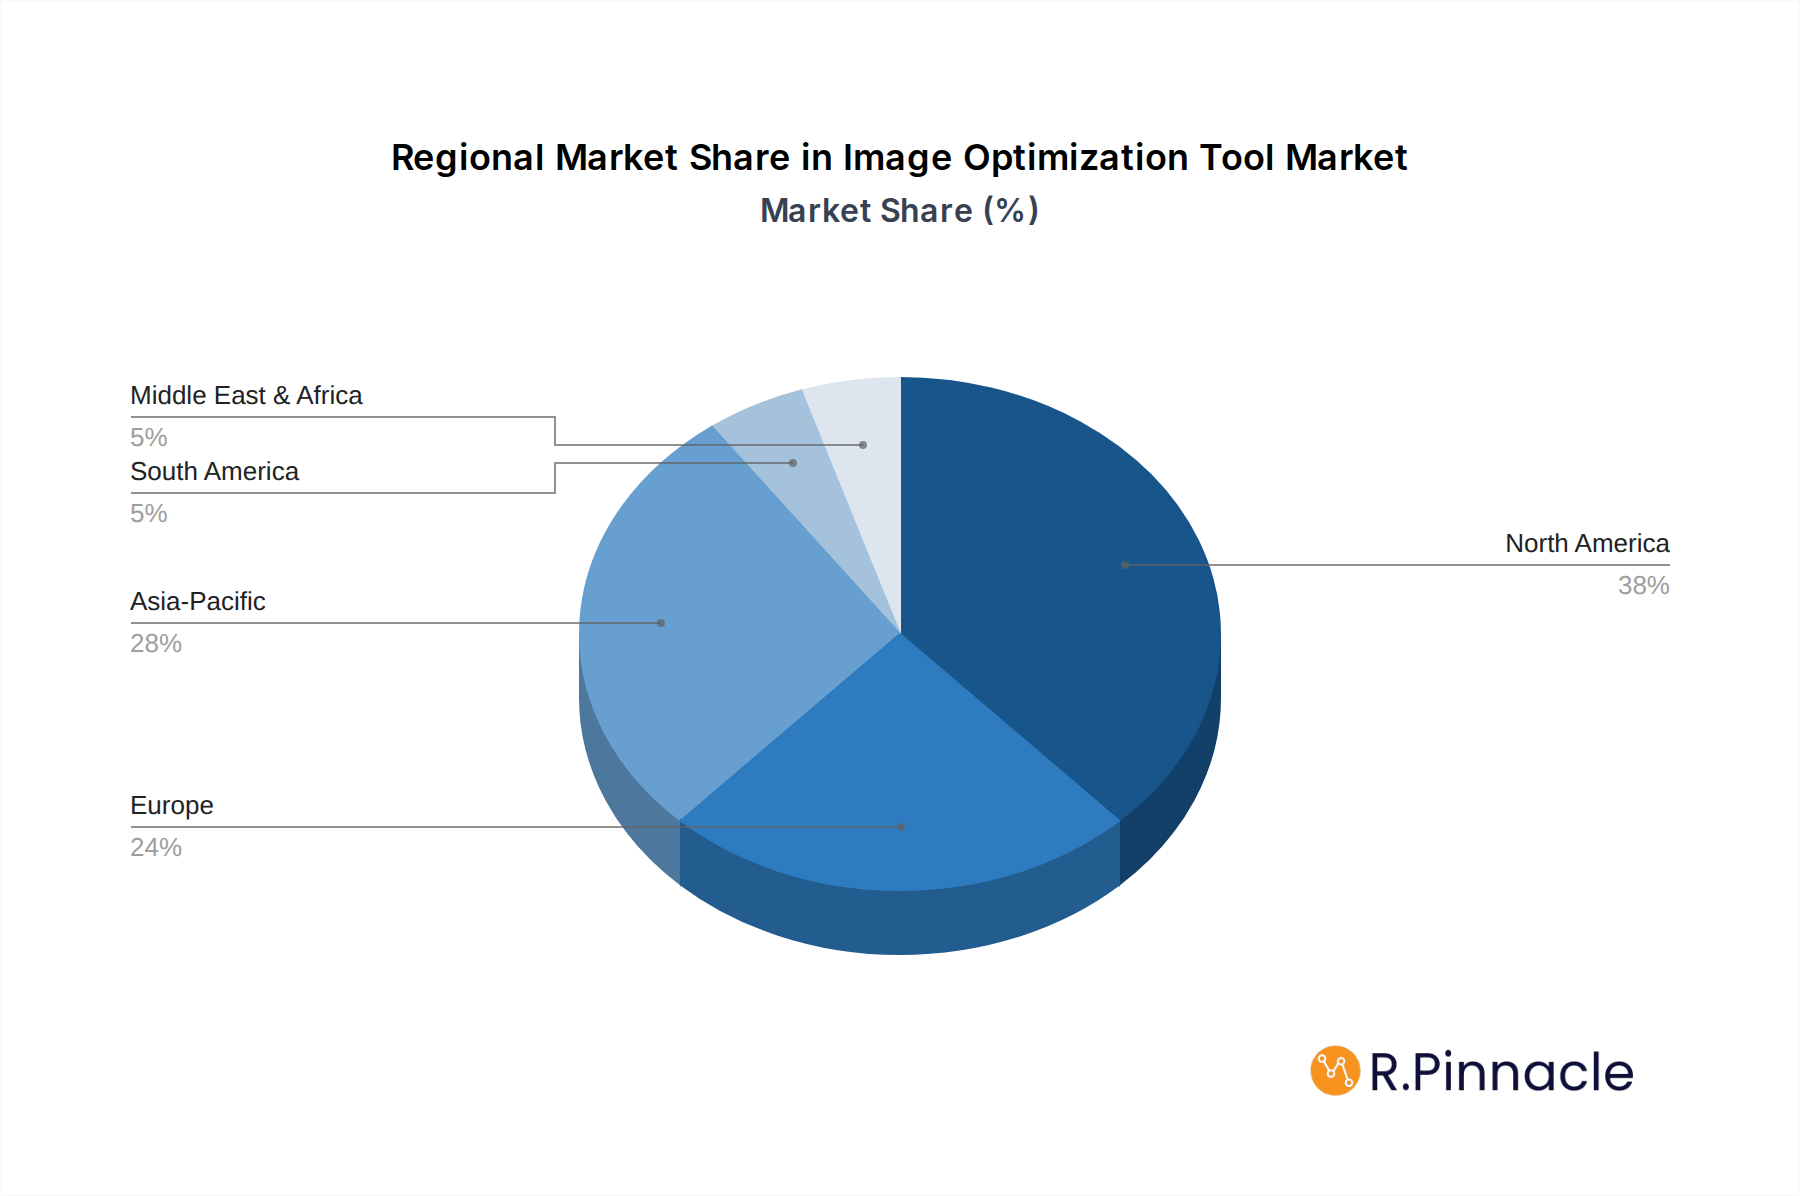
Image Optimization Tool Regional Market Share
Investment & Funding Activity in Image Optimization Tool Market
Investment and funding activity within the Image Optimization Tool Market over the past 2-3 years has primarily been directed towards innovation in AI-driven automation, platform integration, and specialized solutions addressing niche content delivery challenges. The landscape is characterized by strategic partnerships aimed at broadening ecosystem compatibility and venture funding rounds bolstering product development.
Several specialized image optimization platforms have successfully raised capital to enhance their core technologies, particularly focusing on advanced compression algorithms, real-time image manipulation at the edge, and intelligent content-aware processing leveraging the Artificial Intelligence Software Market. For instance, companies that offer seamless integration with the Content Delivery Network Market and popular Content Management Systems (CMS) have attracted significant interest, as enterprises seek unified solutions for their digital asset workflows. The demand for efficiency in the Digital Asset Management Market specifically often drives investment into tools that can seamlessly handle large volumes of visual content.
Mergers and acquisitions have been less frequent but strategic, with larger cloud service providers or Digital Publishing Market entities acquiring smaller, innovative image optimization startups to integrate their technology directly into broader offerings. This strategy aims to provide more comprehensive solutions, ranging from content creation to optimized delivery, under a single umbrella. The E-commerce Platform Market, in particular, has seen increased partnerships where image optimization solutions are integrated as native features, recognizing their direct impact on conversion rates and user experience. Venture capital funds have shown a preference for companies demonstrating significant scalability, a strong Software as a Service Market model, and a clear competitive advantage through proprietary AI or unique delivery mechanisms. The emphasis is on solutions that can offer measurable improvements in Web Performance Optimization Market metrics and effectively manage the complexities of global content delivery.
Export, Trade Flow & Tariff Impact on Image Optimization Tool Market
The Image Optimization Tool Market, predominantly composed of digital Software as a Service Market offerings, experiences "trade flow" not through physical goods but via cross-border service provision, data transfer, and regulatory frameworks. Major trade corridors are essentially the global internet backbone, with services delivered from strategically located data centers worldwide by vendors based in North America and Europe to clients globally.
Leading exporting nations, in this context, are those housing major cloud infrastructure providers and innovative software development hubs, primarily the United States, Ireland, Germany, and other countries with robust digital economies and favorable tech ecosystems. Importing nations are virtually every country with internet access, particularly those with burgeoning E-commerce Platform Market and Digital Publishing Market sectors in Asia Pacific and Latin America, which consume these services to enhance their digital presence.
Tariff and non-tariff barriers, while not traditional customs duties on software, manifest differently. Non-tariff barriers include data localization laws (e.g., in China, Russia, India) which may require data to reside within national borders, influencing where image optimization platforms deploy their infrastructure and potentially increasing operational complexity for global vendors. Data privacy regulations like GDPR in Europe and CCPA in California act as significant compliance hurdles, mandating specific data handling and consent mechanisms, which can indirectly affect the architecture and features of image optimization tools, especially concerning user-generated content. Digital service taxes, imposed by several countries, represent another form of "tariff" on these cross-border digital services, affecting profitability and pricing strategies. Quantifying the precise impact of recent trade policy on cross-border volume is challenging due to the intangible nature of the service, but increased regulatory complexity and localized tax regimes undeniably add to the cost of doing business globally, potentially limiting market entry for smaller providers or increasing the cost for end-users in affected regions, thereby subtly influencing the global competitive landscape of the Image Optimization Tool Market.
Image Optimization Tool Segmentation
-
1. Deployment Mode
- 1.1. Cloud-Based
- 1.2. On-Premises
- 1.3. Hybrid
-
2. Pricing Model
- 2.1. Freemium
- 2.2. Subscription-Based
- 2.3. Pay-Per-Use
- 2.4. One-Time License
-
3. Organization Size
- 3.1. Large Enterprises
- 3.2. Small & Medium Enterprises (SMEs)
-
4. Application
- 4.1. Image Compression
- 4.2. Image Resizing & Scaling
- 4.3. Format Conversion
- 4.4. Image CDN & Delivery Optimization
- 4.5. AI-Based Image Enhancement
- 4.6. Others
-
5. End User
- 5.1. Leisure Travelers
- 5.2. Educational Institutions
- 5.3. Researchers & Scientists
- 5.4. Corporate Groups
- 5.5. Others
Image Optimization Tool Segmentation By Geography
-
1. North America
- 1.1. United States
- 1.2. Canada
- 1.3. Mexico
-
2. South America
- 2.1. Brazil
- 2.2. Argentina
- 2.3. Rest of South America
-
3. Europe
- 3.1. United Kingdom
- 3.2. Germany
- 3.3. France
- 3.4. Italy
- 3.5. Spain
- 3.6. Russia
- 3.7. Benelux
- 3.8. Nordics
- 3.9. Rest of Europe
-
4. Middle East & Africa
- 4.1. Turkey
- 4.2. Israel
- 4.3. GCC
- 4.4. North Africa
- 4.5. South Africa
- 4.6. Rest of Middle East & Africa
-
5. Asia Pacific
- 5.1. China
- 5.2. India
- 5.3. Japan
- 5.4. South Korea
- 5.5. ASEAN
- 5.6. Oceania
- 5.7. Rest of Asia Pacific
Image Optimization Tool Regional Market Share
Geographic Coverage of Image Optimization Tool
Image Optimization Tool REPORT HIGHLIGHTS
| Aspects | Details |
|---|---|
| Study Period | 2020-2034 |
| Base Year | 2025 |
| Estimated Year | 2026 |
| Forecast Period | 2026-2034 |
| Historical Period | 2020-2025 |
| Growth Rate | CAGR of 11.28% from 2020-2034 |
| Segmentation |
|
Table of Contents
- 1. Introduction
- 1.1. Research Scope
- 1.2. Market Segmentation
- 1.3. Research Objective
- 1.4. Definitions and Assumptions
- 2. Executive Summary
- 2.1. Market Snapshot
- 3. Market Dynamics
- 3.1. Market Drivers
- 3.2. Market Restrains
- 3.3. Market Trends
- 3.4. Market Opportunities
- 4. Market Factor Analysis
- 4.1. Porters Five Forces
- 4.1.1. Bargaining Power of Suppliers
- 4.1.2. Bargaining Power of Buyers
- 4.1.3. Threat of New Entrants
- 4.1.4. Threat of Substitutes
- 4.1.5. Competitive Rivalry
- 4.2. PESTEL analysis
- 4.3. BCG Analysis
- 4.3.1. Stars (High Growth, High Market Share)
- 4.3.2. Cash Cows (Low Growth, High Market Share)
- 4.3.3. Question Mark (High Growth, Low Market Share)
- 4.3.4. Dogs (Low Growth, Low Market Share)
- 4.4. Ansoff Matrix Analysis
- 4.5. Supply Chain Analysis
- 4.6. Regulatory Landscape
- 4.7. Current Market Potential and Opportunity Assessment (TAM–SAM–SOM Framework)
- 4.8. PRI Analyst Note
- 4.1. Porters Five Forces
- 5. Market Analysis, Insights and Forecast 2021-2033
- 5.1. Market Analysis, Insights and Forecast - by Deployment Mode
- 5.1.1. Cloud-Based
- 5.1.2. On-Premises
- 5.1.3. Hybrid
- 5.2. Market Analysis, Insights and Forecast - by Pricing Model
- 5.2.1. Freemium
- 5.2.2. Subscription-Based
- 5.2.3. Pay-Per-Use
- 5.2.4. One-Time License
- 5.3. Market Analysis, Insights and Forecast - by Organization Size
- 5.3.1. Large Enterprises
- 5.3.2. Small & Medium Enterprises (SMEs)
- 5.4. Market Analysis, Insights and Forecast - by Application
- 5.4.1. Image Compression
- 5.4.2. Image Resizing & Scaling
- 5.4.3. Format Conversion
- 5.4.4. Image CDN & Delivery Optimization
- 5.4.5. AI-Based Image Enhancement
- 5.4.6. Others
- 5.5. Market Analysis, Insights and Forecast - by End User
- 5.5.1. Leisure Travelers
- 5.5.2. Educational Institutions
- 5.5.3. Researchers & Scientists
- 5.5.4. Corporate Groups
- 5.5.5. Others
- 5.6. Market Analysis, Insights and Forecast - by Region
- 5.6.1. North America
- 5.6.2. South America
- 5.6.3. Europe
- 5.6.4. Middle East & Africa
- 5.6.5. Asia Pacific
- 5.1. Market Analysis, Insights and Forecast - by Deployment Mode
- 6. Global Image Optimization Tool Analysis, Insights and Forecast, 2021-2033
- 6.1. Market Analysis, Insights and Forecast - by Deployment Mode
- 6.1.1. Cloud-Based
- 6.1.2. On-Premises
- 6.1.3. Hybrid
- 6.2. Market Analysis, Insights and Forecast - by Pricing Model
- 6.2.1. Freemium
- 6.2.2. Subscription-Based
- 6.2.3. Pay-Per-Use
- 6.2.4. One-Time License
- 6.3. Market Analysis, Insights and Forecast - by Organization Size
- 6.3.1. Large Enterprises
- 6.3.2. Small & Medium Enterprises (SMEs)
- 6.4. Market Analysis, Insights and Forecast - by Application
- 6.4.1. Image Compression
- 6.4.2. Image Resizing & Scaling
- 6.4.3. Format Conversion
- 6.4.4. Image CDN & Delivery Optimization
- 6.4.5. AI-Based Image Enhancement
- 6.4.6. Others
- 6.5. Market Analysis, Insights and Forecast - by End User
- 6.5.1. Leisure Travelers
- 6.5.2. Educational Institutions
- 6.5.3. Researchers & Scientists
- 6.5.4. Corporate Groups
- 6.5.5. Others
- 6.1. Market Analysis, Insights and Forecast - by Deployment Mode
- 7. North America Image Optimization Tool Analysis, Insights and Forecast, 2020-2032
- 7.1. Market Analysis, Insights and Forecast - by Deployment Mode
- 7.1.1. Cloud-Based
- 7.1.2. On-Premises
- 7.1.3. Hybrid
- 7.2. Market Analysis, Insights and Forecast - by Pricing Model
- 7.2.1. Freemium
- 7.2.2. Subscription-Based
- 7.2.3. Pay-Per-Use
- 7.2.4. One-Time License
- 7.3. Market Analysis, Insights and Forecast - by Organization Size
- 7.3.1. Large Enterprises
- 7.3.2. Small & Medium Enterprises (SMEs)
- 7.4. Market Analysis, Insights and Forecast - by Application
- 7.4.1. Image Compression
- 7.4.2. Image Resizing & Scaling
- 7.4.3. Format Conversion
- 7.4.4. Image CDN & Delivery Optimization
- 7.4.5. AI-Based Image Enhancement
- 7.4.6. Others
- 7.5. Market Analysis, Insights and Forecast - by End User
- 7.5.1. Leisure Travelers
- 7.5.2. Educational Institutions
- 7.5.3. Researchers & Scientists
- 7.5.4. Corporate Groups
- 7.5.5. Others
- 7.1. Market Analysis, Insights and Forecast - by Deployment Mode
- 8. South America Image Optimization Tool Analysis, Insights and Forecast, 2020-2032
- 8.1. Market Analysis, Insights and Forecast - by Deployment Mode
- 8.1.1. Cloud-Based
- 8.1.2. On-Premises
- 8.1.3. Hybrid
- 8.2. Market Analysis, Insights and Forecast - by Pricing Model
- 8.2.1. Freemium
- 8.2.2. Subscription-Based
- 8.2.3. Pay-Per-Use
- 8.2.4. One-Time License
- 8.3. Market Analysis, Insights and Forecast - by Organization Size
- 8.3.1. Large Enterprises
- 8.3.2. Small & Medium Enterprises (SMEs)
- 8.4. Market Analysis, Insights and Forecast - by Application
- 8.4.1. Image Compression
- 8.4.2. Image Resizing & Scaling
- 8.4.3. Format Conversion
- 8.4.4. Image CDN & Delivery Optimization
- 8.4.5. AI-Based Image Enhancement
- 8.4.6. Others
- 8.5. Market Analysis, Insights and Forecast - by End User
- 8.5.1. Leisure Travelers
- 8.5.2. Educational Institutions
- 8.5.3. Researchers & Scientists
- 8.5.4. Corporate Groups
- 8.5.5. Others
- 8.1. Market Analysis, Insights and Forecast - by Deployment Mode
- 9. Europe Image Optimization Tool Analysis, Insights and Forecast, 2020-2032
- 9.1. Market Analysis, Insights and Forecast - by Deployment Mode
- 9.1.1. Cloud-Based
- 9.1.2. On-Premises
- 9.1.3. Hybrid
- 9.2. Market Analysis, Insights and Forecast - by Pricing Model
- 9.2.1. Freemium
- 9.2.2. Subscription-Based
- 9.2.3. Pay-Per-Use
- 9.2.4. One-Time License
- 9.3. Market Analysis, Insights and Forecast - by Organization Size
- 9.3.1. Large Enterprises
- 9.3.2. Small & Medium Enterprises (SMEs)
- 9.4. Market Analysis, Insights and Forecast - by Application
- 9.4.1. Image Compression
- 9.4.2. Image Resizing & Scaling
- 9.4.3. Format Conversion
- 9.4.4. Image CDN & Delivery Optimization
- 9.4.5. AI-Based Image Enhancement
- 9.4.6. Others
- 9.5. Market Analysis, Insights and Forecast - by End User
- 9.5.1. Leisure Travelers
- 9.5.2. Educational Institutions
- 9.5.3. Researchers & Scientists
- 9.5.4. Corporate Groups
- 9.5.5. Others
- 9.1. Market Analysis, Insights and Forecast - by Deployment Mode
- 10. Middle East & Africa Image Optimization Tool Analysis, Insights and Forecast, 2020-2032
- 10.1. Market Analysis, Insights and Forecast - by Deployment Mode
- 10.1.1. Cloud-Based
- 10.1.2. On-Premises
- 10.1.3. Hybrid
- 10.2. Market Analysis, Insights and Forecast - by Pricing Model
- 10.2.1. Freemium
- 10.2.2. Subscription-Based
- 10.2.3. Pay-Per-Use
- 10.2.4. One-Time License
- 10.3. Market Analysis, Insights and Forecast - by Organization Size
- 10.3.1. Large Enterprises
- 10.3.2. Small & Medium Enterprises (SMEs)
- 10.4. Market Analysis, Insights and Forecast - by Application
- 10.4.1. Image Compression
- 10.4.2. Image Resizing & Scaling
- 10.4.3. Format Conversion
- 10.4.4. Image CDN & Delivery Optimization
- 10.4.5. AI-Based Image Enhancement
- 10.4.6. Others
- 10.5. Market Analysis, Insights and Forecast - by End User
- 10.5.1. Leisure Travelers
- 10.5.2. Educational Institutions
- 10.5.3. Researchers & Scientists
- 10.5.4. Corporate Groups
- 10.5.5. Others
- 10.1. Market Analysis, Insights and Forecast - by Deployment Mode
- 11. Asia Pacific Image Optimization Tool Analysis, Insights and Forecast, 2020-2032
- 11.1. Market Analysis, Insights and Forecast - by Deployment Mode
- 11.1.1. Cloud-Based
- 11.1.2. On-Premises
- 11.1.3. Hybrid
- 11.2. Market Analysis, Insights and Forecast - by Pricing Model
- 11.2.1. Freemium
- 11.2.2. Subscription-Based
- 11.2.3. Pay-Per-Use
- 11.2.4. One-Time License
- 11.3. Market Analysis, Insights and Forecast - by Organization Size
- 11.3.1. Large Enterprises
- 11.3.2. Small & Medium Enterprises (SMEs)
- 11.4. Market Analysis, Insights and Forecast - by Application
- 11.4.1. Image Compression
- 11.4.2. Image Resizing & Scaling
- 11.4.3. Format Conversion
- 11.4.4. Image CDN & Delivery Optimization
- 11.4.5. AI-Based Image Enhancement
- 11.4.6. Others
- 11.5. Market Analysis, Insights and Forecast - by End User
- 11.5.1. Leisure Travelers
- 11.5.2. Educational Institutions
- 11.5.3. Researchers & Scientists
- 11.5.4. Corporate Groups
- 11.5.5. Others
- 11.1. Market Analysis, Insights and Forecast - by Deployment Mode
- 12. Competitive Analysis
- 12.1. Company Profiles
- 12.1.1 Cloudinary
- 12.1.1.1. Company Overview
- 12.1.1.2. Products
- 12.1.1.3. Company Financials
- 12.1.1.4. SWOT Analysis
- 12.1.2 Cloudflare
- 12.1.2.1. Company Overview
- 12.1.2.2. Products
- 12.1.2.3. Company Financials
- 12.1.2.4. SWOT Analysis
- 12.1.3 Imgix
- 12.1.3.1. Company Overview
- 12.1.3.2. Products
- 12.1.3.3. Company Financials
- 12.1.3.4. SWOT Analysis
- 12.1.4 ImageKit.io
- 12.1.4.1. Company Overview
- 12.1.4.2. Products
- 12.1.4.3. Company Financials
- 12.1.4.4. SWOT Analysis
- 12.1.5 TinyPNG (Voormedia)
- 12.1.5.1. Company Overview
- 12.1.5.2. Products
- 12.1.5.3. Company Financials
- 12.1.5.4. SWOT Analysis
- 12.1.6 ShortPixel
- 12.1.6.1. Company Overview
- 12.1.6.2. Products
- 12.1.6.3. Company Financials
- 12.1.6.4. SWOT Analysis
- 12.1.7 Kraken.io
- 12.1.7.1. Company Overview
- 12.1.7.2. Products
- 12.1.7.3. Company Financials
- 12.1.7.4. SWOT Analysis
- 12.1.8 Optimole
- 12.1.8.1. Company Overview
- 12.1.8.2. Products
- 12.1.8.3. Company Financials
- 12.1.8.4. SWOT Analysis
- 12.1.9 Adobe
- 12.1.9.1. Company Overview
- 12.1.9.2. Products
- 12.1.9.3. Company Financials
- 12.1.9.4. SWOT Analysis
- 12.1.10 Akamai
- 12.1.10.1. Company Overview
- 12.1.10.2. Products
- 12.1.10.3. Company Financials
- 12.1.10.4. SWOT Analysis
- 12.1.11 Sirv
- 12.1.11.1. Company Overview
- 12.1.11.2. Products
- 12.1.11.3. Company Financials
- 12.1.11.4. SWOT Analysis
- 12.1.12 Gumlet
- 12.1.12.1. Company Overview
- 12.1.12.2. Products
- 12.1.12.3. Company Financials
- 12.1.12.4. SWOT Analysis
- 12.1.13 Uploadcare
- 12.1.13.1. Company Overview
- 12.1.13.2. Products
- 12.1.13.3. Company Financials
- 12.1.13.4. SWOT Analysis
- 12.1.14 Fastly Image Optimizer
- 12.1.14.1. Company Overview
- 12.1.14.2. Products
- 12.1.14.3. Company Financials
- 12.1.14.4. SWOT Analysis
- 12.1.15 ImageEngine
- 12.1.15.1. Company Overview
- 12.1.15.2. Products
- 12.1.15.3. Company Financials
- 12.1.15.4. SWOT Analysis
- 12.1.16 Others
- 12.1.16.1. Company Overview
- 12.1.16.2. Products
- 12.1.16.3. Company Financials
- 12.1.16.4. SWOT Analysis
- 12.1.1 Cloudinary
- 12.2. Market Entropy
- 12.2.1 Company's Key Areas Served
- 12.2.2 Recent Developments
- 12.3. Company Market Share Analysis 2025
- 12.3.1 Top 5 Companies Market Share Analysis
- 12.3.2 Top 3 Companies Market Share Analysis
- 12.4. List of Potential Customers
- 13. Research Methodology
List of Figures
- Figure 1: Global Image Optimization Tool Revenue Breakdown (billion, %) by Region 2025 & 2033
- Figure 2: North America Image Optimization Tool Revenue (billion), by Deployment Mode 2025 & 2033
- Figure 3: North America Image Optimization Tool Revenue Share (%), by Deployment Mode 2025 & 2033
- Figure 4: North America Image Optimization Tool Revenue (billion), by Pricing Model 2025 & 2033
- Figure 5: North America Image Optimization Tool Revenue Share (%), by Pricing Model 2025 & 2033
- Figure 6: North America Image Optimization Tool Revenue (billion), by Organization Size 2025 & 2033
- Figure 7: North America Image Optimization Tool Revenue Share (%), by Organization Size 2025 & 2033
- Figure 8: North America Image Optimization Tool Revenue (billion), by Application 2025 & 2033
- Figure 9: North America Image Optimization Tool Revenue Share (%), by Application 2025 & 2033
- Figure 10: North America Image Optimization Tool Revenue (billion), by End User 2025 & 2033
- Figure 11: North America Image Optimization Tool Revenue Share (%), by End User 2025 & 2033
- Figure 12: North America Image Optimization Tool Revenue (billion), by Country 2025 & 2033
- Figure 13: North America Image Optimization Tool Revenue Share (%), by Country 2025 & 2033
- Figure 14: South America Image Optimization Tool Revenue (billion), by Deployment Mode 2025 & 2033
- Figure 15: South America Image Optimization Tool Revenue Share (%), by Deployment Mode 2025 & 2033
- Figure 16: South America Image Optimization Tool Revenue (billion), by Pricing Model 2025 & 2033
- Figure 17: South America Image Optimization Tool Revenue Share (%), by Pricing Model 2025 & 2033
- Figure 18: South America Image Optimization Tool Revenue (billion), by Organization Size 2025 & 2033
- Figure 19: South America Image Optimization Tool Revenue Share (%), by Organization Size 2025 & 2033
- Figure 20: South America Image Optimization Tool Revenue (billion), by Application 2025 & 2033
- Figure 21: South America Image Optimization Tool Revenue Share (%), by Application 2025 & 2033
- Figure 22: South America Image Optimization Tool Revenue (billion), by End User 2025 & 2033
- Figure 23: South America Image Optimization Tool Revenue Share (%), by End User 2025 & 2033
- Figure 24: South America Image Optimization Tool Revenue (billion), by Country 2025 & 2033
- Figure 25: South America Image Optimization Tool Revenue Share (%), by Country 2025 & 2033
- Figure 26: Europe Image Optimization Tool Revenue (billion), by Deployment Mode 2025 & 2033
- Figure 27: Europe Image Optimization Tool Revenue Share (%), by Deployment Mode 2025 & 2033
- Figure 28: Europe Image Optimization Tool Revenue (billion), by Pricing Model 2025 & 2033
- Figure 29: Europe Image Optimization Tool Revenue Share (%), by Pricing Model 2025 & 2033
- Figure 30: Europe Image Optimization Tool Revenue (billion), by Organization Size 2025 & 2033
- Figure 31: Europe Image Optimization Tool Revenue Share (%), by Organization Size 2025 & 2033
- Figure 32: Europe Image Optimization Tool Revenue (billion), by Application 2025 & 2033
- Figure 33: Europe Image Optimization Tool Revenue Share (%), by Application 2025 & 2033
- Figure 34: Europe Image Optimization Tool Revenue (billion), by End User 2025 & 2033
- Figure 35: Europe Image Optimization Tool Revenue Share (%), by End User 2025 & 2033
- Figure 36: Europe Image Optimization Tool Revenue (billion), by Country 2025 & 2033
- Figure 37: Europe Image Optimization Tool Revenue Share (%), by Country 2025 & 2033
- Figure 38: Middle East & Africa Image Optimization Tool Revenue (billion), by Deployment Mode 2025 & 2033
- Figure 39: Middle East & Africa Image Optimization Tool Revenue Share (%), by Deployment Mode 2025 & 2033
- Figure 40: Middle East & Africa Image Optimization Tool Revenue (billion), by Pricing Model 2025 & 2033
- Figure 41: Middle East & Africa Image Optimization Tool Revenue Share (%), by Pricing Model 2025 & 2033
- Figure 42: Middle East & Africa Image Optimization Tool Revenue (billion), by Organization Size 2025 & 2033
- Figure 43: Middle East & Africa Image Optimization Tool Revenue Share (%), by Organization Size 2025 & 2033
- Figure 44: Middle East & Africa Image Optimization Tool Revenue (billion), by Application 2025 & 2033
- Figure 45: Middle East & Africa Image Optimization Tool Revenue Share (%), by Application 2025 & 2033
- Figure 46: Middle East & Africa Image Optimization Tool Revenue (billion), by End User 2025 & 2033
- Figure 47: Middle East & Africa Image Optimization Tool Revenue Share (%), by End User 2025 & 2033
- Figure 48: Middle East & Africa Image Optimization Tool Revenue (billion), by Country 2025 & 2033
- Figure 49: Middle East & Africa Image Optimization Tool Revenue Share (%), by Country 2025 & 2033
- Figure 50: Asia Pacific Image Optimization Tool Revenue (billion), by Deployment Mode 2025 & 2033
- Figure 51: Asia Pacific Image Optimization Tool Revenue Share (%), by Deployment Mode 2025 & 2033
- Figure 52: Asia Pacific Image Optimization Tool Revenue (billion), by Pricing Model 2025 & 2033
- Figure 53: Asia Pacific Image Optimization Tool Revenue Share (%), by Pricing Model 2025 & 2033
- Figure 54: Asia Pacific Image Optimization Tool Revenue (billion), by Organization Size 2025 & 2033
- Figure 55: Asia Pacific Image Optimization Tool Revenue Share (%), by Organization Size 2025 & 2033
- Figure 56: Asia Pacific Image Optimization Tool Revenue (billion), by Application 2025 & 2033
- Figure 57: Asia Pacific Image Optimization Tool Revenue Share (%), by Application 2025 & 2033
- Figure 58: Asia Pacific Image Optimization Tool Revenue (billion), by End User 2025 & 2033
- Figure 59: Asia Pacific Image Optimization Tool Revenue Share (%), by End User 2025 & 2033
- Figure 60: Asia Pacific Image Optimization Tool Revenue (billion), by Country 2025 & 2033
- Figure 61: Asia Pacific Image Optimization Tool Revenue Share (%), by Country 2025 & 2033
List of Tables
- Table 1: Global Image Optimization Tool Revenue billion Forecast, by Deployment Mode 2020 & 2033
- Table 2: Global Image Optimization Tool Revenue billion Forecast, by Pricing Model 2020 & 2033
- Table 3: Global Image Optimization Tool Revenue billion Forecast, by Organization Size 2020 & 2033
- Table 4: Global Image Optimization Tool Revenue billion Forecast, by Application 2020 & 2033
- Table 5: Global Image Optimization Tool Revenue billion Forecast, by End User 2020 & 2033
- Table 6: Global Image Optimization Tool Revenue billion Forecast, by Region 2020 & 2033
- Table 7: Global Image Optimization Tool Revenue billion Forecast, by Deployment Mode 2020 & 2033
- Table 8: Global Image Optimization Tool Revenue billion Forecast, by Pricing Model 2020 & 2033
- Table 9: Global Image Optimization Tool Revenue billion Forecast, by Organization Size 2020 & 2033
- Table 10: Global Image Optimization Tool Revenue billion Forecast, by Application 2020 & 2033
- Table 11: Global Image Optimization Tool Revenue billion Forecast, by End User 2020 & 2033
- Table 12: Global Image Optimization Tool Revenue billion Forecast, by Country 2020 & 2033
- Table 13: United States Image Optimization Tool Revenue (billion) Forecast, by Application 2020 & 2033
- Table 14: Canada Image Optimization Tool Revenue (billion) Forecast, by Application 2020 & 2033
- Table 15: Mexico Image Optimization Tool Revenue (billion) Forecast, by Application 2020 & 2033
- Table 16: Global Image Optimization Tool Revenue billion Forecast, by Deployment Mode 2020 & 2033
- Table 17: Global Image Optimization Tool Revenue billion Forecast, by Pricing Model 2020 & 2033
- Table 18: Global Image Optimization Tool Revenue billion Forecast, by Organization Size 2020 & 2033
- Table 19: Global Image Optimization Tool Revenue billion Forecast, by Application 2020 & 2033
- Table 20: Global Image Optimization Tool Revenue billion Forecast, by End User 2020 & 2033
- Table 21: Global Image Optimization Tool Revenue billion Forecast, by Country 2020 & 2033
- Table 22: Brazil Image Optimization Tool Revenue (billion) Forecast, by Application 2020 & 2033
- Table 23: Argentina Image Optimization Tool Revenue (billion) Forecast, by Application 2020 & 2033
- Table 24: Rest of South America Image Optimization Tool Revenue (billion) Forecast, by Application 2020 & 2033
- Table 25: Global Image Optimization Tool Revenue billion Forecast, by Deployment Mode 2020 & 2033
- Table 26: Global Image Optimization Tool Revenue billion Forecast, by Pricing Model 2020 & 2033
- Table 27: Global Image Optimization Tool Revenue billion Forecast, by Organization Size 2020 & 2033
- Table 28: Global Image Optimization Tool Revenue billion Forecast, by Application 2020 & 2033
- Table 29: Global Image Optimization Tool Revenue billion Forecast, by End User 2020 & 2033
- Table 30: Global Image Optimization Tool Revenue billion Forecast, by Country 2020 & 2033
- Table 31: United Kingdom Image Optimization Tool Revenue (billion) Forecast, by Application 2020 & 2033
- Table 32: Germany Image Optimization Tool Revenue (billion) Forecast, by Application 2020 & 2033
- Table 33: France Image Optimization Tool Revenue (billion) Forecast, by Application 2020 & 2033
- Table 34: Italy Image Optimization Tool Revenue (billion) Forecast, by Application 2020 & 2033
- Table 35: Spain Image Optimization Tool Revenue (billion) Forecast, by Application 2020 & 2033
- Table 36: Russia Image Optimization Tool Revenue (billion) Forecast, by Application 2020 & 2033
- Table 37: Benelux Image Optimization Tool Revenue (billion) Forecast, by Application 2020 & 2033
- Table 38: Nordics Image Optimization Tool Revenue (billion) Forecast, by Application 2020 & 2033
- Table 39: Rest of Europe Image Optimization Tool Revenue (billion) Forecast, by Application 2020 & 2033
- Table 40: Global Image Optimization Tool Revenue billion Forecast, by Deployment Mode 2020 & 2033
- Table 41: Global Image Optimization Tool Revenue billion Forecast, by Pricing Model 2020 & 2033
- Table 42: Global Image Optimization Tool Revenue billion Forecast, by Organization Size 2020 & 2033
- Table 43: Global Image Optimization Tool Revenue billion Forecast, by Application 2020 & 2033
- Table 44: Global Image Optimization Tool Revenue billion Forecast, by End User 2020 & 2033
- Table 45: Global Image Optimization Tool Revenue billion Forecast, by Country 2020 & 2033
- Table 46: Turkey Image Optimization Tool Revenue (billion) Forecast, by Application 2020 & 2033
- Table 47: Israel Image Optimization Tool Revenue (billion) Forecast, by Application 2020 & 2033
- Table 48: GCC Image Optimization Tool Revenue (billion) Forecast, by Application 2020 & 2033
- Table 49: North Africa Image Optimization Tool Revenue (billion) Forecast, by Application 2020 & 2033
- Table 50: South Africa Image Optimization Tool Revenue (billion) Forecast, by Application 2020 & 2033
- Table 51: Rest of Middle East & Africa Image Optimization Tool Revenue (billion) Forecast, by Application 2020 & 2033
- Table 52: Global Image Optimization Tool Revenue billion Forecast, by Deployment Mode 2020 & 2033
- Table 53: Global Image Optimization Tool Revenue billion Forecast, by Pricing Model 2020 & 2033
- Table 54: Global Image Optimization Tool Revenue billion Forecast, by Organization Size 2020 & 2033
- Table 55: Global Image Optimization Tool Revenue billion Forecast, by Application 2020 & 2033
- Table 56: Global Image Optimization Tool Revenue billion Forecast, by End User 2020 & 2033
- Table 57: Global Image Optimization Tool Revenue billion Forecast, by Country 2020 & 2033
- Table 58: China Image Optimization Tool Revenue (billion) Forecast, by Application 2020 & 2033
- Table 59: India Image Optimization Tool Revenue (billion) Forecast, by Application 2020 & 2033
- Table 60: Japan Image Optimization Tool Revenue (billion) Forecast, by Application 2020 & 2033
- Table 61: South Korea Image Optimization Tool Revenue (billion) Forecast, by Application 2020 & 2033
- Table 62: ASEAN Image Optimization Tool Revenue (billion) Forecast, by Application 2020 & 2033
- Table 63: Oceania Image Optimization Tool Revenue (billion) Forecast, by Application 2020 & 2033
- Table 64: Rest of Asia Pacific Image Optimization Tool Revenue (billion) Forecast, by Application 2020 & 2033
Frequently Asked Questions
1. What is the projected Compound Annual Growth Rate (CAGR) of the Image Optimization Tool?
The projected CAGR is approximately 11.28%.
2. Which companies are prominent players in the Image Optimization Tool?
Key companies in the market include Cloudinary, Cloudflare, Imgix, ImageKit.io, TinyPNG (Voormedia), ShortPixel, Kraken.io, Optimole, Adobe, Akamai, Sirv, Gumlet, Uploadcare, Fastly Image Optimizer, ImageEngine, Others.
3. What are the main segments of the Image Optimization Tool?
The market segments include Deployment Mode, Pricing Model, Organization Size, Application, End User.
4. Can you provide details about the market size?
The market size is estimated to be USD 9.02 billion as of 2022.
5. What are some drivers contributing to market growth?
N/A
6. What are the notable trends driving market growth?
N/A
7. Are there any restraints impacting market growth?
N/A
8. Can you provide examples of recent developments in the market?
N/A
9. What pricing options are available for accessing the report?
Pricing options include single-user, multi-user, and enterprise licenses priced at USD 4900.00, USD 7350.00, and USD 9800.00 respectively.
10. Is the market size provided in terms of value or volume?
The market size is provided in terms of value, measured in billion.
11. Are there any specific market keywords associated with the report?
Yes, the market keyword associated with the report is "Image Optimization Tool," which aids in identifying and referencing the specific market segment covered.
12. How do I determine which pricing option suits my needs best?
The pricing options vary based on user requirements and access needs. Individual users may opt for single-user licenses, while businesses requiring broader access may choose multi-user or enterprise licenses for cost-effective access to the report.
13. Are there any additional resources or data provided in the Image Optimization Tool report?
While the report offers comprehensive insights, it's advisable to review the specific contents or supplementary materials provided to ascertain if additional resources or data are available.
14. How can I stay updated on further developments or reports in the Image Optimization Tool?
To stay informed about further developments, trends, and reports in the Image Optimization Tool, consider subscribing to industry newsletters, following relevant companies and organizations, or regularly checking reputable industry news sources and publications.
Methodology
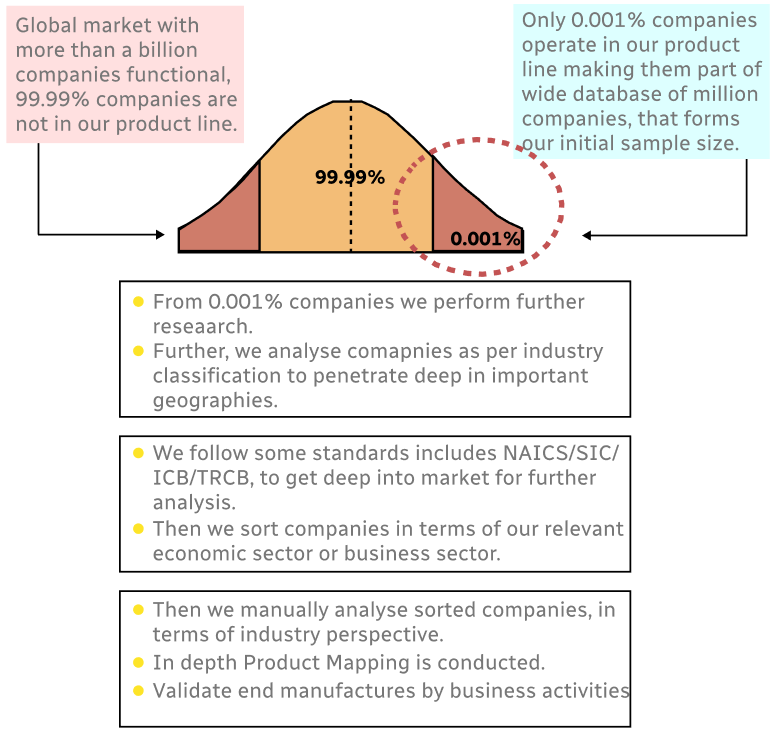
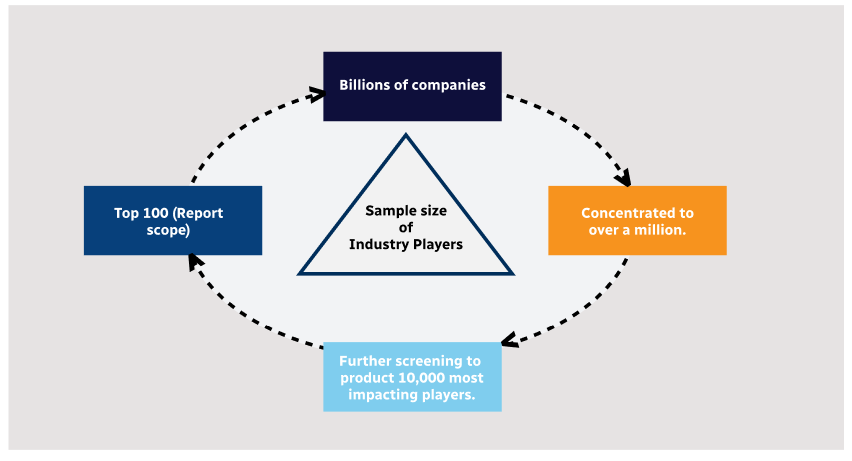
Step 1 - Identification of Relevant Samples Size from Population Database
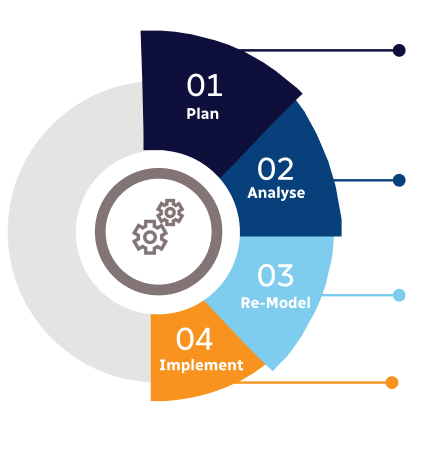
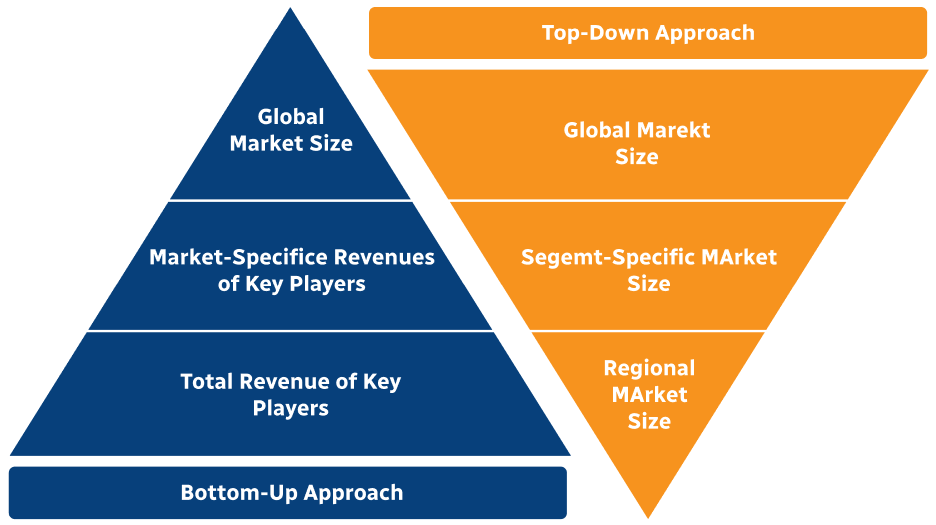
Step 2 - Approaches for Defining Global Market Size (Value, Volume* & Price*)
Note*: In applicable scenarios
Step 3 - Data Sources
Primary Research
- Web Analytics
- Survey Reports
- Research Institute
- Latest Research Reports
- Opinion Leaders
Secondary Research
- Annual Reports
- White Paper
- Latest Press Release
- Industry Association
- Paid Database
- Investor Presentations
Step 4 - Data Triangulation
Involves using different sources of information in order to increase the validity of a study
These sources are likely to be stakeholders in a program - participants, other researchers, program staff, other community members, and so on.
Then we put all data in single framework & apply various statistical tools to find out the dynamic on the market.
During the analysis stage, feedback from the stakeholder groups would be compared to determine areas of agreement as well as areas of divergence