

Key Insights
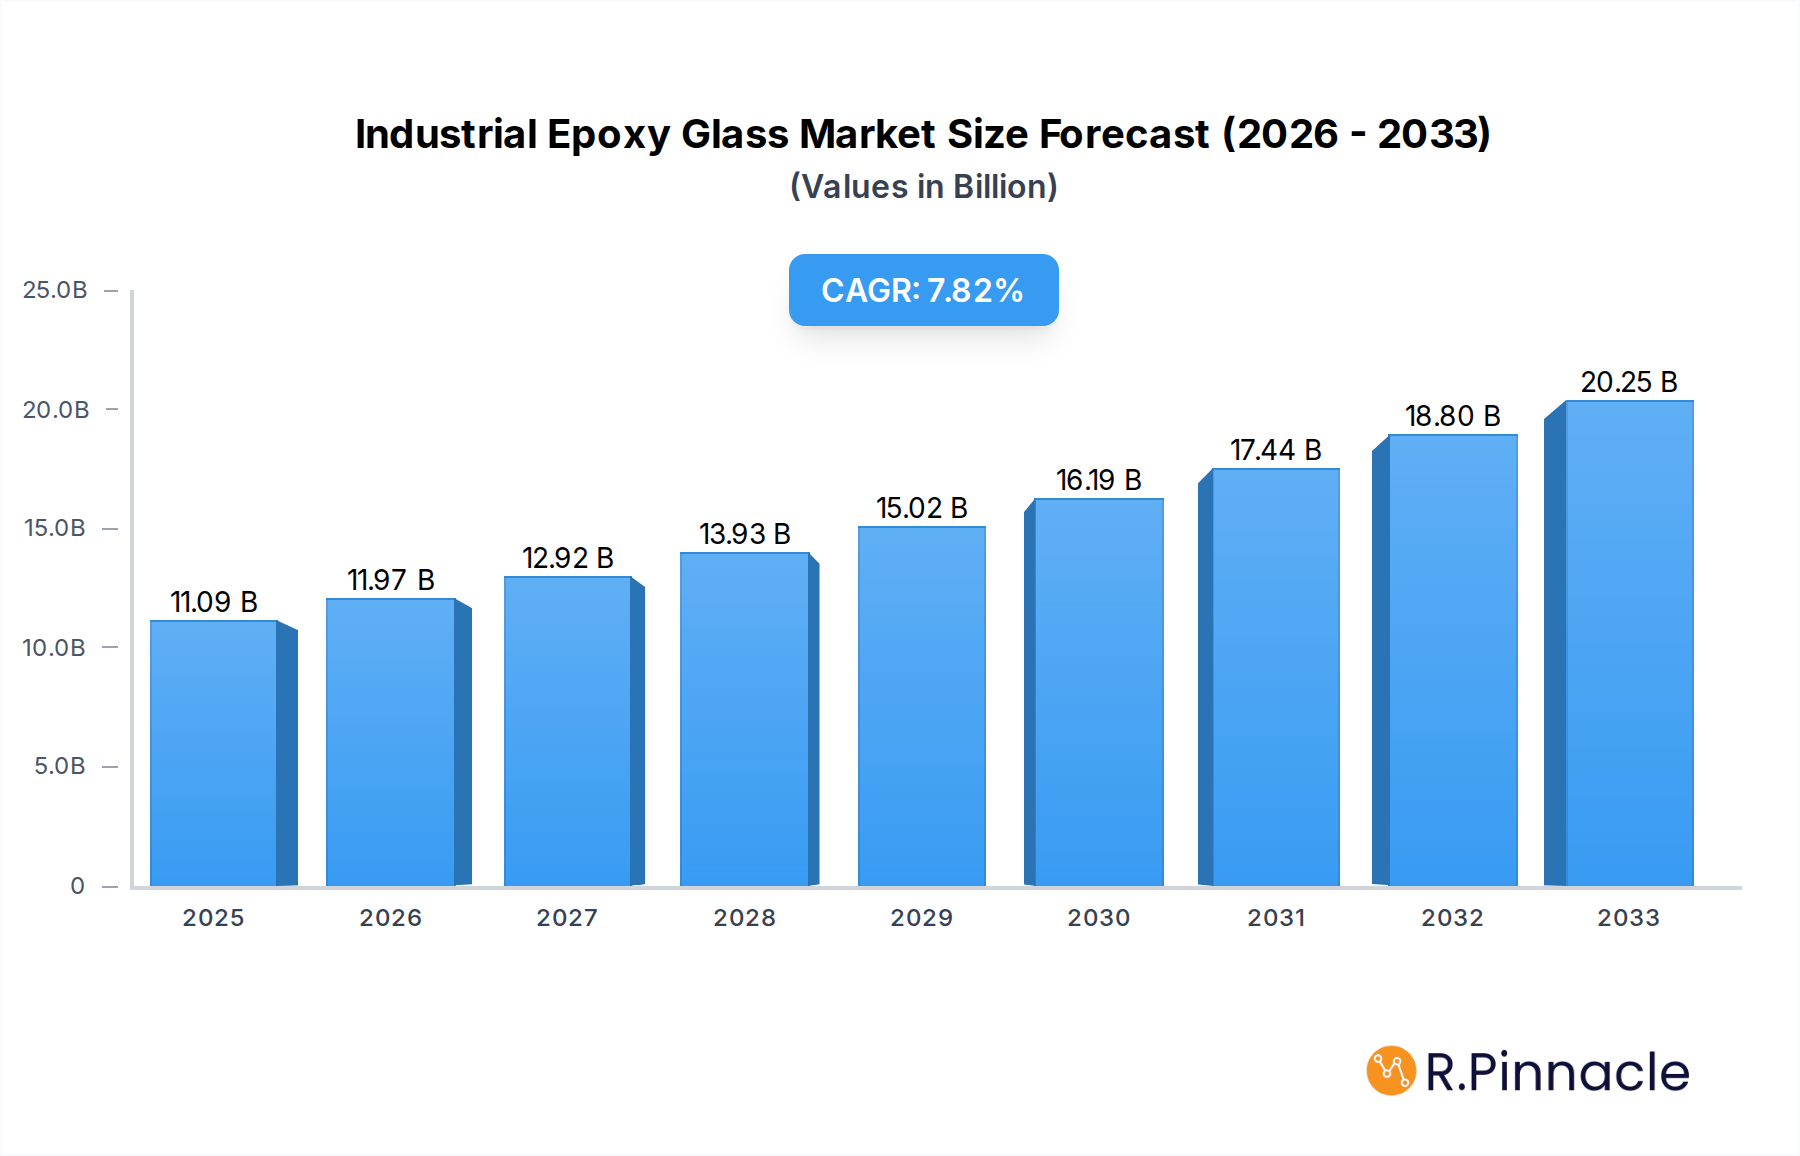
The Industrial Epoxy Glass market is poised for significant expansion, projecting a market size of $11.09 billion in 2025. This growth is propelled by a robust Compound Annual Growth Rate (CAGR) of 8.09% during the forecast period. The market's buoyancy is attributed to key drivers such as the increasing demand for lightweight and high-strength materials across diverse industrial sectors. The superior mechanical properties, excellent electrical insulation, and chemical resistance of industrial epoxy glass composites make them indispensable in demanding applications. Innovations in manufacturing processes and the development of advanced epoxy resin formulations are further fueling this upward trajectory.

Industrial Epoxy Glass Market Size (In Billion)
The market is segmented by application and type, with Mechanical Engineering, Automotive, and Aeronautics emerging as prominent application segments due to the stringent performance requirements in these industries. The automotive sector, in particular, is witnessing a surge in the adoption of composite materials to improve fuel efficiency and vehicle performance. On the type front, various sizes including 3mm, 5mm, 8mm, 10mm, and 12mm cater to a wide spectrum of engineering needs. While growth is strong, potential restraints such as the initial cost of raw materials and complex manufacturing processes could present challenges. However, the continuous technological advancements and increasing awareness of the long-term benefits are expected to mitigate these concerns, paving the way for sustained market dominance.
Industrial Epoxy Glass Company Market Share
Industrial Epoxy Glass Market: Comprehensive Analysis and Future Projections (2019–2033)
Gain unparalleled insights into the global industrial epoxy glass market with this in-depth report. Covering the study period of 2019–2033, with a base and estimated year of 2025 and a forecast period from 2025–2033, this analysis provides a definitive roadmap for stakeholders. Explore market structure, dynamics, regional dominance, product innovations, and key growth drivers. Discover opportunities and challenges shaping the future of industrial epoxy glass, featuring analysis of companies like Toray Industries, INC., Teijin Limited, Hexcel Corporation, SGL Group, Sumitomo, ATL Composites, Rotec Composite Group B.V., Mitsubishi Rayon Co. Ltd., Gurit Holdings AG, Park Electrochemical Corporation, Reliance Industries, Axiom Materials, Myko Engineering, Cytec Solvay Group, Royal Ten Cate N.V., Barrday, Hindoostan Composite Solutions, IDI Composites, Isosport, and Gordon Composites, Inc. This report is essential for professionals in Mechanical Engineering, Automotive, Aeronautics, Marine, Oil And Gas, Chemical Industrial, Medical, and Electrical sectors seeking to capitalize on market advancements in 3mm, 5mm, 8mm, 10mm, and 12mm applications.
Industrial Epoxy Glass Market Structure & Innovation Trends
The global industrial epoxy glass market exhibits a moderately consolidated structure, with leading players like Toray Industries, INC., Teijin Limited, and Hexcel Corporation holding significant market shares estimated in the billions of dollars. Innovation is primarily driven by advancements in resin formulations and fiber weaving technologies, aiming to enhance mechanical strength, thermal resistance, and chemical inertness. Regulatory frameworks, particularly those concerning environmental sustainability and product safety in sectors like Oil & Gas and Chemical Industrial, are increasingly influencing product development and market entry. The threat of product substitutes, such as other composite materials and high-performance polymers, is moderate, necessitating continuous innovation. End-user demographics are diverse, spanning large industrial corporations to specialized manufacturers. Mergers and acquisitions (M&A) activities are sporadic but significant, with deal values potentially reaching billions, aiming to consolidate market presence and acquire cutting-edge technologies. For instance, the acquisition of Cytec Solvay Group by Solvay in 2015, valued at approximately $5.5 billion, highlights strategic consolidation in the advanced materials sector.
Industrial Epoxy Glass Market Dynamics & Trends
The industrial epoxy glass market is poised for robust growth, projected to expand at a Compound Annual Growth Rate (CAGR) of approximately 6.5% over the forecast period. This expansion is fueled by an escalating demand for lightweight, high-strength, and durable materials across a multitude of industries. The automotive sector, driven by the push for fuel efficiency and electric vehicle integration, is a significant growth driver, demanding sophisticated epoxy glass composites for structural components and battery enclosures, representing a market penetration of over 20%. Similarly, the aerospace industry's continuous pursuit of lighter aircraft to reduce fuel consumption and operational costs propels the demand for advanced epoxy glass prepregs. The burgeoning renewable energy sector, particularly wind turbine blade manufacturing, also represents a substantial and growing application area, contributing billions to market revenue. Technological disruptions, such as the development of novel curing agents and advanced manufacturing techniques like automated fiber placement, are enhancing production efficiency and product performance. Furthermore, evolving consumer preferences for sustainable and high-performance products are indirectly influencing the adoption of epoxy glass composites due to their longevity and recyclability potential in certain applications. The competitive landscape is characterized by strategic partnerships and R&D investments aimed at developing next-generation materials with superior properties, such as enhanced fire retardancy and UV resistance. The market penetration of specialized epoxy glass solutions in the Medical and Electrical segments, while smaller, is experiencing rapid growth due to the unique insulating and biocompatible properties offered.
Dominant Regions & Segments in Industrial Epoxy Glass
North America currently leads the industrial epoxy glass market, with an estimated market size in the tens of billions of dollars, driven by its advanced manufacturing base in the Automotive, Aeronautics, and Oil & Gas sectors. The United States, a key player in this region, benefits from significant government investment in infrastructure and aerospace R&D, along with stringent regulations promoting the use of high-performance materials. For example, Federal Aviation Administration (FAA) regulations incentivize the use of lightweight composite materials in aircraft to improve fuel efficiency.
In terms of application segments, Mechanical Engineering and Automotive are the dominant segments, collectively accounting for over 40% of the global market share, with market values in the billions. The increasing complexity of automotive designs and the growing adoption of advanced manufacturing techniques in mechanical engineering applications are key drivers. The Automotive sector, in particular, is witnessing a surge in demand for epoxy glass composites for body panels, chassis components, and interior parts, driven by the imperative for weight reduction and enhanced safety.
Within the types segmentation, the 8mm and 10mm variants of industrial epoxy glass are experiencing the highest demand, reflecting their versatility across a broad spectrum of structural applications. These thicknesses offer an optimal balance of strength, rigidity, and ease of processing, making them ideal for applications ranging from industrial machinery components to automotive structural elements. The market for these thicker grades is valued in the billions.
The Aeronautics sector, while a smaller segment by volume, commands premium pricing due to its stringent performance requirements and the high value of aircraft components. The demand here is for specialized, high-performance epoxy glass composites meeting rigorous aerospace standards, contributing billions to the market. The Marine and Oil & Gas industries also represent significant markets, driven by the need for corrosion-resistant and durable materials in harsh environments.
Industrial Epoxy Glass Product Innovations
Recent product innovations in industrial epoxy glass focus on enhancing thermal stability, chemical resistance, and mechanical performance. Developments include the introduction of novel resin systems with improved high-temperature capabilities for demanding applications in the Oil & Gas and Chemical Industrial sectors. Advanced fiber architectures and surface treatments are yielding composites with superior interlaminar strength and fatigue resistance, critical for the Aeronautics and Automotive industries. These innovations offer competitive advantages by enabling lighter, stronger, and more durable end-products.
Report Scope & Segmentation Analysis
This report meticulously segments the industrial epoxy glass market across key applications and types. In the Application segment, Mechanical Engineering and Automotive are projected to dominate, with market sizes in the billions, driven by advancements in manufacturing and vehicle lightweighting initiatives respectively. Aeronautics, while niche, offers high-value opportunities due to stringent performance demands. Marine and Oil & Gas sectors are characterized by substantial demand for corrosion-resistant materials. The Electrical segment showcases steady growth driven by insulation requirements, while the Chemical Industrial sector benefits from material inertness. In the Types segment, 8mm and 10mm epoxy glass are expected to maintain their leading positions, valued in billions, due to their widespread utility. The 3mm, 5mm, and 12mm segments cater to specialized requirements, exhibiting consistent growth trajectories as well.
Key Drivers of Industrial Epoxy Glass Growth
Several factors are propelling the growth of the industrial epoxy glass market. Firstly, the relentless pursuit of lightweighting across industries like Automotive and Aeronautics to enhance fuel efficiency and reduce emissions is a primary driver. Secondly, the increasing demand for durable and corrosion-resistant materials in challenging environments, such as those found in the Oil & Gas and Marine sectors, plays a crucial role. Technological advancements in composite manufacturing and resin formulations are enabling the creation of higher-performance materials. Furthermore, government initiatives and regulations promoting sustainable manufacturing practices and material efficiency indirectly boost the adoption of epoxy glass composites.
Challenges in the Industrial Epoxy Glass Sector
Despite its promising growth, the industrial epoxy glass sector faces several challenges. High raw material costs, particularly for specialized glass fibers and epoxy resins, can impact profitability and market accessibility for smaller players, leading to market share fluctuations. Stringent regulatory compliance, especially for applications in sensitive sectors like Medical and Electrical, adds to development costs and time-to-market. The competitive landscape is intense, with existing players and emerging material technologies constantly vying for market share, potentially leading to price pressures. Supply chain disruptions and the need for specialized manufacturing infrastructure also pose significant hurdles.
Emerging Opportunities in Industrial Epoxy Glass
The industrial epoxy glass market presents numerous emerging opportunities. The rapid growth of electric vehicles (EVs) is creating a substantial demand for lightweight structural components and battery containment systems, a market estimated in the billions. The increasing adoption of composite materials in the renewable energy sector, particularly for wind turbine blades and solar panel structures, offers significant growth potential. Furthermore, advancements in 3D printing and additive manufacturing are opening new avenues for producing complex epoxy glass components with tailored properties. The growing emphasis on lightweighting in construction and infrastructure projects also represents a nascent but promising market.
Leading Players in the Industrial Epoxy Glass Market
- Toray Industries, INC.
- Teijin Limited
- Hexcel Corporation
- SGL Group
- Sumitomo
- ATL Composites
- Rotec Composite Group B.V.
- Mitsubishi Rayon Co. Ltd.
- Gurit Holdings AG
- Park Electrochemical Corporation
- Reliance Industries
- Axiom Materials
- Myko Engineering
- Cytec Solvay Group
- Royal Ten Cate N.V.
- Barrday
- Hindoostan Composite Solutions
- IDI Composites
- Isosport
- Gordon Composites, Inc.
Key Developments in Industrial Epoxy Glass Industry
- 2024: Launch of new high-temperature resistant epoxy resin systems by major chemical manufacturers, targeting aerospace and automotive applications.
- 2023: Several M&A activities focused on acquiring specialized composite manufacturing capabilities and expanding market reach in the Oil & Gas sector.
- 2023: Introduction of advanced fiber weaving techniques enhancing the mechanical properties of glass fabrics for industrial epoxy composites.
- 2022: Increased R&D investments in sustainable epoxy resin formulations, driven by growing environmental regulations and consumer demand.
- 2021: Significant growth in the adoption of epoxy glass composites for wind turbine blade manufacturing, driven by renewable energy targets.
- 2020: Development of novel surface treatments for glass fibers, improving adhesion and overall composite performance in critical applications.
- 2019: Expansion of production capacities for specialized epoxy glass prepregs to meet the growing demands of the automotive industry.
Future Outlook for Industrial Epoxy Glass Market
The future outlook for the industrial epoxy glass market is exceptionally bright, with continued growth anticipated through 2033. Key growth accelerators include the persistent demand for lightweight and high-strength materials across evolving industries such as electric mobility and sustainable infrastructure. Innovations in additive manufacturing and advanced composite technologies will unlock new application possibilities and enhance manufacturing efficiencies, contributing billions in future revenue. Strategic collaborations and further consolidation through M&A are expected to shape the competitive landscape, fostering greater market maturity. The industry's adaptability to technological advancements and its commitment to addressing sustainability concerns position it for sustained expansion and significant market penetration in emerging sectors.
Industrial Epoxy Glass Segmentation
-
1. Application
- 1.1. Mechanical Engineering
- 1.2. Automotive
- 1.3. Aeronautics
- 1.4. Marine
- 1.5. Oil And Gas
- 1.6. Chemical Industrial
- 1.7. Medical
- 1.8. Electrical
-
2. Types
- 2.1. 3Mm
- 2.2. 5Mm
- 2.3. 8Mm
- 2.4. 10Mm
- 2.5. 12Mm
Industrial Epoxy Glass Segmentation By Geography
-
1. North America
- 1.1. United States
- 1.2. Canada
- 1.3. Mexico
-
2. South America
- 2.1. Brazil
- 2.2. Argentina
- 2.3. Rest of South America
-
3. Europe
- 3.1. United Kingdom
- 3.2. Germany
- 3.3. France
- 3.4. Italy
- 3.5. Spain
- 3.6. Russia
- 3.7. Benelux
- 3.8. Nordics
- 3.9. Rest of Europe
-
4. Middle East & Africa
- 4.1. Turkey
- 4.2. Israel
- 4.3. GCC
- 4.4. North Africa
- 4.5. South Africa
- 4.6. Rest of Middle East & Africa
-
5. Asia Pacific
- 5.1. China
- 5.2. India
- 5.3. Japan
- 5.4. South Korea
- 5.5. ASEAN
- 5.6. Oceania
- 5.7. Rest of Asia Pacific
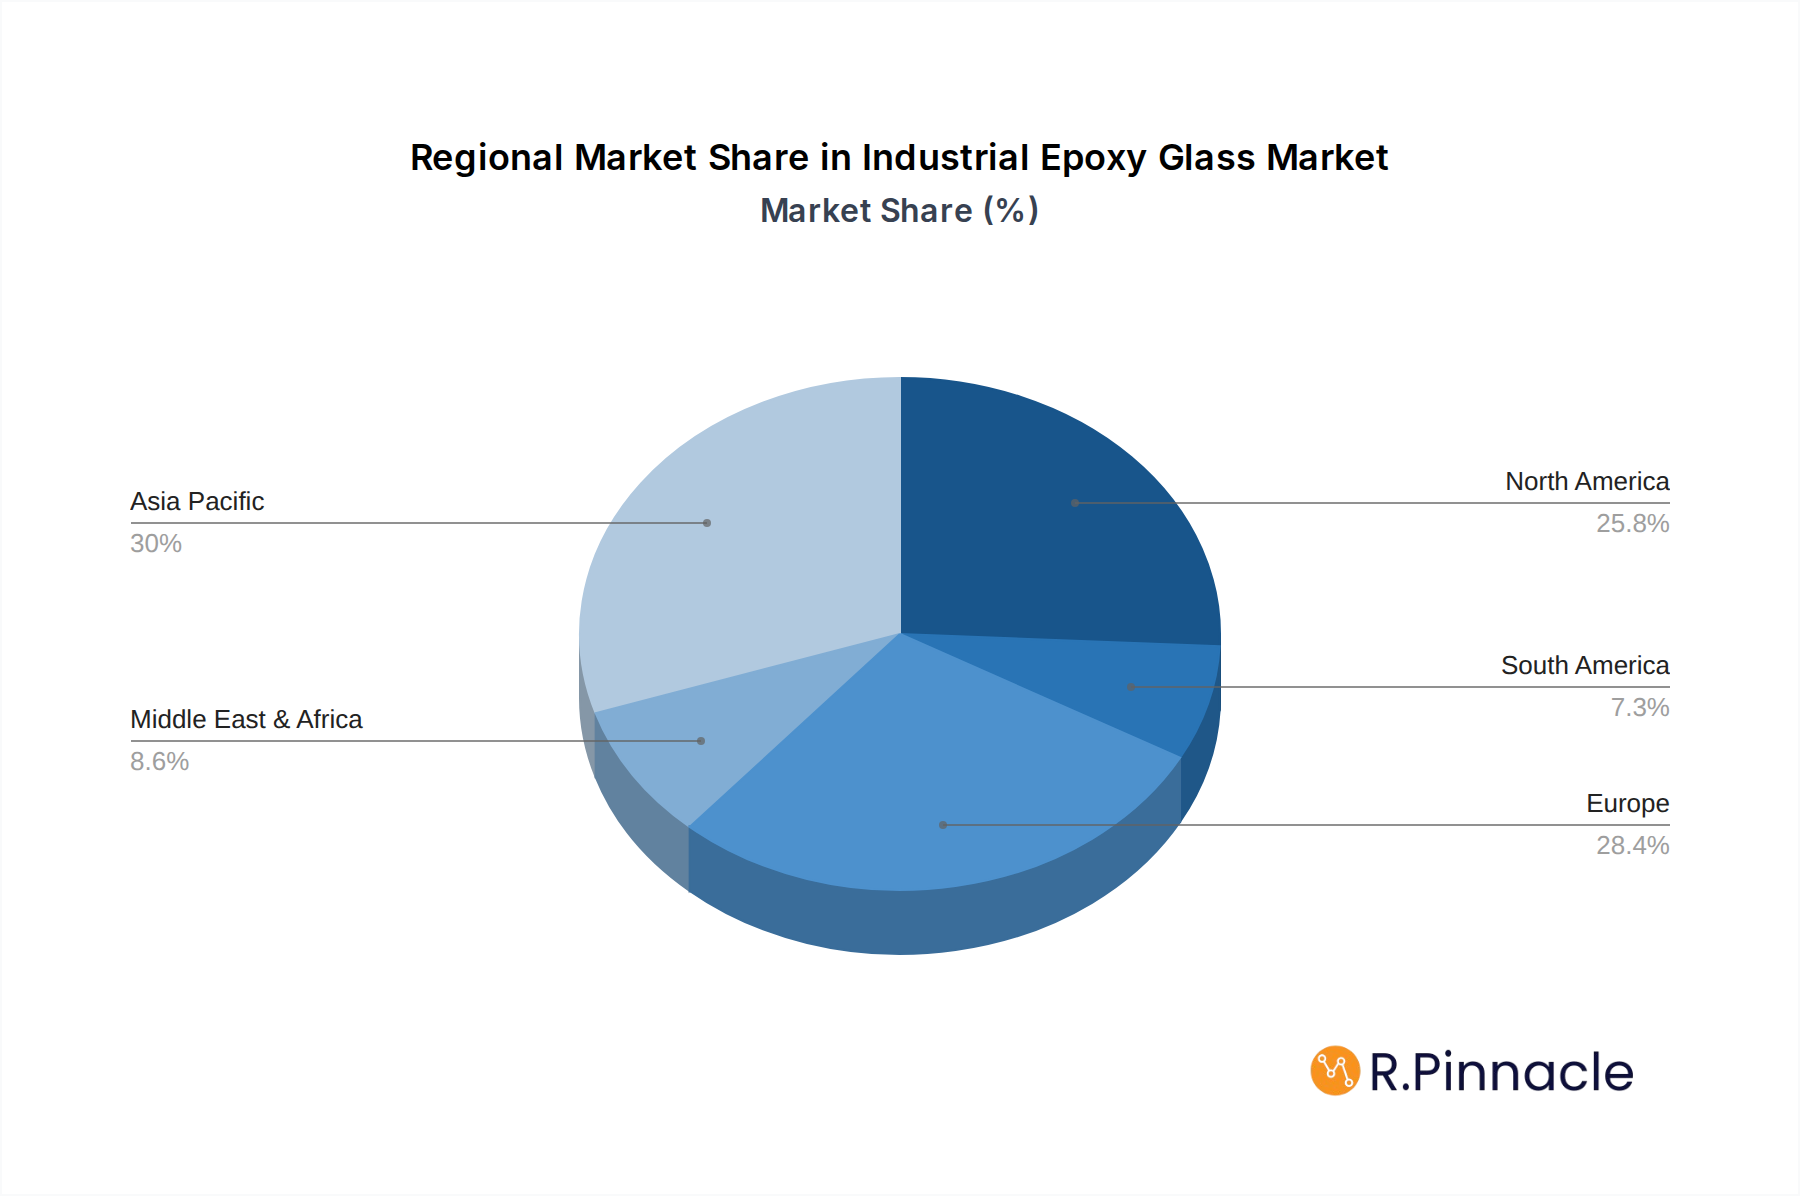
Industrial Epoxy Glass Regional Market Share
Geographic Coverage of Industrial Epoxy Glass
Industrial Epoxy Glass REPORT HIGHLIGHTS
| Aspects | Details |
|---|---|
| Study Period | 2020-2034 |
| Base Year | 2025 |
| Estimated Year | 2026 |
| Forecast Period | 2026-2034 |
| Historical Period | 2020-2025 |
| Growth Rate | CAGR of 8.09% from 2020-2034 |
| Segmentation |
|
Table of Contents
- 1. Introduction
- 1.1. Research Scope
- 1.2. Market Segmentation
- 1.3. Research Methodology
- 1.4. Definitions and Assumptions
- 2. Executive Summary
- 2.1. Introduction
- 3. Market Dynamics
- 3.1. Introduction
- 3.2. Market Drivers
- 3.3. Market Restrains
- 3.4. Market Trends
- 4. Market Factor Analysis
- 4.1. Porters Five Forces
- 4.2. Supply/Value Chain
- 4.3. PESTEL analysis
- 4.4. Market Entropy
- 4.5. Patent/Trademark Analysis
- 5. Global Industrial Epoxy Glass Analysis, Insights and Forecast, 2020-2032
- 5.1. Market Analysis, Insights and Forecast - by Application
- 5.1.1. Mechanical Engineering
- 5.1.2. Automotive
- 5.1.3. Aeronautics
- 5.1.4. Marine
- 5.1.5. Oil And Gas
- 5.1.6. Chemical Industrial
- 5.1.7. Medical
- 5.1.8. Electrical
- 5.2. Market Analysis, Insights and Forecast - by Types
- 5.2.1. 3Mm
- 5.2.2. 5Mm
- 5.2.3. 8Mm
- 5.2.4. 10Mm
- 5.2.5. 12Mm
- 5.3. Market Analysis, Insights and Forecast - by Region
- 5.3.1. North America
- 5.3.2. South America
- 5.3.3. Europe
- 5.3.4. Middle East & Africa
- 5.3.5. Asia Pacific
- 5.1. Market Analysis, Insights and Forecast - by Application
- 6. North America Industrial Epoxy Glass Analysis, Insights and Forecast, 2020-2032
- 6.1. Market Analysis, Insights and Forecast - by Application
- 6.1.1. Mechanical Engineering
- 6.1.2. Automotive
- 6.1.3. Aeronautics
- 6.1.4. Marine
- 6.1.5. Oil And Gas
- 6.1.6. Chemical Industrial
- 6.1.7. Medical
- 6.1.8. Electrical
- 6.2. Market Analysis, Insights and Forecast - by Types
- 6.2.1. 3Mm
- 6.2.2. 5Mm
- 6.2.3. 8Mm
- 6.2.4. 10Mm
- 6.2.5. 12Mm
- 6.1. Market Analysis, Insights and Forecast - by Application
- 7. South America Industrial Epoxy Glass Analysis, Insights and Forecast, 2020-2032
- 7.1. Market Analysis, Insights and Forecast - by Application
- 7.1.1. Mechanical Engineering
- 7.1.2. Automotive
- 7.1.3. Aeronautics
- 7.1.4. Marine
- 7.1.5. Oil And Gas
- 7.1.6. Chemical Industrial
- 7.1.7. Medical
- 7.1.8. Electrical
- 7.2. Market Analysis, Insights and Forecast - by Types
- 7.2.1. 3Mm
- 7.2.2. 5Mm
- 7.2.3. 8Mm
- 7.2.4. 10Mm
- 7.2.5. 12Mm
- 7.1. Market Analysis, Insights and Forecast - by Application
- 8. Europe Industrial Epoxy Glass Analysis, Insights and Forecast, 2020-2032
- 8.1. Market Analysis, Insights and Forecast - by Application
- 8.1.1. Mechanical Engineering
- 8.1.2. Automotive
- 8.1.3. Aeronautics
- 8.1.4. Marine
- 8.1.5. Oil And Gas
- 8.1.6. Chemical Industrial
- 8.1.7. Medical
- 8.1.8. Electrical
- 8.2. Market Analysis, Insights and Forecast - by Types
- 8.2.1. 3Mm
- 8.2.2. 5Mm
- 8.2.3. 8Mm
- 8.2.4. 10Mm
- 8.2.5. 12Mm
- 8.1. Market Analysis, Insights and Forecast - by Application
- 9. Middle East & Africa Industrial Epoxy Glass Analysis, Insights and Forecast, 2020-2032
- 9.1. Market Analysis, Insights and Forecast - by Application
- 9.1.1. Mechanical Engineering
- 9.1.2. Automotive
- 9.1.3. Aeronautics
- 9.1.4. Marine
- 9.1.5. Oil And Gas
- 9.1.6. Chemical Industrial
- 9.1.7. Medical
- 9.1.8. Electrical
- 9.2. Market Analysis, Insights and Forecast - by Types
- 9.2.1. 3Mm
- 9.2.2. 5Mm
- 9.2.3. 8Mm
- 9.2.4. 10Mm
- 9.2.5. 12Mm
- 9.1. Market Analysis, Insights and Forecast - by Application
- 10. Asia Pacific Industrial Epoxy Glass Analysis, Insights and Forecast, 2020-2032
- 10.1. Market Analysis, Insights and Forecast - by Application
- 10.1.1. Mechanical Engineering
- 10.1.2. Automotive
- 10.1.3. Aeronautics
- 10.1.4. Marine
- 10.1.5. Oil And Gas
- 10.1.6. Chemical Industrial
- 10.1.7. Medical
- 10.1.8. Electrical
- 10.2. Market Analysis, Insights and Forecast - by Types
- 10.2.1. 3Mm
- 10.2.2. 5Mm
- 10.2.3. 8Mm
- 10.2.4. 10Mm
- 10.2.5. 12Mm
- 10.1. Market Analysis, Insights and Forecast - by Application
- 11. Competitive Analysis
- 11.1. Global Market Share Analysis 2025
- 11.2. Company Profiles
- 11.2.1 Toray Industries
- 11.2.1.1. Overview
- 11.2.1.2. Products
- 11.2.1.3. SWOT Analysis
- 11.2.1.4. Recent Developments
- 11.2.1.5. Financials (Based on Availability)
- 11.2.2 INC.
- 11.2.2.1. Overview
- 11.2.2.2. Products
- 11.2.2.3. SWOT Analysis
- 11.2.2.4. Recent Developments
- 11.2.2.5. Financials (Based on Availability)
- 11.2.3 Teijin Limited
- 11.2.3.1. Overview
- 11.2.3.2. Products
- 11.2.3.3. SWOT Analysis
- 11.2.3.4. Recent Developments
- 11.2.3.5. Financials (Based on Availability)
- 11.2.4 Hexcel Corporation
- 11.2.4.1. Overview
- 11.2.4.2. Products
- 11.2.4.3. SWOT Analysis
- 11.2.4.4. Recent Developments
- 11.2.4.5. Financials (Based on Availability)
- 11.2.5 SGL Group
- 11.2.5.1. Overview
- 11.2.5.2. Products
- 11.2.5.3. SWOT Analysis
- 11.2.5.4. Recent Developments
- 11.2.5.5. Financials (Based on Availability)
- 11.2.6 Sumitomo
- 11.2.6.1. Overview
- 11.2.6.2. Products
- 11.2.6.3. SWOT Analysis
- 11.2.6.4. Recent Developments
- 11.2.6.5. Financials (Based on Availability)
- 11.2.7 ATL Composites
- 11.2.7.1. Overview
- 11.2.7.2. Products
- 11.2.7.3. SWOT Analysis
- 11.2.7.4. Recent Developments
- 11.2.7.5. Financials (Based on Availability)
- 11.2.8 Rotec Composite Group B.V.
- 11.2.8.1. Overview
- 11.2.8.2. Products
- 11.2.8.3. SWOT Analysis
- 11.2.8.4. Recent Developments
- 11.2.8.5. Financials (Based on Availability)
- 11.2.9 Mitsubishi Rayon Co. Ltd.
- 11.2.9.1. Overview
- 11.2.9.2. Products
- 11.2.9.3. SWOT Analysis
- 11.2.9.4. Recent Developments
- 11.2.9.5. Financials (Based on Availability)
- 11.2.10 Gurit Holdings AG
- 11.2.10.1. Overview
- 11.2.10.2. Products
- 11.2.10.3. SWOT Analysis
- 11.2.10.4. Recent Developments
- 11.2.10.5. Financials (Based on Availability)
- 11.2.11 Park Electrochemical Corporation
- 11.2.11.1. Overview
- 11.2.11.2. Products
- 11.2.11.3. SWOT Analysis
- 11.2.11.4. Recent Developments
- 11.2.11.5. Financials (Based on Availability)
- 11.2.12 Reliance Industries
- 11.2.12.1. Overview
- 11.2.12.2. Products
- 11.2.12.3. SWOT Analysis
- 11.2.12.4. Recent Developments
- 11.2.12.5. Financials (Based on Availability)
- 11.2.13 Axiom Materials
- 11.2.13.1. Overview
- 11.2.13.2. Products
- 11.2.13.3. SWOT Analysis
- 11.2.13.4. Recent Developments
- 11.2.13.5. Financials (Based on Availability)
- 11.2.14 Myko Engineering
- 11.2.14.1. Overview
- 11.2.14.2. Products
- 11.2.14.3. SWOT Analysis
- 11.2.14.4. Recent Developments
- 11.2.14.5. Financials (Based on Availability)
- 11.2.15 Cytec Solvay Group
- 11.2.15.1. Overview
- 11.2.15.2. Products
- 11.2.15.3. SWOT Analysis
- 11.2.15.4. Recent Developments
- 11.2.15.5. Financials (Based on Availability)
- 11.2.16 Royal TenCate N.V.
- 11.2.16.1. Overview
- 11.2.16.2. Products
- 11.2.16.3. SWOT Analysis
- 11.2.16.4. Recent Developments
- 11.2.16.5. Financials (Based on Availability)
- 11.2.17 Barrday
- 11.2.17.1. Overview
- 11.2.17.2. Products
- 11.2.17.3. SWOT Analysis
- 11.2.17.4. Recent Developments
- 11.2.17.5. Financials (Based on Availability)
- 11.2.18 Hindoostan Composite Solutions
- 11.2.18.1. Overview
- 11.2.18.2. Products
- 11.2.18.3. SWOT Analysis
- 11.2.18.4. Recent Developments
- 11.2.18.5. Financials (Based on Availability)
- 11.2.19 IDI Composites
- 11.2.19.1. Overview
- 11.2.19.2. Products
- 11.2.19.3. SWOT Analysis
- 11.2.19.4. Recent Developments
- 11.2.19.5. Financials (Based on Availability)
- 11.2.20 Isosport
- 11.2.20.1. Overview
- 11.2.20.2. Products
- 11.2.20.3. SWOT Analysis
- 11.2.20.4. Recent Developments
- 11.2.20.5. Financials (Based on Availability)
- 11.2.21 Gordon Composites
- 11.2.21.1. Overview
- 11.2.21.2. Products
- 11.2.21.3. SWOT Analysis
- 11.2.21.4. Recent Developments
- 11.2.21.5. Financials (Based on Availability)
- 11.2.22 Inc.
- 11.2.22.1. Overview
- 11.2.22.2. Products
- 11.2.22.3. SWOT Analysis
- 11.2.22.4. Recent Developments
- 11.2.22.5. Financials (Based on Availability)
- 11.2.1 Toray Industries
List of Figures
- Figure 1: Global Industrial Epoxy Glass Revenue Breakdown (undefined, %) by Region 2025 & 2033
- Figure 2: North America Industrial Epoxy Glass Revenue (undefined), by Application 2025 & 2033
- Figure 3: North America Industrial Epoxy Glass Revenue Share (%), by Application 2025 & 2033
- Figure 4: North America Industrial Epoxy Glass Revenue (undefined), by Types 2025 & 2033
- Figure 5: North America Industrial Epoxy Glass Revenue Share (%), by Types 2025 & 2033
- Figure 6: North America Industrial Epoxy Glass Revenue (undefined), by Country 2025 & 2033
- Figure 7: North America Industrial Epoxy Glass Revenue Share (%), by Country 2025 & 2033
- Figure 8: South America Industrial Epoxy Glass Revenue (undefined), by Application 2025 & 2033
- Figure 9: South America Industrial Epoxy Glass Revenue Share (%), by Application 2025 & 2033
- Figure 10: South America Industrial Epoxy Glass Revenue (undefined), by Types 2025 & 2033
- Figure 11: South America Industrial Epoxy Glass Revenue Share (%), by Types 2025 & 2033
- Figure 12: South America Industrial Epoxy Glass Revenue (undefined), by Country 2025 & 2033
- Figure 13: South America Industrial Epoxy Glass Revenue Share (%), by Country 2025 & 2033
- Figure 14: Europe Industrial Epoxy Glass Revenue (undefined), by Application 2025 & 2033
- Figure 15: Europe Industrial Epoxy Glass Revenue Share (%), by Application 2025 & 2033
- Figure 16: Europe Industrial Epoxy Glass Revenue (undefined), by Types 2025 & 2033
- Figure 17: Europe Industrial Epoxy Glass Revenue Share (%), by Types 2025 & 2033
- Figure 18: Europe Industrial Epoxy Glass Revenue (undefined), by Country 2025 & 2033
- Figure 19: Europe Industrial Epoxy Glass Revenue Share (%), by Country 2025 & 2033
- Figure 20: Middle East & Africa Industrial Epoxy Glass Revenue (undefined), by Application 2025 & 2033
- Figure 21: Middle East & Africa Industrial Epoxy Glass Revenue Share (%), by Application 2025 & 2033
- Figure 22: Middle East & Africa Industrial Epoxy Glass Revenue (undefined), by Types 2025 & 2033
- Figure 23: Middle East & Africa Industrial Epoxy Glass Revenue Share (%), by Types 2025 & 2033
- Figure 24: Middle East & Africa Industrial Epoxy Glass Revenue (undefined), by Country 2025 & 2033
- Figure 25: Middle East & Africa Industrial Epoxy Glass Revenue Share (%), by Country 2025 & 2033
- Figure 26: Asia Pacific Industrial Epoxy Glass Revenue (undefined), by Application 2025 & 2033
- Figure 27: Asia Pacific Industrial Epoxy Glass Revenue Share (%), by Application 2025 & 2033
- Figure 28: Asia Pacific Industrial Epoxy Glass Revenue (undefined), by Types 2025 & 2033
- Figure 29: Asia Pacific Industrial Epoxy Glass Revenue Share (%), by Types 2025 & 2033
- Figure 30: Asia Pacific Industrial Epoxy Glass Revenue (undefined), by Country 2025 & 2033
- Figure 31: Asia Pacific Industrial Epoxy Glass Revenue Share (%), by Country 2025 & 2033
List of Tables
- Table 1: Global Industrial Epoxy Glass Revenue undefined Forecast, by Application 2020 & 2033
- Table 2: Global Industrial Epoxy Glass Revenue undefined Forecast, by Types 2020 & 2033
- Table 3: Global Industrial Epoxy Glass Revenue undefined Forecast, by Region 2020 & 2033
- Table 4: Global Industrial Epoxy Glass Revenue undefined Forecast, by Application 2020 & 2033
- Table 5: Global Industrial Epoxy Glass Revenue undefined Forecast, by Types 2020 & 2033
- Table 6: Global Industrial Epoxy Glass Revenue undefined Forecast, by Country 2020 & 2033
- Table 7: United States Industrial Epoxy Glass Revenue (undefined) Forecast, by Application 2020 & 2033
- Table 8: Canada Industrial Epoxy Glass Revenue (undefined) Forecast, by Application 2020 & 2033
- Table 9: Mexico Industrial Epoxy Glass Revenue (undefined) Forecast, by Application 2020 & 2033
- Table 10: Global Industrial Epoxy Glass Revenue undefined Forecast, by Application 2020 & 2033
- Table 11: Global Industrial Epoxy Glass Revenue undefined Forecast, by Types 2020 & 2033
- Table 12: Global Industrial Epoxy Glass Revenue undefined Forecast, by Country 2020 & 2033
- Table 13: Brazil Industrial Epoxy Glass Revenue (undefined) Forecast, by Application 2020 & 2033
- Table 14: Argentina Industrial Epoxy Glass Revenue (undefined) Forecast, by Application 2020 & 2033
- Table 15: Rest of South America Industrial Epoxy Glass Revenue (undefined) Forecast, by Application 2020 & 2033
- Table 16: Global Industrial Epoxy Glass Revenue undefined Forecast, by Application 2020 & 2033
- Table 17: Global Industrial Epoxy Glass Revenue undefined Forecast, by Types 2020 & 2033
- Table 18: Global Industrial Epoxy Glass Revenue undefined Forecast, by Country 2020 & 2033
- Table 19: United Kingdom Industrial Epoxy Glass Revenue (undefined) Forecast, by Application 2020 & 2033
- Table 20: Germany Industrial Epoxy Glass Revenue (undefined) Forecast, by Application 2020 & 2033
- Table 21: France Industrial Epoxy Glass Revenue (undefined) Forecast, by Application 2020 & 2033
- Table 22: Italy Industrial Epoxy Glass Revenue (undefined) Forecast, by Application 2020 & 2033
- Table 23: Spain Industrial Epoxy Glass Revenue (undefined) Forecast, by Application 2020 & 2033
- Table 24: Russia Industrial Epoxy Glass Revenue (undefined) Forecast, by Application 2020 & 2033
- Table 25: Benelux Industrial Epoxy Glass Revenue (undefined) Forecast, by Application 2020 & 2033
- Table 26: Nordics Industrial Epoxy Glass Revenue (undefined) Forecast, by Application 2020 & 2033
- Table 27: Rest of Europe Industrial Epoxy Glass Revenue (undefined) Forecast, by Application 2020 & 2033
- Table 28: Global Industrial Epoxy Glass Revenue undefined Forecast, by Application 2020 & 2033
- Table 29: Global Industrial Epoxy Glass Revenue undefined Forecast, by Types 2020 & 2033
- Table 30: Global Industrial Epoxy Glass Revenue undefined Forecast, by Country 2020 & 2033
- Table 31: Turkey Industrial Epoxy Glass Revenue (undefined) Forecast, by Application 2020 & 2033
- Table 32: Israel Industrial Epoxy Glass Revenue (undefined) Forecast, by Application 2020 & 2033
- Table 33: GCC Industrial Epoxy Glass Revenue (undefined) Forecast, by Application 2020 & 2033
- Table 34: North Africa Industrial Epoxy Glass Revenue (undefined) Forecast, by Application 2020 & 2033
- Table 35: South Africa Industrial Epoxy Glass Revenue (undefined) Forecast, by Application 2020 & 2033
- Table 36: Rest of Middle East & Africa Industrial Epoxy Glass Revenue (undefined) Forecast, by Application 2020 & 2033
- Table 37: Global Industrial Epoxy Glass Revenue undefined Forecast, by Application 2020 & 2033
- Table 38: Global Industrial Epoxy Glass Revenue undefined Forecast, by Types 2020 & 2033
- Table 39: Global Industrial Epoxy Glass Revenue undefined Forecast, by Country 2020 & 2033
- Table 40: China Industrial Epoxy Glass Revenue (undefined) Forecast, by Application 2020 & 2033
- Table 41: India Industrial Epoxy Glass Revenue (undefined) Forecast, by Application 2020 & 2033
- Table 42: Japan Industrial Epoxy Glass Revenue (undefined) Forecast, by Application 2020 & 2033
- Table 43: South Korea Industrial Epoxy Glass Revenue (undefined) Forecast, by Application 2020 & 2033
- Table 44: ASEAN Industrial Epoxy Glass Revenue (undefined) Forecast, by Application 2020 & 2033
- Table 45: Oceania Industrial Epoxy Glass Revenue (undefined) Forecast, by Application 2020 & 2033
- Table 46: Rest of Asia Pacific Industrial Epoxy Glass Revenue (undefined) Forecast, by Application 2020 & 2033
Frequently Asked Questions
1. What is the projected Compound Annual Growth Rate (CAGR) of the Industrial Epoxy Glass?
The projected CAGR is approximately 8.09%.
2. Which companies are prominent players in the Industrial Epoxy Glass?
Key companies in the market include Toray Industries, INC., Teijin Limited, Hexcel Corporation, SGL Group, Sumitomo, ATL Composites, Rotec Composite Group B.V., Mitsubishi Rayon Co. Ltd., Gurit Holdings AG, Park Electrochemical Corporation, Reliance Industries, Axiom Materials, Myko Engineering, Cytec Solvay Group, Royal TenCate N.V., Barrday, Hindoostan Composite Solutions, IDI Composites, Isosport, Gordon Composites, Inc..
3. What are the main segments of the Industrial Epoxy Glass?
The market segments include Application, Types.
4. Can you provide details about the market size?
The market size is estimated to be USD XXX N/A as of 2022.
5. What are some drivers contributing to market growth?
N/A
6. What are the notable trends driving market growth?
N/A
7. Are there any restraints impacting market growth?
N/A
8. Can you provide examples of recent developments in the market?
N/A
9. What pricing options are available for accessing the report?
Pricing options include single-user, multi-user, and enterprise licenses priced at USD 4900.00, USD 7350.00, and USD 9800.00 respectively.
10. Is the market size provided in terms of value or volume?
The market size is provided in terms of value, measured in N/A.
11. Are there any specific market keywords associated with the report?
Yes, the market keyword associated with the report is "Industrial Epoxy Glass," which aids in identifying and referencing the specific market segment covered.
12. How do I determine which pricing option suits my needs best?
The pricing options vary based on user requirements and access needs. Individual users may opt for single-user licenses, while businesses requiring broader access may choose multi-user or enterprise licenses for cost-effective access to the report.
13. Are there any additional resources or data provided in the Industrial Epoxy Glass report?
While the report offers comprehensive insights, it's advisable to review the specific contents or supplementary materials provided to ascertain if additional resources or data are available.
14. How can I stay updated on further developments or reports in the Industrial Epoxy Glass?
To stay informed about further developments, trends, and reports in the Industrial Epoxy Glass, consider subscribing to industry newsletters, following relevant companies and organizations, or regularly checking reputable industry news sources and publications.
Methodology
Step 1 - Identification of Relevant Samples Size from Population Database


Step 2 - Approaches for Defining Global Market Size (Value, Volume* & Price*)

Note*: In applicable scenarios
Step 3 - Data Sources
Primary Research
- Web Analytics
- Survey Reports
- Research Institute
- Latest Research Reports
- Opinion Leaders
Secondary Research
- Annual Reports
- White Paper
- Latest Press Release
- Industry Association
- Paid Database
- Investor Presentations

Step 4 - Data Triangulation
Involves using different sources of information in order to increase the validity of a study
These sources are likely to be stakeholders in a program - participants, other researchers, program staff, other community members, and so on.
Then we put all data in single framework & apply various statistical tools to find out the dynamic on the market.
During the analysis stage, feedback from the stakeholder groups would be compared to determine areas of agreement as well as areas of divergence