

Key Insights
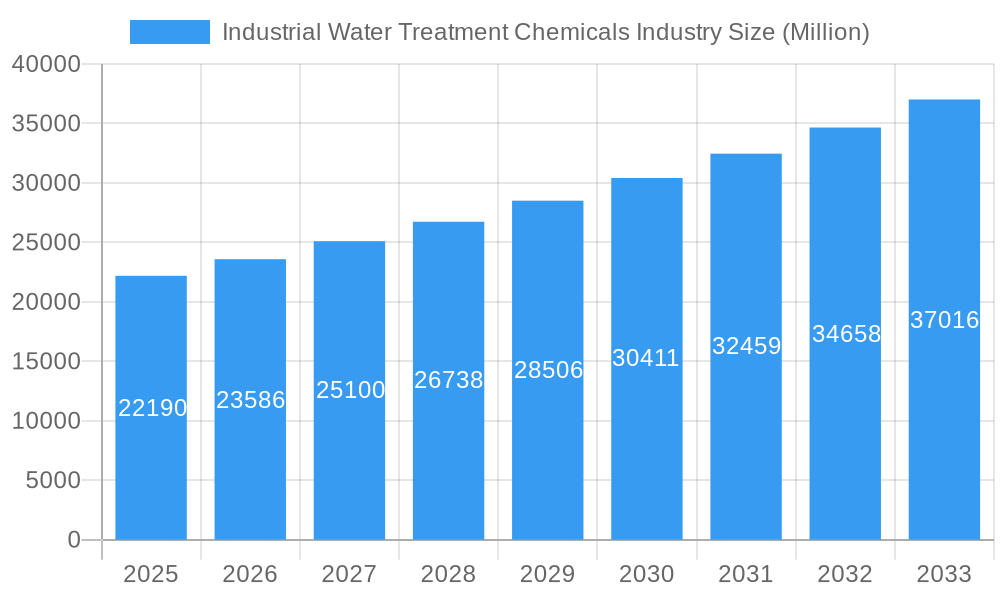
The Industrial Water Treatment Chemicals market is experiencing robust growth, projected to reach \$22.19 billion in 2025 and maintain a Compound Annual Growth Rate (CAGR) of 6.04% from 2025 to 2033. This expansion is driven by several key factors. Stringent environmental regulations globally are pushing industries to adopt advanced water treatment technologies to minimize their environmental footprint. Furthermore, the increasing demand for clean water across various sectors, including power generation, manufacturing, and oil & gas, fuels the need for effective water treatment solutions. Growth in emerging economies, particularly in Asia-Pacific, contributes significantly to market expansion, as these regions undergo rapid industrialization and urbanization, increasing water treatment needs. Technological advancements in water treatment chemicals, such as the development of more efficient and environmentally friendly products, further propel market growth. Key players like BWA Water Additives, Chemifloc Ltd, Kemira, Kurita Water Industries Ltd, Lenntech B.V., Lonza, DuPont de Nemours Inc, Ecolab, SNF, Solenis, and SUEZ are driving innovation and competition within the sector.
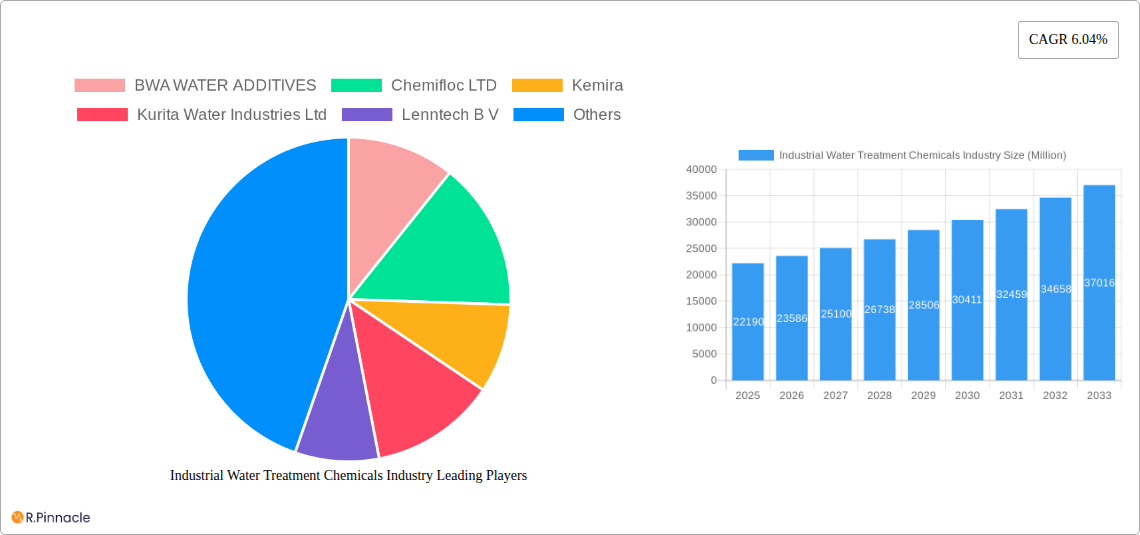
Industrial Water Treatment Chemicals Industry Market Size (In Billion)
The market segmentation, while not explicitly detailed, likely includes various chemical types (coagulants, flocculants, biocides, etc.) and application areas (cooling water treatment, boiler water treatment, wastewater treatment, etc.). Competitive pressures are driving innovation and the development of specialized solutions tailored to specific industry needs. Despite the positive outlook, challenges such as fluctuating raw material prices and the potential for stricter environmental regulations could pose some restraints. However, the long-term outlook remains positive, driven by the continued growth in industrial activity and the increasing importance of sustainable water management practices. Future growth will be influenced by factors such as government policies, technological breakthroughs, and the evolving needs of diverse industrial sectors. Companies are focusing on strategic partnerships, mergers, and acquisitions to expand their market share and product portfolios.
Industrial Water Treatment Chemicals Industry Company Market Share
Industrial Water Treatment Chemicals Market Report: 2019-2033
This comprehensive report provides a detailed analysis of the Industrial Water Treatment Chemicals market, offering invaluable insights for industry professionals, investors, and strategic decision-makers. The study period covers 2019-2033, with 2025 as the base and estimated year. We project robust market growth driven by increasing industrialization, stringent environmental regulations, and technological advancements. The report features in-depth analysis of key players including BWA WATER ADDITIVES, Chemifloc LTD, Kemira, Kurita Water Industries Ltd, Lenntech B V, Lonza, DuPont de Nemours Inc, Ecolab, SNF, Solenis, and SUEZ (list not exhaustive).
Industrial Water Treatment Chemicals Industry Market Structure & Innovation Trends
The Industrial Water Treatment Chemicals Industry is characterized by a moderately concentrated market structure. Key players, while holding significant market share, are increasingly focused on driving innovation through the development of sustainable, eco-friendly, and highly efficient water treatment solutions. This commitment to innovation is fueled by a confluence of factors, including increasingly stringent global environmental regulations, rising demand for cleaner water resources, and the imperative for industrial sectors to minimize their ecological footprint. We delve into the market concentration, detailing the estimated market share held by the top five players, projected to be around XX% in 2025. Furthermore, this analysis explores the primary innovation drivers, such as advancements in biodegradable chemistries, smart water management technologies, and solutions for complex industrial wastewater. The report meticulously examines the prevailing regulatory frameworks that shape industry practices and influence product development. It also assesses the threat of product substitutes and analyzes the diverse end-user demographics across critical sectors like power generation, manufacturing, oil and gas, and food and beverage. A comprehensive overview of mergers and acquisitions (M&A) activities is presented, illuminating deal values and their profound impact on market dynamics. For instance, the strategic acquisition of Diversey by Solenis, valued at XX Million USD, has significantly reshaped the competitive landscape, enhancing scale and broadening product portfolios. Key M&A activities witnessed during the historical period (2019-2024) totaled XX Million USD in deal value, a clear indicator of the industry's drive towards consolidation and accelerated innovation.
Industrial Water Treatment Chemicals Industry Market Dynamics & Trends
This section delves into the key drivers shaping market growth, including rising industrial water demand, escalating concerns about water scarcity, and the growing adoption of advanced water treatment technologies. We analyze technological disruptions, such as the increasing use of AI and IoT in water treatment systems. Consumer preferences for sustainable and environmentally friendly solutions are also explored, along with an in-depth analysis of competitive dynamics, including pricing strategies, product differentiation, and market penetration rates. The market is projected to experience a CAGR of xx% during the forecast period (2025-2033), reaching a market value of xx Million by 2033. Market penetration of advanced treatment technologies is expected to increase from xx% in 2025 to xx% by 2033.
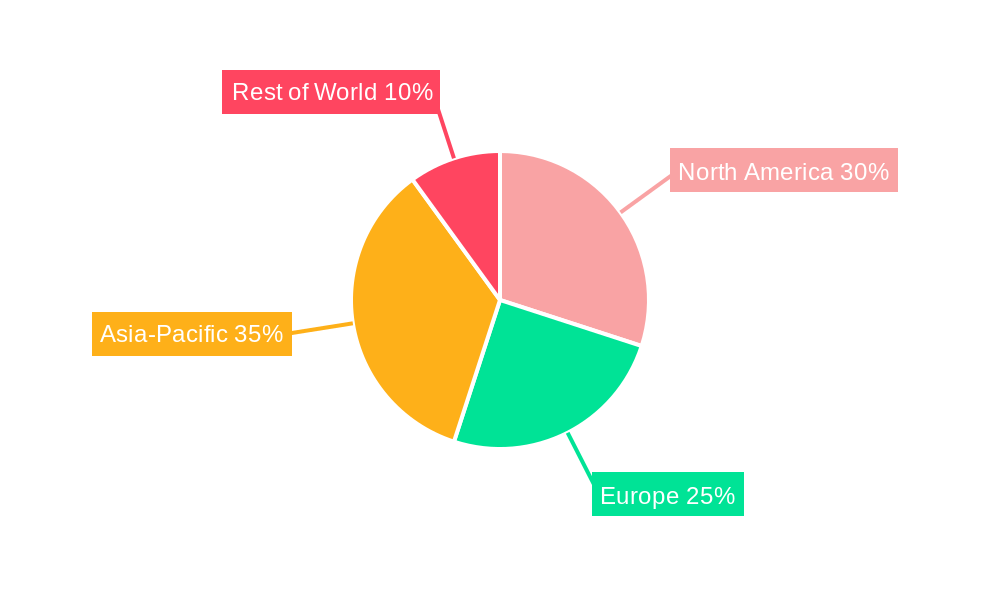
Dominant Regions & Segments in Industrial Water Treatment Chemicals Industry
This section identifies the leading regions and segments within the industrial water treatment chemicals market. We analyze key factors driving growth in these dominant areas.
- Key Drivers:
- Stringent environmental regulations
- Rapid industrialization
- Government initiatives promoting water conservation
- Growth of specific end-use industries (e.g., power generation, manufacturing)
Dominance analysis reveals that the [Region Name] region currently holds the largest market share, driven by factors such as robust industrial growth, favorable government policies, and a large concentration of key industrial users. The [Segment Name] segment demonstrates the highest growth potential due to its [reason for high growth potential].
Industrial Water Treatment Chemicals Industry Product Innovations
Recent product developments focus on environmentally friendly and high-efficiency solutions. These innovations include advanced coagulants, flocculants, and biocides, designed to improve water quality while minimizing environmental impact. The market is seeing a growing adoption of advanced oxidation processes and membrane filtration technologies. These innovations offer superior performance, cost-effectiveness, and reduced environmental footprint, which contribute to their strong market fit.
Report Scope & Segmentation Analysis
This comprehensive report segments the Industrial Water Treatment Chemicals Market across several critical dimensions to provide a granular understanding of its dynamics. The segmentation includes: Chemical Type (e.g., coagulants, flocculants, biocides, scale inhibitors, corrosion inhibitors, pH adjusters), Application (e.g., power generation, manufacturing - including automotive, textiles, and electronics, oil and gas, food and beverage, pharmaceuticals, municipal water treatment), and Geography (North America, Europe, Asia Pacific, Latin America, Middle East & Africa). For each meticulously defined segment, the report offers detailed growth projections, current market size estimations, and an in-depth analysis of competitive dynamics. For example, the coagulants and flocculants segment is poised for significant expansion, driven by their indispensable role in a multitude of water clarification and purification processes across diverse industries. Competitive intensity is not uniform; while some segments, such as commodity chemicals, exhibit high competition, others, particularly those involving specialized, high-performance, or environmentally friendly solutions, present unique competitive landscapes.
Key Drivers of Industrial Water Treatment Chemicals Industry Growth
Several factors drive growth in this sector. Stringent environmental regulations globally mandate improved water quality standards, boosting demand for advanced treatment chemicals. The expansion of industrial activities, particularly in developing economies, creates a substantial need for efficient water management. Technological advancements in water treatment technologies, leading to more sustainable and cost-effective solutions, also contribute significantly.
Challenges in the Industrial Water Treatment Chemicals Industry Sector
The Industrial Water Treatment Chemicals Industry navigates a landscape fraught with several significant challenges. Fluctuating raw material prices, often tied to global commodity markets and geopolitical events, exert considerable pressure on production costs and directly impact profit margins. Volatility in the supply chain, particularly for critical precursor materials, can disrupt manufacturing operations, leading to reduced production capacity and delays in meeting customer demand. The industry is also characterized by intense competition, not only from established global players but also from emerging regional competitors and new market entrants, which collectively exert downward pressure on pricing. Furthermore, the ever-evolving landscape of environmental regulations worldwide, coupled with increasingly stringent compliance requirements and the growing demand for sustainable practices, necessitates continuous investment in research and development and process optimization. Adapting to these dynamic regulatory environments and incorporating circular economy principles are paramount for sustained success.
Emerging Opportunities in Industrial Water Treatment Chemicals Industry
Emerging opportunities include the growing demand for sustainable and eco-friendly water treatment solutions. The rising adoption of advanced technologies like AI and IoT in water treatment plants creates opportunities for innovative chemical solutions. Expansion into new and developing markets, particularly in regions with rapid industrialization and limited water resources, presents significant potential.
Leading Players in the Industrial Water Treatment Chemicals Industry Market
- BWA WATER ADDITIVES
- Chemifloc LTD
- Kemira
- Kurita Water Industries Ltd
- Lenntech B V
- Lonza
- DuPont de Nemours Inc
- Ecolab
- SNF
- Solenis
- SUEZ
Key Developments in Industrial Water Treatment Chemicals Industry Industry
- March 2023: Solenis, a leading global producer of specialty chemicals for water-intensive industries, completed the acquisition of Diversey. This strategic move, valued at USD 4.6 Billion, significantly expands Solenis's market share and broadens its product portfolio, particularly in cleaning and hygiene solutions that complement its industrial water treatment offerings, creating a more integrated approach for customers.
- January 2023: Shrieve Chemical Company, a global leader in the chemical distribution and manufacturing sector, acquired Chem One Corporation. This acquisition strengthens Shrieve's position in the distribution of dry chemicals, enhancing its capabilities and product range for a wide array of industrial applications, with a notable emphasis on serving the water treatment sector.
- November 2022: Ecolab Inc. launched its advanced suite of digital solutions, "3D TRASAR™ for Cooling Water," integrating artificial intelligence and predictive analytics to optimize water usage, reduce operational costs, and enhance sustainability for industrial cooling systems.
- September 2022: BASF SE announced significant investments in its production facilities for water treatment chemicals in Europe, aiming to increase capacity and develop more sustainable, bio-based formulations to meet growing market demand for eco-friendly solutions.
Future Outlook for Industrial Water Treatment Chemicals Industry Market
The future trajectory for the Industrial Water Treatment Chemicals Market is overwhelmingly positive, underpinned by several robust growth drivers. Sustained global industrial expansion, particularly in emerging economies, will continue to fuel the demand for effective water management. Furthermore, the increasingly stringent global environmental regulations, coupled with a growing societal emphasis on water conservation and resource sustainability, are creating a fertile ground for innovative and high-performance solutions. Technological advancements, including the integration of digital technologies like AI, IoT, and advanced analytics for real-time monitoring and control, alongside the development of novel, biodegradable, and circular economy-aligned chemistries, will be pivotal. The market is projected to experience robust and consistent growth, presenting substantial opportunities for companies that demonstrate agility in adapting to evolving market demands and commit to substantial investments in research and development. Strategic partnerships, targeted acquisitions for market penetration and technological enhancement, and proactive expansion into underserved or high-growth geographic markets will be critical success factors in navigating and capitalizing on the dynamic future of this essential industry.
Industrial Water Treatment Chemicals Industry Segmentation
-
1. Product Type
- 1.1. Antifoams
- 1.2. Oxygen Scavengers
- 1.3. Corrosion Inhibitors
- 1.4. Biocides and Disinfactants
- 1.5. Oxidants
- 1.6. pH Conditioners
- 1.7. Sludge Conditioners
- 1.8. Scale inhibitors
- 1.9. Other Product Types
-
2. End-user Industry
- 2.1. Oil and Gas
- 2.2. Power
- 2.3. Paper
- 2.4. Metal and mining
- 2.5. Chemical
- 2.6. Other End-user Industries
Industrial Water Treatment Chemicals Industry Segmentation By Geography
-
1. North America
- 1.1. United States
- 1.2. Mexico
- 1.3. Canada
-
2. Europe
- 2.1. Germany
- 2.2. United Kingdom
- 2.3. France
- 2.4. Italy
- 2.5. Rest of Europe
-
3. Asia Pacific
- 3.1. China
- 3.2. India
- 3.3. Japan
- 3.4. South Korea
- 3.5. Rest of Asia Pacific
-
4. South America
- 4.1. Brazil
- 4.2. Argentina
- 4.3. Rest of South America
-
5. Middle East and Africa
- 5.1. Saudi Arabia
- 5.2. South Africa
- 5.3. United Arab Emirates
- 5.4. Rest of Middle East and Africa
Industrial Water Treatment Chemicals Industry Regional Market Share
Geographic Coverage of Industrial Water Treatment Chemicals Industry
Industrial Water Treatment Chemicals Industry REPORT HIGHLIGHTS
| Aspects | Details |
|---|---|
| Study Period | 2020-2034 |
| Base Year | 2025 |
| Estimated Year | 2026 |
| Forecast Period | 2026-2034 |
| Historical Period | 2020-2025 |
| Growth Rate | CAGR of 6.04% from 2020-2034 |
| Segmentation |
|
Table of Contents
- 1. Introduction
- 1.1. Research Scope
- 1.2. Market Segmentation
- 1.3. Research Objective
- 1.4. Definitions and Assumptions
- 2. Executive Summary
- 2.1. Market Snapshot
- 3. Market Dynamics
- 3.1. Market Drivers
- 3.2. Market Restrains
- 3.3. Market Trends
- 3.4. Market Opportunities
- 4. Market Factor Analysis
- 4.1. Porters Five Forces
- 4.1.1. Bargaining Power of Suppliers
- 4.1.2. Bargaining Power of Buyers
- 4.1.3. Threat of New Entrants
- 4.1.4. Threat of Substitutes
- 4.1.5. Competitive Rivalry
- 4.2. PESTEL analysis
- 4.3. BCG Analysis
- 4.3.1. Stars (High Growth, High Market Share)
- 4.3.2. Cash Cows (Low Growth, High Market Share)
- 4.3.3. Question Mark (High Growth, Low Market Share)
- 4.3.4. Dogs (Low Growth, Low Market Share)
- 4.4. Ansoff Matrix Analysis
- 4.5. Supply Chain Analysis
- 4.6. Regulatory Landscape
- 4.7. Current Market Potential and Opportunity Assessment (TAM–SAM–SOM Framework)
- 4.8. PRI Analyst Note
- 4.1. Porters Five Forces
- 5. Market Analysis, Insights and Forecast 2021-2033
- 5.1. Market Analysis, Insights and Forecast - by Product Type
- 5.1.1. Antifoams
- 5.1.2. Oxygen Scavengers
- 5.1.3. Corrosion Inhibitors
- 5.1.4. Biocides and Disinfactants
- 5.1.5. Oxidants
- 5.1.6. pH Conditioners
- 5.1.7. Sludge Conditioners
- 5.1.8. Scale inhibitors
- 5.1.9. Other Product Types
- 5.2. Market Analysis, Insights and Forecast - by End-user Industry
- 5.2.1. Oil and Gas
- 5.2.2. Power
- 5.2.3. Paper
- 5.2.4. Metal and mining
- 5.2.5. Chemical
- 5.2.6. Other End-user Industries
- 5.3. Market Analysis, Insights and Forecast - by Region
- 5.3.1. North America
- 5.3.2. Europe
- 5.3.3. Asia Pacific
- 5.3.4. South America
- 5.3.5. Middle East and Africa
- 5.1. Market Analysis, Insights and Forecast - by Product Type
- 6. Global Industrial Water Treatment Chemicals Industry Analysis, Insights and Forecast, 2021-2033
- 6.1. Market Analysis, Insights and Forecast - by Product Type
- 6.1.1. Antifoams
- 6.1.2. Oxygen Scavengers
- 6.1.3. Corrosion Inhibitors
- 6.1.4. Biocides and Disinfactants
- 6.1.5. Oxidants
- 6.1.6. pH Conditioners
- 6.1.7. Sludge Conditioners
- 6.1.8. Scale inhibitors
- 6.1.9. Other Product Types
- 6.2. Market Analysis, Insights and Forecast - by End-user Industry
- 6.2.1. Oil and Gas
- 6.2.2. Power
- 6.2.3. Paper
- 6.2.4. Metal and mining
- 6.2.5. Chemical
- 6.2.6. Other End-user Industries
- 6.1. Market Analysis, Insights and Forecast - by Product Type
- 7. North America Industrial Water Treatment Chemicals Industry Analysis, Insights and Forecast, 2020-2032
- 7.1. Market Analysis, Insights and Forecast - by Product Type
- 7.1.1. Antifoams
- 7.1.2. Oxygen Scavengers
- 7.1.3. Corrosion Inhibitors
- 7.1.4. Biocides and Disinfactants
- 7.1.5. Oxidants
- 7.1.6. pH Conditioners
- 7.1.7. Sludge Conditioners
- 7.1.8. Scale inhibitors
- 7.1.9. Other Product Types
- 7.2. Market Analysis, Insights and Forecast - by End-user Industry
- 7.2.1. Oil and Gas
- 7.2.2. Power
- 7.2.3. Paper
- 7.2.4. Metal and mining
- 7.2.5. Chemical
- 7.2.6. Other End-user Industries
- 7.1. Market Analysis, Insights and Forecast - by Product Type
- 8. Europe Industrial Water Treatment Chemicals Industry Analysis, Insights and Forecast, 2020-2032
- 8.1. Market Analysis, Insights and Forecast - by Product Type
- 8.1.1. Antifoams
- 8.1.2. Oxygen Scavengers
- 8.1.3. Corrosion Inhibitors
- 8.1.4. Biocides and Disinfactants
- 8.1.5. Oxidants
- 8.1.6. pH Conditioners
- 8.1.7. Sludge Conditioners
- 8.1.8. Scale inhibitors
- 8.1.9. Other Product Types
- 8.2. Market Analysis, Insights and Forecast - by End-user Industry
- 8.2.1. Oil and Gas
- 8.2.2. Power
- 8.2.3. Paper
- 8.2.4. Metal and mining
- 8.2.5. Chemical
- 8.2.6. Other End-user Industries
- 8.1. Market Analysis, Insights and Forecast - by Product Type
- 9. Asia Pacific Industrial Water Treatment Chemicals Industry Analysis, Insights and Forecast, 2020-2032
- 9.1. Market Analysis, Insights and Forecast - by Product Type
- 9.1.1. Antifoams
- 9.1.2. Oxygen Scavengers
- 9.1.3. Corrosion Inhibitors
- 9.1.4. Biocides and Disinfactants
- 9.1.5. Oxidants
- 9.1.6. pH Conditioners
- 9.1.7. Sludge Conditioners
- 9.1.8. Scale inhibitors
- 9.1.9. Other Product Types
- 9.2. Market Analysis, Insights and Forecast - by End-user Industry
- 9.2.1. Oil and Gas
- 9.2.2. Power
- 9.2.3. Paper
- 9.2.4. Metal and mining
- 9.2.5. Chemical
- 9.2.6. Other End-user Industries
- 9.1. Market Analysis, Insights and Forecast - by Product Type
- 10. South America Industrial Water Treatment Chemicals Industry Analysis, Insights and Forecast, 2020-2032
- 10.1. Market Analysis, Insights and Forecast - by Product Type
- 10.1.1. Antifoams
- 10.1.2. Oxygen Scavengers
- 10.1.3. Corrosion Inhibitors
- 10.1.4. Biocides and Disinfactants
- 10.1.5. Oxidants
- 10.1.6. pH Conditioners
- 10.1.7. Sludge Conditioners
- 10.1.8. Scale inhibitors
- 10.1.9. Other Product Types
- 10.2. Market Analysis, Insights and Forecast - by End-user Industry
- 10.2.1. Oil and Gas
- 10.2.2. Power
- 10.2.3. Paper
- 10.2.4. Metal and mining
- 10.2.5. Chemical
- 10.2.6. Other End-user Industries
- 10.1. Market Analysis, Insights and Forecast - by Product Type
- 11. Middle East and Africa Industrial Water Treatment Chemicals Industry Analysis, Insights and Forecast, 2020-2032
- 11.1. Market Analysis, Insights and Forecast - by Product Type
- 11.1.1. Antifoams
- 11.1.2. Oxygen Scavengers
- 11.1.3. Corrosion Inhibitors
- 11.1.4. Biocides and Disinfactants
- 11.1.5. Oxidants
- 11.1.6. pH Conditioners
- 11.1.7. Sludge Conditioners
- 11.1.8. Scale inhibitors
- 11.1.9. Other Product Types
- 11.2. Market Analysis, Insights and Forecast - by End-user Industry
- 11.2.1. Oil and Gas
- 11.2.2. Power
- 11.2.3. Paper
- 11.2.4. Metal and mining
- 11.2.5. Chemical
- 11.2.6. Other End-user Industries
- 11.1. Market Analysis, Insights and Forecast - by Product Type
- 12. Competitive Analysis
- 12.1. Company Profiles
- 12.1.1 BWA WATER ADDITIVES
- 12.1.1.1. Company Overview
- 12.1.1.2. Products
- 12.1.1.3. Company Financials
- 12.1.1.4. SWOT Analysis
- 12.1.2 Chemifloc LTD
- 12.1.2.1. Company Overview
- 12.1.2.2. Products
- 12.1.2.3. Company Financials
- 12.1.2.4. SWOT Analysis
- 12.1.3 Kemira
- 12.1.3.1. Company Overview
- 12.1.3.2. Products
- 12.1.3.3. Company Financials
- 12.1.3.4. SWOT Analysis
- 12.1.4 Kurita Water Industries Ltd
- 12.1.4.1. Company Overview
- 12.1.4.2. Products
- 12.1.4.3. Company Financials
- 12.1.4.4. SWOT Analysis
- 12.1.5 Lenntech B V
- 12.1.5.1. Company Overview
- 12.1.5.2. Products
- 12.1.5.3. Company Financials
- 12.1.5.4. SWOT Analysis
- 12.1.6 Lonza
- 12.1.6.1. Company Overview
- 12.1.6.2. Products
- 12.1.6.3. Company Financials
- 12.1.6.4. SWOT Analysis
- 12.1.7 DuPont de Nemours Inc
- 12.1.7.1. Company Overview
- 12.1.7.2. Products
- 12.1.7.3. Company Financials
- 12.1.7.4. SWOT Analysis
- 12.1.8 Ecolab
- 12.1.8.1. Company Overview
- 12.1.8.2. Products
- 12.1.8.3. Company Financials
- 12.1.8.4. SWOT Analysis
- 12.1.9 SNF
- 12.1.9.1. Company Overview
- 12.1.9.2. Products
- 12.1.9.3. Company Financials
- 12.1.9.4. SWOT Analysis
- 12.1.10 Solenis
- 12.1.10.1. Company Overview
- 12.1.10.2. Products
- 12.1.10.3. Company Financials
- 12.1.10.4. SWOT Analysis
- 12.1.11 SUEZ*List Not Exhaustive
- 12.1.11.1. Company Overview
- 12.1.11.2. Products
- 12.1.11.3. Company Financials
- 12.1.11.4. SWOT Analysis
- 12.1.1 BWA WATER ADDITIVES
- 12.2. Market Entropy
- 12.2.1 Company's Key Areas Served
- 12.2.2 Recent Developments
- 12.3. Company Market Share Analysis 2025
- 12.3.1 Top 5 Companies Market Share Analysis
- 12.3.2 Top 3 Companies Market Share Analysis
- 12.4. List of Potential Customers
- 13. Research Methodology
List of Figures
- Figure 1: Global Industrial Water Treatment Chemicals Industry Revenue Breakdown (Million, %) by Region 2025 & 2033
- Figure 2: Global Industrial Water Treatment Chemicals Industry Volume Breakdown (Billion, %) by Region 2025 & 2033
- Figure 3: North America Industrial Water Treatment Chemicals Industry Revenue (Million), by Product Type 2025 & 2033
- Figure 4: North America Industrial Water Treatment Chemicals Industry Volume (Billion), by Product Type 2025 & 2033
- Figure 5: North America Industrial Water Treatment Chemicals Industry Revenue Share (%), by Product Type 2025 & 2033
- Figure 6: North America Industrial Water Treatment Chemicals Industry Volume Share (%), by Product Type 2025 & 2033
- Figure 7: North America Industrial Water Treatment Chemicals Industry Revenue (Million), by End-user Industry 2025 & 2033
- Figure 8: North America Industrial Water Treatment Chemicals Industry Volume (Billion), by End-user Industry 2025 & 2033
- Figure 9: North America Industrial Water Treatment Chemicals Industry Revenue Share (%), by End-user Industry 2025 & 2033
- Figure 10: North America Industrial Water Treatment Chemicals Industry Volume Share (%), by End-user Industry 2025 & 2033
- Figure 11: North America Industrial Water Treatment Chemicals Industry Revenue (Million), by Country 2025 & 2033
- Figure 12: North America Industrial Water Treatment Chemicals Industry Volume (Billion), by Country 2025 & 2033
- Figure 13: North America Industrial Water Treatment Chemicals Industry Revenue Share (%), by Country 2025 & 2033
- Figure 14: North America Industrial Water Treatment Chemicals Industry Volume Share (%), by Country 2025 & 2033
- Figure 15: Europe Industrial Water Treatment Chemicals Industry Revenue (Million), by Product Type 2025 & 2033
- Figure 16: Europe Industrial Water Treatment Chemicals Industry Volume (Billion), by Product Type 2025 & 2033
- Figure 17: Europe Industrial Water Treatment Chemicals Industry Revenue Share (%), by Product Type 2025 & 2033
- Figure 18: Europe Industrial Water Treatment Chemicals Industry Volume Share (%), by Product Type 2025 & 2033
- Figure 19: Europe Industrial Water Treatment Chemicals Industry Revenue (Million), by End-user Industry 2025 & 2033
- Figure 20: Europe Industrial Water Treatment Chemicals Industry Volume (Billion), by End-user Industry 2025 & 2033
- Figure 21: Europe Industrial Water Treatment Chemicals Industry Revenue Share (%), by End-user Industry 2025 & 2033
- Figure 22: Europe Industrial Water Treatment Chemicals Industry Volume Share (%), by End-user Industry 2025 & 2033
- Figure 23: Europe Industrial Water Treatment Chemicals Industry Revenue (Million), by Country 2025 & 2033
- Figure 24: Europe Industrial Water Treatment Chemicals Industry Volume (Billion), by Country 2025 & 2033
- Figure 25: Europe Industrial Water Treatment Chemicals Industry Revenue Share (%), by Country 2025 & 2033
- Figure 26: Europe Industrial Water Treatment Chemicals Industry Volume Share (%), by Country 2025 & 2033
- Figure 27: Asia Pacific Industrial Water Treatment Chemicals Industry Revenue (Million), by Product Type 2025 & 2033
- Figure 28: Asia Pacific Industrial Water Treatment Chemicals Industry Volume (Billion), by Product Type 2025 & 2033
- Figure 29: Asia Pacific Industrial Water Treatment Chemicals Industry Revenue Share (%), by Product Type 2025 & 2033
- Figure 30: Asia Pacific Industrial Water Treatment Chemicals Industry Volume Share (%), by Product Type 2025 & 2033
- Figure 31: Asia Pacific Industrial Water Treatment Chemicals Industry Revenue (Million), by End-user Industry 2025 & 2033
- Figure 32: Asia Pacific Industrial Water Treatment Chemicals Industry Volume (Billion), by End-user Industry 2025 & 2033
- Figure 33: Asia Pacific Industrial Water Treatment Chemicals Industry Revenue Share (%), by End-user Industry 2025 & 2033
- Figure 34: Asia Pacific Industrial Water Treatment Chemicals Industry Volume Share (%), by End-user Industry 2025 & 2033
- Figure 35: Asia Pacific Industrial Water Treatment Chemicals Industry Revenue (Million), by Country 2025 & 2033
- Figure 36: Asia Pacific Industrial Water Treatment Chemicals Industry Volume (Billion), by Country 2025 & 2033
- Figure 37: Asia Pacific Industrial Water Treatment Chemicals Industry Revenue Share (%), by Country 2025 & 2033
- Figure 38: Asia Pacific Industrial Water Treatment Chemicals Industry Volume Share (%), by Country 2025 & 2033
- Figure 39: South America Industrial Water Treatment Chemicals Industry Revenue (Million), by Product Type 2025 & 2033
- Figure 40: South America Industrial Water Treatment Chemicals Industry Volume (Billion), by Product Type 2025 & 2033
- Figure 41: South America Industrial Water Treatment Chemicals Industry Revenue Share (%), by Product Type 2025 & 2033
- Figure 42: South America Industrial Water Treatment Chemicals Industry Volume Share (%), by Product Type 2025 & 2033
- Figure 43: South America Industrial Water Treatment Chemicals Industry Revenue (Million), by End-user Industry 2025 & 2033
- Figure 44: South America Industrial Water Treatment Chemicals Industry Volume (Billion), by End-user Industry 2025 & 2033
- Figure 45: South America Industrial Water Treatment Chemicals Industry Revenue Share (%), by End-user Industry 2025 & 2033
- Figure 46: South America Industrial Water Treatment Chemicals Industry Volume Share (%), by End-user Industry 2025 & 2033
- Figure 47: South America Industrial Water Treatment Chemicals Industry Revenue (Million), by Country 2025 & 2033
- Figure 48: South America Industrial Water Treatment Chemicals Industry Volume (Billion), by Country 2025 & 2033
- Figure 49: South America Industrial Water Treatment Chemicals Industry Revenue Share (%), by Country 2025 & 2033
- Figure 50: South America Industrial Water Treatment Chemicals Industry Volume Share (%), by Country 2025 & 2033
- Figure 51: Middle East and Africa Industrial Water Treatment Chemicals Industry Revenue (Million), by Product Type 2025 & 2033
- Figure 52: Middle East and Africa Industrial Water Treatment Chemicals Industry Volume (Billion), by Product Type 2025 & 2033
- Figure 53: Middle East and Africa Industrial Water Treatment Chemicals Industry Revenue Share (%), by Product Type 2025 & 2033
- Figure 54: Middle East and Africa Industrial Water Treatment Chemicals Industry Volume Share (%), by Product Type 2025 & 2033
- Figure 55: Middle East and Africa Industrial Water Treatment Chemicals Industry Revenue (Million), by End-user Industry 2025 & 2033
- Figure 56: Middle East and Africa Industrial Water Treatment Chemicals Industry Volume (Billion), by End-user Industry 2025 & 2033
- Figure 57: Middle East and Africa Industrial Water Treatment Chemicals Industry Revenue Share (%), by End-user Industry 2025 & 2033
- Figure 58: Middle East and Africa Industrial Water Treatment Chemicals Industry Volume Share (%), by End-user Industry 2025 & 2033
- Figure 59: Middle East and Africa Industrial Water Treatment Chemicals Industry Revenue (Million), by Country 2025 & 2033
- Figure 60: Middle East and Africa Industrial Water Treatment Chemicals Industry Volume (Billion), by Country 2025 & 2033
- Figure 61: Middle East and Africa Industrial Water Treatment Chemicals Industry Revenue Share (%), by Country 2025 & 2033
- Figure 62: Middle East and Africa Industrial Water Treatment Chemicals Industry Volume Share (%), by Country 2025 & 2033
List of Tables
- Table 1: Global Industrial Water Treatment Chemicals Industry Revenue Million Forecast, by Product Type 2020 & 2033
- Table 2: Global Industrial Water Treatment Chemicals Industry Volume Billion Forecast, by Product Type 2020 & 2033
- Table 3: Global Industrial Water Treatment Chemicals Industry Revenue Million Forecast, by End-user Industry 2020 & 2033
- Table 4: Global Industrial Water Treatment Chemicals Industry Volume Billion Forecast, by End-user Industry 2020 & 2033
- Table 5: Global Industrial Water Treatment Chemicals Industry Revenue Million Forecast, by Region 2020 & 2033
- Table 6: Global Industrial Water Treatment Chemicals Industry Volume Billion Forecast, by Region 2020 & 2033
- Table 7: Global Industrial Water Treatment Chemicals Industry Revenue Million Forecast, by Product Type 2020 & 2033
- Table 8: Global Industrial Water Treatment Chemicals Industry Volume Billion Forecast, by Product Type 2020 & 2033
- Table 9: Global Industrial Water Treatment Chemicals Industry Revenue Million Forecast, by End-user Industry 2020 & 2033
- Table 10: Global Industrial Water Treatment Chemicals Industry Volume Billion Forecast, by End-user Industry 2020 & 2033
- Table 11: Global Industrial Water Treatment Chemicals Industry Revenue Million Forecast, by Country 2020 & 2033
- Table 12: Global Industrial Water Treatment Chemicals Industry Volume Billion Forecast, by Country 2020 & 2033
- Table 13: United States Industrial Water Treatment Chemicals Industry Revenue (Million) Forecast, by Application 2020 & 2033
- Table 14: United States Industrial Water Treatment Chemicals Industry Volume (Billion) Forecast, by Application 2020 & 2033
- Table 15: Mexico Industrial Water Treatment Chemicals Industry Revenue (Million) Forecast, by Application 2020 & 2033
- Table 16: Mexico Industrial Water Treatment Chemicals Industry Volume (Billion) Forecast, by Application 2020 & 2033
- Table 17: Canada Industrial Water Treatment Chemicals Industry Revenue (Million) Forecast, by Application 2020 & 2033
- Table 18: Canada Industrial Water Treatment Chemicals Industry Volume (Billion) Forecast, by Application 2020 & 2033
- Table 19: Global Industrial Water Treatment Chemicals Industry Revenue Million Forecast, by Product Type 2020 & 2033
- Table 20: Global Industrial Water Treatment Chemicals Industry Volume Billion Forecast, by Product Type 2020 & 2033
- Table 21: Global Industrial Water Treatment Chemicals Industry Revenue Million Forecast, by End-user Industry 2020 & 2033
- Table 22: Global Industrial Water Treatment Chemicals Industry Volume Billion Forecast, by End-user Industry 2020 & 2033
- Table 23: Global Industrial Water Treatment Chemicals Industry Revenue Million Forecast, by Country 2020 & 2033
- Table 24: Global Industrial Water Treatment Chemicals Industry Volume Billion Forecast, by Country 2020 & 2033
- Table 25: Germany Industrial Water Treatment Chemicals Industry Revenue (Million) Forecast, by Application 2020 & 2033
- Table 26: Germany Industrial Water Treatment Chemicals Industry Volume (Billion) Forecast, by Application 2020 & 2033
- Table 27: United Kingdom Industrial Water Treatment Chemicals Industry Revenue (Million) Forecast, by Application 2020 & 2033
- Table 28: United Kingdom Industrial Water Treatment Chemicals Industry Volume (Billion) Forecast, by Application 2020 & 2033
- Table 29: France Industrial Water Treatment Chemicals Industry Revenue (Million) Forecast, by Application 2020 & 2033
- Table 30: France Industrial Water Treatment Chemicals Industry Volume (Billion) Forecast, by Application 2020 & 2033
- Table 31: Italy Industrial Water Treatment Chemicals Industry Revenue (Million) Forecast, by Application 2020 & 2033
- Table 32: Italy Industrial Water Treatment Chemicals Industry Volume (Billion) Forecast, by Application 2020 & 2033
- Table 33: Rest of Europe Industrial Water Treatment Chemicals Industry Revenue (Million) Forecast, by Application 2020 & 2033
- Table 34: Rest of Europe Industrial Water Treatment Chemicals Industry Volume (Billion) Forecast, by Application 2020 & 2033
- Table 35: Global Industrial Water Treatment Chemicals Industry Revenue Million Forecast, by Product Type 2020 & 2033
- Table 36: Global Industrial Water Treatment Chemicals Industry Volume Billion Forecast, by Product Type 2020 & 2033
- Table 37: Global Industrial Water Treatment Chemicals Industry Revenue Million Forecast, by End-user Industry 2020 & 2033
- Table 38: Global Industrial Water Treatment Chemicals Industry Volume Billion Forecast, by End-user Industry 2020 & 2033
- Table 39: Global Industrial Water Treatment Chemicals Industry Revenue Million Forecast, by Country 2020 & 2033
- Table 40: Global Industrial Water Treatment Chemicals Industry Volume Billion Forecast, by Country 2020 & 2033
- Table 41: China Industrial Water Treatment Chemicals Industry Revenue (Million) Forecast, by Application 2020 & 2033
- Table 42: China Industrial Water Treatment Chemicals Industry Volume (Billion) Forecast, by Application 2020 & 2033
- Table 43: India Industrial Water Treatment Chemicals Industry Revenue (Million) Forecast, by Application 2020 & 2033
- Table 44: India Industrial Water Treatment Chemicals Industry Volume (Billion) Forecast, by Application 2020 & 2033
- Table 45: Japan Industrial Water Treatment Chemicals Industry Revenue (Million) Forecast, by Application 2020 & 2033
- Table 46: Japan Industrial Water Treatment Chemicals Industry Volume (Billion) Forecast, by Application 2020 & 2033
- Table 47: South Korea Industrial Water Treatment Chemicals Industry Revenue (Million) Forecast, by Application 2020 & 2033
- Table 48: South Korea Industrial Water Treatment Chemicals Industry Volume (Billion) Forecast, by Application 2020 & 2033
- Table 49: Rest of Asia Pacific Industrial Water Treatment Chemicals Industry Revenue (Million) Forecast, by Application 2020 & 2033
- Table 50: Rest of Asia Pacific Industrial Water Treatment Chemicals Industry Volume (Billion) Forecast, by Application 2020 & 2033
- Table 51: Global Industrial Water Treatment Chemicals Industry Revenue Million Forecast, by Product Type 2020 & 2033
- Table 52: Global Industrial Water Treatment Chemicals Industry Volume Billion Forecast, by Product Type 2020 & 2033
- Table 53: Global Industrial Water Treatment Chemicals Industry Revenue Million Forecast, by End-user Industry 2020 & 2033
- Table 54: Global Industrial Water Treatment Chemicals Industry Volume Billion Forecast, by End-user Industry 2020 & 2033
- Table 55: Global Industrial Water Treatment Chemicals Industry Revenue Million Forecast, by Country 2020 & 2033
- Table 56: Global Industrial Water Treatment Chemicals Industry Volume Billion Forecast, by Country 2020 & 2033
- Table 57: Brazil Industrial Water Treatment Chemicals Industry Revenue (Million) Forecast, by Application 2020 & 2033
- Table 58: Brazil Industrial Water Treatment Chemicals Industry Volume (Billion) Forecast, by Application 2020 & 2033
- Table 59: Argentina Industrial Water Treatment Chemicals Industry Revenue (Million) Forecast, by Application 2020 & 2033
- Table 60: Argentina Industrial Water Treatment Chemicals Industry Volume (Billion) Forecast, by Application 2020 & 2033
- Table 61: Rest of South America Industrial Water Treatment Chemicals Industry Revenue (Million) Forecast, by Application 2020 & 2033
- Table 62: Rest of South America Industrial Water Treatment Chemicals Industry Volume (Billion) Forecast, by Application 2020 & 2033
- Table 63: Global Industrial Water Treatment Chemicals Industry Revenue Million Forecast, by Product Type 2020 & 2033
- Table 64: Global Industrial Water Treatment Chemicals Industry Volume Billion Forecast, by Product Type 2020 & 2033
- Table 65: Global Industrial Water Treatment Chemicals Industry Revenue Million Forecast, by End-user Industry 2020 & 2033
- Table 66: Global Industrial Water Treatment Chemicals Industry Volume Billion Forecast, by End-user Industry 2020 & 2033
- Table 67: Global Industrial Water Treatment Chemicals Industry Revenue Million Forecast, by Country 2020 & 2033
- Table 68: Global Industrial Water Treatment Chemicals Industry Volume Billion Forecast, by Country 2020 & 2033
- Table 69: Saudi Arabia Industrial Water Treatment Chemicals Industry Revenue (Million) Forecast, by Application 2020 & 2033
- Table 70: Saudi Arabia Industrial Water Treatment Chemicals Industry Volume (Billion) Forecast, by Application 2020 & 2033
- Table 71: South Africa Industrial Water Treatment Chemicals Industry Revenue (Million) Forecast, by Application 2020 & 2033
- Table 72: South Africa Industrial Water Treatment Chemicals Industry Volume (Billion) Forecast, by Application 2020 & 2033
- Table 73: United Arab Emirates Industrial Water Treatment Chemicals Industry Revenue (Million) Forecast, by Application 2020 & 2033
- Table 74: United Arab Emirates Industrial Water Treatment Chemicals Industry Volume (Billion) Forecast, by Application 2020 & 2033
- Table 75: Rest of Middle East and Africa Industrial Water Treatment Chemicals Industry Revenue (Million) Forecast, by Application 2020 & 2033
- Table 76: Rest of Middle East and Africa Industrial Water Treatment Chemicals Industry Volume (Billion) Forecast, by Application 2020 & 2033
Frequently Asked Questions
1. What is the projected Compound Annual Growth Rate (CAGR) of the Industrial Water Treatment Chemicals Industry?
The projected CAGR is approximately 6.04%.
2. Which companies are prominent players in the Industrial Water Treatment Chemicals Industry?
Key companies in the market include BWA WATER ADDITIVES, Chemifloc LTD, Kemira, Kurita Water Industries Ltd, Lenntech B V, Lonza, DuPont de Nemours Inc, Ecolab, SNF, Solenis, SUEZ*List Not Exhaustive.
3. What are the main segments of the Industrial Water Treatment Chemicals Industry?
The market segments include Product Type, End-user Industry.
4. Can you provide details about the market size?
The market size is estimated to be USD 22.19 Million as of 2022.
5. What are some drivers contributing to market growth?
Increasing Production of Shale Gas in the United States; Growing Production Activities in Chemical and Paper Industry; Other Drivers.
6. What are the notable trends driving market growth?
Power Industry to Dominate the Market.
7. Are there any restraints impacting market growth?
Increasing Production of Shale Gas in the United States; Growing Production Activities in Chemical and Paper Industry; Other Drivers.
8. Can you provide examples of recent developments in the market?
March 2023: Solenis, providing water treatment solutions for municipal and industrial water treatment, announced that it agreed to acquire Diversey, a cleaning solutions company primarily for industrial water treatment, for USD 4.6 billion.
9. What pricing options are available for accessing the report?
Pricing options include single-user, multi-user, and enterprise licenses priced at USD 4750, USD 5250, and USD 8750 respectively.
10. Is the market size provided in terms of value or volume?
The market size is provided in terms of value, measured in Million and volume, measured in Billion.
11. Are there any specific market keywords associated with the report?
Yes, the market keyword associated with the report is "Industrial Water Treatment Chemicals Industry," which aids in identifying and referencing the specific market segment covered.
12. How do I determine which pricing option suits my needs best?
The pricing options vary based on user requirements and access needs. Individual users may opt for single-user licenses, while businesses requiring broader access may choose multi-user or enterprise licenses for cost-effective access to the report.
13. Are there any additional resources or data provided in the Industrial Water Treatment Chemicals Industry report?
While the report offers comprehensive insights, it's advisable to review the specific contents or supplementary materials provided to ascertain if additional resources or data are available.
14. How can I stay updated on further developments or reports in the Industrial Water Treatment Chemicals Industry?
To stay informed about further developments, trends, and reports in the Industrial Water Treatment Chemicals Industry, consider subscribing to industry newsletters, following relevant companies and organizations, or regularly checking reputable industry news sources and publications.
Methodology
Step 1 - Identification of Relevant Samples Size from Population Database


Step 2 - Approaches for Defining Global Market Size (Value, Volume* & Price*)

Note*: In applicable scenarios
Step 3 - Data Sources
Primary Research
- Web Analytics
- Survey Reports
- Research Institute
- Latest Research Reports
- Opinion Leaders
Secondary Research
- Annual Reports
- White Paper
- Latest Press Release
- Industry Association
- Paid Database
- Investor Presentations

Step 4 - Data Triangulation
Involves using different sources of information in order to increase the validity of a study
These sources are likely to be stakeholders in a program - participants, other researchers, program staff, other community members, and so on.
Then we put all data in single framework & apply various statistical tools to find out the dynamic on the market.
During the analysis stage, feedback from the stakeholder groups would be compared to determine areas of agreement as well as areas of divergence