Key Insights
The global insecticides market is projected for significant expansion, driven by escalating global food demand and the increasing incidence of insect-borne diseases impacting public health and livestock. The market is estimated at $8.36 billion in the base year 2025 and is expected to grow at a compound annual growth rate (CAGR) of 14.25% from 2025 to 2033. Technological advancements, including the development of biopesticides and targeted formulations with reduced environmental impact, are key growth catalysts. However, stringent regulatory frameworks and heightened consumer awareness regarding health and environmental risks present notable challenges. The market is segmented by application mode (chemigation, foliar, fumigation, seed treatment, soil treatment) and crop type (commercial crops, fruits & vegetables, grains & cereals, pulses & oilseeds, turf & ornamental). Key industry players like FMC Corporation, Sumitomo Chemical, Adama, Bayer, UPL, Syngenta, Jiangsu Yangnong Chemical, Corteva, Nufarm, and BASF are actively pursuing R&D, M&A, and strategic alliances to enhance market position and foster innovation.
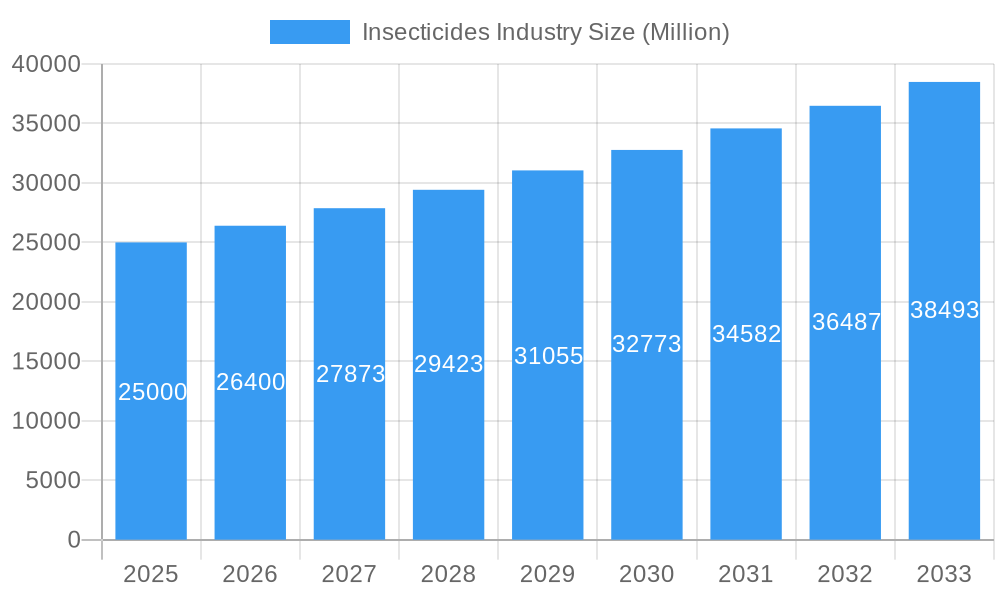
Insecticides Industry Market Size (In Billion)
Future market trajectory will be shaped by evolving regulations, the adoption of sustainable agricultural practices, and the innovation of eco-friendly insecticides. The rise of organic farming and consumer demand for pesticide-free produce offer both opportunities and challenges. Companies are increasingly prioritizing integrated pest management (IPM) strategies for a balanced and environmentally conscious approach. Geographical market growth will vary based on agricultural practices, regulatory environments, and pest prevalence. Regions with intensive agriculture and growing populations are anticipated to experience accelerated growth. Ongoing research into precise, targeted insecticides, coupled with improved crop management, will define the future of this essential sector.
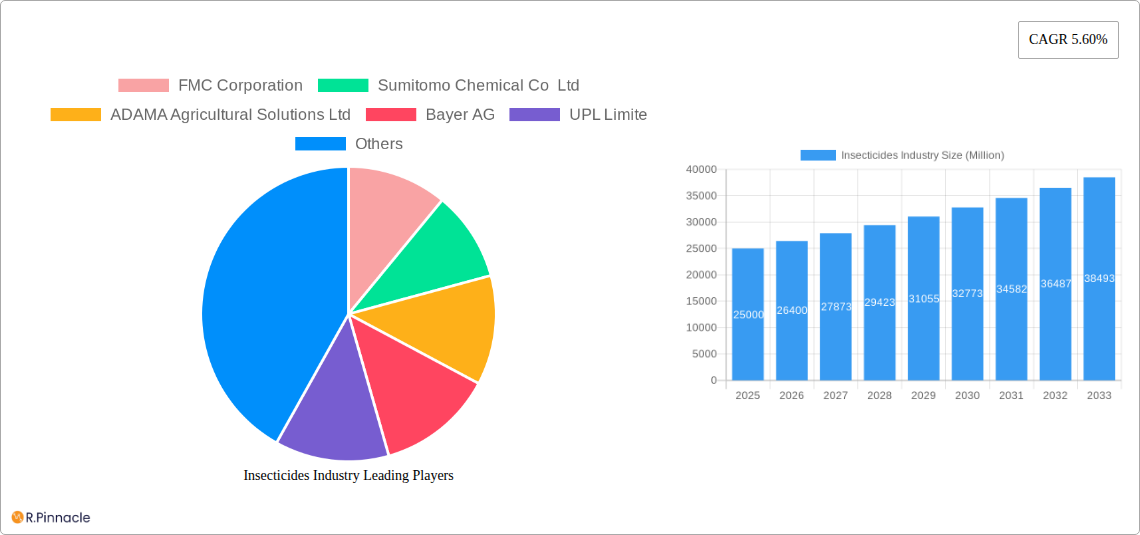
Insecticides Industry Company Market Share
Insecticides Industry Market Analysis: 2025-2033
This comprehensive market report offers in-depth analysis of the global insecticides market, providing critical insights for industry professionals, investors, and stakeholders. Covering the period from 2025 to 2033, this report examines market dynamics, growth drivers, challenges, and emerging opportunities across diverse segments and geographies. The report forecasts a market valued at approximately $8.36 billion in 2025, highlighting substantial growth prospects for businesses within this vital industry.
Insecticides Industry Market Structure & Innovation Trends
This section examines the competitive landscape of the insecticides industry, including market concentration, innovation drivers, regulatory landscapes, and M&A activities. The global insecticides market is moderately concentrated, with key players holding significant market shares. FMC Corporation, Sumitomo Chemical Co Ltd, Adama Agricultural Solutions Ltd, Bayer AG, UPL Limited, Syngenta Group, Jiangsu Yangnong Chemical Co Ltd, Corteva Agriscience, Nufarm Ltd, and BASF SE are among the leading players, collectively controlling an estimated xx% of the market in 2025. Market share fluctuations are primarily driven by new product launches, strategic alliances, and regulatory changes.
- Market Concentration: Moderate, with top 10 players holding xx% market share in 2025.
- Innovation Drivers: Growing demand for high-efficacy, eco-friendly insecticides, technological advancements in formulation and delivery systems.
- Regulatory Frameworks: Stringent regulations concerning pesticide registration and use, varying across different regions, impacting market access and product development.
- Product Substitutes: Biopesticides and integrated pest management (IPM) strategies are emerging as substitutes, though chemical insecticides remain dominant.
- End-User Demographics: Primarily farmers (both large-scale commercial and smallholder), landscape managers, and public health agencies.
- M&A Activities: Significant M&A activity observed in recent years, with deal values exceeding xx Million in the period 2019-2024, driven by consolidation and expansion efforts.
Insecticides Industry Market Dynamics & Trends
This section delves into the market's growth drivers, technological disruptions, consumer preferences, and competitive dynamics. The global insecticides market is projected to witness a Compound Annual Growth Rate (CAGR) of xx% during the forecast period (2025-2033), driven by factors such as increasing crop acreage, rising food demand, and the prevalence of insect pests. Technological advancements in insecticide formulations, including targeted delivery systems and biopesticides, are reshaping the market. Consumer preference is shifting towards environmentally friendly and sustainable options. Intense competition among established players and the emergence of new entrants continue to influence market dynamics. Market penetration is expected to increase in developing regions, particularly in Asia and Africa, fueled by improving agricultural practices and rising incomes.
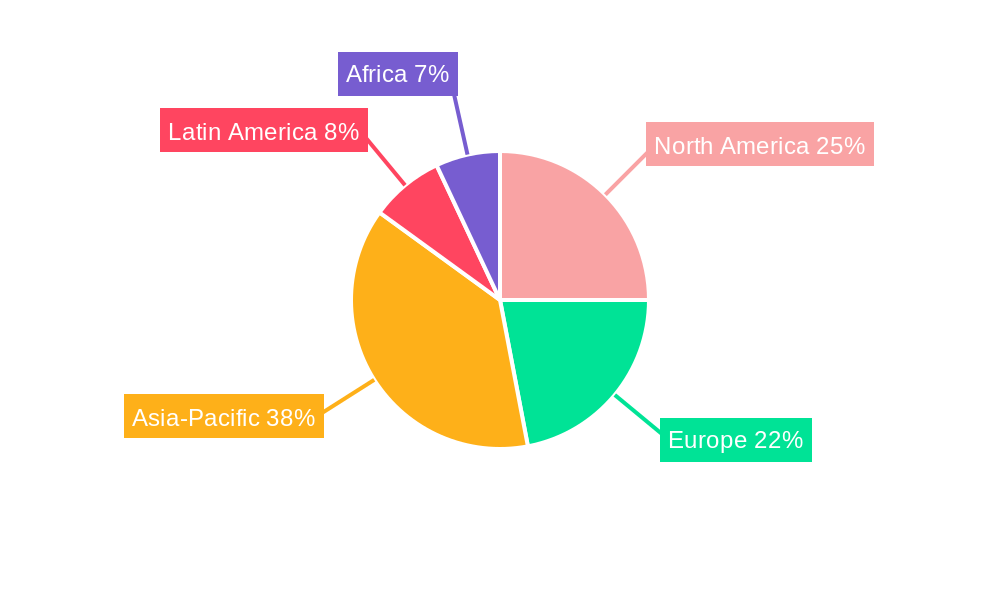
Dominant Regions & Segments in Insecticides Industry
This section identifies the leading regions and segments within the insecticides market. Asia Pacific is expected to dominate the market in 2025, driven by large agricultural areas and increasing demand for crop protection solutions. Within application modes, foliar application holds the largest market share, followed by seed treatment. In crop types, grains and cereals segment dominates due to its large-scale cultivation and susceptibility to various pests.
Key Drivers for Asia Pacific Dominance:
- Rapidly expanding agricultural sector
- Rising disposable incomes leading to increased food consumption
- Favorable government policies supporting agricultural growth
- Expanding infrastructure, enhancing access to insecticides
Dominant Application Mode: Foliar application due to ease of use and broad effectiveness.
Dominant Crop Type: Grains & Cereals due to high acreage and pest susceptibility.
Insecticides Industry Product Innovations
Recent years have witnessed significant advancements in insecticide technology, focusing on enhanced efficacy, targeted delivery systems, and reduced environmental impact. The development of biopesticides and integrated pest management (IPM) strategies is gaining traction, aligning with growing environmental concerns. Companies are investing in research and development to create innovative products that address specific pest problems, offering improved crop protection and reduced pesticide usage. These innovations are driving market growth and reshaping the competitive landscape.
Report Scope & Segmentation Analysis
This report segments the insecticides market based on application mode (chemigation, foliar, fumigation, seed treatment, soil treatment) and crop type (commercial crops, fruits & vegetables, grains & cereals, pulses & oilseeds, turf & ornamental). Each segment’s market size, growth projections, and competitive dynamics are analyzed in detail. The report provides insights into the historical period (2019-2024), base year (2025), and forecast period (2025-2033). Detailed regional breakdowns are also included, providing a comprehensive overview of the global market.
Key Drivers of Insecticides Industry Growth
The growth of the insecticides industry is primarily driven by several key factors: the rising global population necessitates increased food production, leading to greater demand for crop protection; the prevalence of insect pests continues to threaten crop yields, driving demand for effective insecticides; advancements in insecticide technology, offering better efficacy and environmental compatibility, are attracting consumers and regulatory bodies. Moreover, increasing investments in agricultural research and development are fueling product innovation and market growth.
Challenges in the Insecticides Industry Sector
The insecticides industry faces several challenges, including stringent regulations on pesticide use, which limit product approvals and increase compliance costs; supply chain disruptions and price volatility for raw materials impact production costs and profitability; intense competition among established players and the entry of new competitors create a challenging market environment. Further, concerns about environmental impact and human health are driving demand for safer alternatives, posing a threat to traditional chemical insecticides.
Emerging Opportunities in Insecticides Industry
Emerging opportunities lie in the development of biopesticides and other environmentally friendly solutions. This trend is driven by growing environmental awareness and stricter regulations. Further, precision agriculture technologies, which enable targeted pesticide application, are gaining traction, offering improved efficiency and reduced environmental impact. Expanding into emerging markets, particularly in developing regions with growing agricultural sectors, represents another significant opportunity for growth.
Leading Players in the Insecticides Industry Market
- FMC Corporation
- Sumitomo Chemical Co Ltd
- ADAMA Agricultural Solutions Ltd
- Bayer AG
- UPL Limited
- Syngenta Group
- Jiangsu Yangnong Chemical Co Ltd
- Corteva Agriscience
- Nufarm Ltd
- BASF SE
Key Developments in Insecticides Industry
- September 2022: FMC launched Talstar Plus Insecticide for groundnut, cotton, and sugarcane crops in India.
- September 2022: FMC India launched Corprima insecticide combining Rynaxypyr technology for fruit borer control.
- January 2023: Bayer partnered with Oerth Bio to develop eco-friendly crop protection solutions.
Future Outlook for Insecticides Industry Market
The insecticides market is poised for continued growth, driven by increasing food demand, technological advancements, and expansion into new markets. Strategic investments in research and development, focusing on sustainable and eco-friendly solutions, will be crucial for success. Companies that adapt to evolving regulatory landscapes and consumer preferences will be best positioned to capitalize on the market's future potential. The integration of precision agriculture technologies and data analytics will further enhance efficiency and sustainability within the industry.
Insecticides Industry Segmentation
-
1. Application Mode
- 1.1. Chemigation
- 1.2. Foliar
- 1.3. Fumigation
- 1.4. Seed Treatment
- 1.5. Soil Treatment
-
2. Crop Type
- 2.1. Commercial Crops
- 2.2. Fruits & Vegetables
- 2.3. Grains & Cereals
- 2.4. Pulses & Oilseeds
- 2.5. Turf & Ornamental
-
3. Application Mode
- 3.1. Chemigation
- 3.2. Foliar
- 3.3. Fumigation
- 3.4. Seed Treatment
- 3.5. Soil Treatment
-
4. Crop Type
- 4.1. Commercial Crops
- 4.2. Fruits & Vegetables
- 4.3. Grains & Cereals
- 4.4. Pulses & Oilseeds
- 4.5. Turf & Ornamental
Insecticides Industry Segmentation By Geography
-
1. North America
- 1.1. United States
- 1.2. Canada
- 1.3. Mexico
-
2. South America
- 2.1. Brazil
- 2.2. Argentina
- 2.3. Rest of South America
-
3. Europe
- 3.1. United Kingdom
- 3.2. Germany
- 3.3. France
- 3.4. Italy
- 3.5. Spain
- 3.6. Russia
- 3.7. Benelux
- 3.8. Nordics
- 3.9. Rest of Europe
-
4. Middle East & Africa
- 4.1. Turkey
- 4.2. Israel
- 4.3. GCC
- 4.4. North Africa
- 4.5. South Africa
- 4.6. Rest of Middle East & Africa
-
5. Asia Pacific
- 5.1. China
- 5.2. India
- 5.3. Japan
- 5.4. South Korea
- 5.5. ASEAN
- 5.6. Oceania
- 5.7. Rest of Asia Pacific
Insecticides Industry Regional Market Share
Geographic Coverage of Insecticides Industry
Insecticides Industry REPORT HIGHLIGHTS
| Aspects | Details |
|---|---|
| Study Period | 2020-2034 |
| Base Year | 2025 |
| Estimated Year | 2026 |
| Forecast Period | 2026-2034 |
| Historical Period | 2020-2025 |
| Growth Rate | CAGR of 14.25% from 2020-2034 |
| Segmentation |
|
Table of Contents
- 1. Introduction
- 1.1. Research Scope
- 1.2. Market Segmentation
- 1.3. Research Objective
- 1.4. Definitions and Assumptions
- 2. Executive Summary
- 2.1. Market Snapshot
- 3. Market Dynamics
- 3.1. Market Drivers
- 3.2. Market Restrains
- 3.3. Market Trends
- 3.4. Market Opportunities
- 4. Market Factor Analysis
- 4.1. Porters Five Forces
- 4.1.1. Bargaining Power of Suppliers
- 4.1.2. Bargaining Power of Buyers
- 4.1.3. Threat of New Entrants
- 4.1.4. Threat of Substitutes
- 4.1.5. Competitive Rivalry
- 4.2. PESTEL analysis
- 4.3. BCG Analysis
- 4.3.1. Stars (High Growth, High Market Share)
- 4.3.2. Cash Cows (Low Growth, High Market Share)
- 4.3.3. Question Mark (High Growth, Low Market Share)
- 4.3.4. Dogs (Low Growth, Low Market Share)
- 4.4. Ansoff Matrix Analysis
- 4.5. Supply Chain Analysis
- 4.6. Regulatory Landscape
- 4.7. Current Market Potential and Opportunity Assessment (TAM–SAM–SOM Framework)
- 4.8. PRI Analyst Note
- 4.1. Porters Five Forces
- 5. Market Analysis, Insights and Forecast 2021-2033
- 5.1. Market Analysis, Insights and Forecast - by Application Mode
- 5.1.1. Chemigation
- 5.1.2. Foliar
- 5.1.3. Fumigation
- 5.1.4. Seed Treatment
- 5.1.5. Soil Treatment
- 5.2. Market Analysis, Insights and Forecast - by Crop Type
- 5.2.1. Commercial Crops
- 5.2.2. Fruits & Vegetables
- 5.2.3. Grains & Cereals
- 5.2.4. Pulses & Oilseeds
- 5.2.5. Turf & Ornamental
- 5.3. Market Analysis, Insights and Forecast - by Application Mode
- 5.3.1. Chemigation
- 5.3.2. Foliar
- 5.3.3. Fumigation
- 5.3.4. Seed Treatment
- 5.3.5. Soil Treatment
- 5.4. Market Analysis, Insights and Forecast - by Crop Type
- 5.4.1. Commercial Crops
- 5.4.2. Fruits & Vegetables
- 5.4.3. Grains & Cereals
- 5.4.4. Pulses & Oilseeds
- 5.4.5. Turf & Ornamental
- 5.5. Market Analysis, Insights and Forecast - by Region
- 5.5.1. North America
- 5.5.2. South America
- 5.5.3. Europe
- 5.5.4. Middle East & Africa
- 5.5.5. Asia Pacific
- 5.1. Market Analysis, Insights and Forecast - by Application Mode
- 6. Global Insecticides Industry Analysis, Insights and Forecast, 2021-2033
- 6.1. Market Analysis, Insights and Forecast - by Application Mode
- 6.1.1. Chemigation
- 6.1.2. Foliar
- 6.1.3. Fumigation
- 6.1.4. Seed Treatment
- 6.1.5. Soil Treatment
- 6.2. Market Analysis, Insights and Forecast - by Crop Type
- 6.2.1. Commercial Crops
- 6.2.2. Fruits & Vegetables
- 6.2.3. Grains & Cereals
- 6.2.4. Pulses & Oilseeds
- 6.2.5. Turf & Ornamental
- 6.3. Market Analysis, Insights and Forecast - by Application Mode
- 6.3.1. Chemigation
- 6.3.2. Foliar
- 6.3.3. Fumigation
- 6.3.4. Seed Treatment
- 6.3.5. Soil Treatment
- 6.4. Market Analysis, Insights and Forecast - by Crop Type
- 6.4.1. Commercial Crops
- 6.4.2. Fruits & Vegetables
- 6.4.3. Grains & Cereals
- 6.4.4. Pulses & Oilseeds
- 6.4.5. Turf & Ornamental
- 6.1. Market Analysis, Insights and Forecast - by Application Mode
- 7. North America Insecticides Industry Analysis, Insights and Forecast, 2020-2032
- 7.1. Market Analysis, Insights and Forecast - by Application Mode
- 7.1.1. Chemigation
- 7.1.2. Foliar
- 7.1.3. Fumigation
- 7.1.4. Seed Treatment
- 7.1.5. Soil Treatment
- 7.2. Market Analysis, Insights and Forecast - by Crop Type
- 7.2.1. Commercial Crops
- 7.2.2. Fruits & Vegetables
- 7.2.3. Grains & Cereals
- 7.2.4. Pulses & Oilseeds
- 7.2.5. Turf & Ornamental
- 7.3. Market Analysis, Insights and Forecast - by Application Mode
- 7.3.1. Chemigation
- 7.3.2. Foliar
- 7.3.3. Fumigation
- 7.3.4. Seed Treatment
- 7.3.5. Soil Treatment
- 7.4. Market Analysis, Insights and Forecast - by Crop Type
- 7.4.1. Commercial Crops
- 7.4.2. Fruits & Vegetables
- 7.4.3. Grains & Cereals
- 7.4.4. Pulses & Oilseeds
- 7.4.5. Turf & Ornamental
- 7.1. Market Analysis, Insights and Forecast - by Application Mode
- 8. South America Insecticides Industry Analysis, Insights and Forecast, 2020-2032
- 8.1. Market Analysis, Insights and Forecast - by Application Mode
- 8.1.1. Chemigation
- 8.1.2. Foliar
- 8.1.3. Fumigation
- 8.1.4. Seed Treatment
- 8.1.5. Soil Treatment
- 8.2. Market Analysis, Insights and Forecast - by Crop Type
- 8.2.1. Commercial Crops
- 8.2.2. Fruits & Vegetables
- 8.2.3. Grains & Cereals
- 8.2.4. Pulses & Oilseeds
- 8.2.5. Turf & Ornamental
- 8.3. Market Analysis, Insights and Forecast - by Application Mode
- 8.3.1. Chemigation
- 8.3.2. Foliar
- 8.3.3. Fumigation
- 8.3.4. Seed Treatment
- 8.3.5. Soil Treatment
- 8.4. Market Analysis, Insights and Forecast - by Crop Type
- 8.4.1. Commercial Crops
- 8.4.2. Fruits & Vegetables
- 8.4.3. Grains & Cereals
- 8.4.4. Pulses & Oilseeds
- 8.4.5. Turf & Ornamental
- 8.1. Market Analysis, Insights and Forecast - by Application Mode
- 9. Europe Insecticides Industry Analysis, Insights and Forecast, 2020-2032
- 9.1. Market Analysis, Insights and Forecast - by Application Mode
- 9.1.1. Chemigation
- 9.1.2. Foliar
- 9.1.3. Fumigation
- 9.1.4. Seed Treatment
- 9.1.5. Soil Treatment
- 9.2. Market Analysis, Insights and Forecast - by Crop Type
- 9.2.1. Commercial Crops
- 9.2.2. Fruits & Vegetables
- 9.2.3. Grains & Cereals
- 9.2.4. Pulses & Oilseeds
- 9.2.5. Turf & Ornamental
- 9.3. Market Analysis, Insights and Forecast - by Application Mode
- 9.3.1. Chemigation
- 9.3.2. Foliar
- 9.3.3. Fumigation
- 9.3.4. Seed Treatment
- 9.3.5. Soil Treatment
- 9.4. Market Analysis, Insights and Forecast - by Crop Type
- 9.4.1. Commercial Crops
- 9.4.2. Fruits & Vegetables
- 9.4.3. Grains & Cereals
- 9.4.4. Pulses & Oilseeds
- 9.4.5. Turf & Ornamental
- 9.1. Market Analysis, Insights and Forecast - by Application Mode
- 10. Middle East & Africa Insecticides Industry Analysis, Insights and Forecast, 2020-2032
- 10.1. Market Analysis, Insights and Forecast - by Application Mode
- 10.1.1. Chemigation
- 10.1.2. Foliar
- 10.1.3. Fumigation
- 10.1.4. Seed Treatment
- 10.1.5. Soil Treatment
- 10.2. Market Analysis, Insights and Forecast - by Crop Type
- 10.2.1. Commercial Crops
- 10.2.2. Fruits & Vegetables
- 10.2.3. Grains & Cereals
- 10.2.4. Pulses & Oilseeds
- 10.2.5. Turf & Ornamental
- 10.3. Market Analysis, Insights and Forecast - by Application Mode
- 10.3.1. Chemigation
- 10.3.2. Foliar
- 10.3.3. Fumigation
- 10.3.4. Seed Treatment
- 10.3.5. Soil Treatment
- 10.4. Market Analysis, Insights and Forecast - by Crop Type
- 10.4.1. Commercial Crops
- 10.4.2. Fruits & Vegetables
- 10.4.3. Grains & Cereals
- 10.4.4. Pulses & Oilseeds
- 10.4.5. Turf & Ornamental
- 10.1. Market Analysis, Insights and Forecast - by Application Mode
- 11. Asia Pacific Insecticides Industry Analysis, Insights and Forecast, 2020-2032
- 11.1. Market Analysis, Insights and Forecast - by Application Mode
- 11.1.1. Chemigation
- 11.1.2. Foliar
- 11.1.3. Fumigation
- 11.1.4. Seed Treatment
- 11.1.5. Soil Treatment
- 11.2. Market Analysis, Insights and Forecast - by Crop Type
- 11.2.1. Commercial Crops
- 11.2.2. Fruits & Vegetables
- 11.2.3. Grains & Cereals
- 11.2.4. Pulses & Oilseeds
- 11.2.5. Turf & Ornamental
- 11.3. Market Analysis, Insights and Forecast - by Application Mode
- 11.3.1. Chemigation
- 11.3.2. Foliar
- 11.3.3. Fumigation
- 11.3.4. Seed Treatment
- 11.3.5. Soil Treatment
- 11.4. Market Analysis, Insights and Forecast - by Crop Type
- 11.4.1. Commercial Crops
- 11.4.2. Fruits & Vegetables
- 11.4.3. Grains & Cereals
- 11.4.4. Pulses & Oilseeds
- 11.4.5. Turf & Ornamental
- 11.1. Market Analysis, Insights and Forecast - by Application Mode
- 12. Competitive Analysis
- 12.1. Company Profiles
- 12.1.1 FMC Corporation
- 12.1.1.1. Company Overview
- 12.1.1.2. Products
- 12.1.1.3. Company Financials
- 12.1.1.4. SWOT Analysis
- 12.1.2 Sumitomo Chemical Co Ltd
- 12.1.2.1. Company Overview
- 12.1.2.2. Products
- 12.1.2.3. Company Financials
- 12.1.2.4. SWOT Analysis
- 12.1.3 ADAMA Agricultural Solutions Ltd
- 12.1.3.1. Company Overview
- 12.1.3.2. Products
- 12.1.3.3. Company Financials
- 12.1.3.4. SWOT Analysis
- 12.1.4 Bayer AG
- 12.1.4.1. Company Overview
- 12.1.4.2. Products
- 12.1.4.3. Company Financials
- 12.1.4.4. SWOT Analysis
- 12.1.5 UPL Limite
- 12.1.5.1. Company Overview
- 12.1.5.2. Products
- 12.1.5.3. Company Financials
- 12.1.5.4. SWOT Analysis
- 12.1.6 Syngenta Group
- 12.1.6.1. Company Overview
- 12.1.6.2. Products
- 12.1.6.3. Company Financials
- 12.1.6.4. SWOT Analysis
- 12.1.7 Jiangsu Yangnong Chemical Co Ltd
- 12.1.7.1. Company Overview
- 12.1.7.2. Products
- 12.1.7.3. Company Financials
- 12.1.7.4. SWOT Analysis
- 12.1.8 Corteva Agriscience
- 12.1.8.1. Company Overview
- 12.1.8.2. Products
- 12.1.8.3. Company Financials
- 12.1.8.4. SWOT Analysis
- 12.1.9 Nufarm Ltd
- 12.1.9.1. Company Overview
- 12.1.9.2. Products
- 12.1.9.3. Company Financials
- 12.1.9.4. SWOT Analysis
- 12.1.10 BASF SE
- 12.1.10.1. Company Overview
- 12.1.10.2. Products
- 12.1.10.3. Company Financials
- 12.1.10.4. SWOT Analysis
- 12.1.1 FMC Corporation
- 12.2. Market Entropy
- 12.2.1 Company's Key Areas Served
- 12.2.2 Recent Developments
- 12.3. Company Market Share Analysis 2025
- 12.3.1 Top 5 Companies Market Share Analysis
- 12.3.2 Top 3 Companies Market Share Analysis
- 12.4. List of Potential Customers
- 13. Research Methodology
List of Figures
- Figure 1: Global Insecticides Industry Revenue Breakdown (billion, %) by Region 2025 & 2033
- Figure 2: North America Insecticides Industry Revenue (billion), by Application Mode 2025 & 2033
- Figure 3: North America Insecticides Industry Revenue Share (%), by Application Mode 2025 & 2033
- Figure 4: North America Insecticides Industry Revenue (billion), by Crop Type 2025 & 2033
- Figure 5: North America Insecticides Industry Revenue Share (%), by Crop Type 2025 & 2033
- Figure 6: North America Insecticides Industry Revenue (billion), by Application Mode 2025 & 2033
- Figure 7: North America Insecticides Industry Revenue Share (%), by Application Mode 2025 & 2033
- Figure 8: North America Insecticides Industry Revenue (billion), by Crop Type 2025 & 2033
- Figure 9: North America Insecticides Industry Revenue Share (%), by Crop Type 2025 & 2033
- Figure 10: North America Insecticides Industry Revenue (billion), by Country 2025 & 2033
- Figure 11: North America Insecticides Industry Revenue Share (%), by Country 2025 & 2033
- Figure 12: South America Insecticides Industry Revenue (billion), by Application Mode 2025 & 2033
- Figure 13: South America Insecticides Industry Revenue Share (%), by Application Mode 2025 & 2033
- Figure 14: South America Insecticides Industry Revenue (billion), by Crop Type 2025 & 2033
- Figure 15: South America Insecticides Industry Revenue Share (%), by Crop Type 2025 & 2033
- Figure 16: South America Insecticides Industry Revenue (billion), by Application Mode 2025 & 2033
- Figure 17: South America Insecticides Industry Revenue Share (%), by Application Mode 2025 & 2033
- Figure 18: South America Insecticides Industry Revenue (billion), by Crop Type 2025 & 2033
- Figure 19: South America Insecticides Industry Revenue Share (%), by Crop Type 2025 & 2033
- Figure 20: South America Insecticides Industry Revenue (billion), by Country 2025 & 2033
- Figure 21: South America Insecticides Industry Revenue Share (%), by Country 2025 & 2033
- Figure 22: Europe Insecticides Industry Revenue (billion), by Application Mode 2025 & 2033
- Figure 23: Europe Insecticides Industry Revenue Share (%), by Application Mode 2025 & 2033
- Figure 24: Europe Insecticides Industry Revenue (billion), by Crop Type 2025 & 2033
- Figure 25: Europe Insecticides Industry Revenue Share (%), by Crop Type 2025 & 2033
- Figure 26: Europe Insecticides Industry Revenue (billion), by Application Mode 2025 & 2033
- Figure 27: Europe Insecticides Industry Revenue Share (%), by Application Mode 2025 & 2033
- Figure 28: Europe Insecticides Industry Revenue (billion), by Crop Type 2025 & 2033
- Figure 29: Europe Insecticides Industry Revenue Share (%), by Crop Type 2025 & 2033
- Figure 30: Europe Insecticides Industry Revenue (billion), by Country 2025 & 2033
- Figure 31: Europe Insecticides Industry Revenue Share (%), by Country 2025 & 2033
- Figure 32: Middle East & Africa Insecticides Industry Revenue (billion), by Application Mode 2025 & 2033
- Figure 33: Middle East & Africa Insecticides Industry Revenue Share (%), by Application Mode 2025 & 2033
- Figure 34: Middle East & Africa Insecticides Industry Revenue (billion), by Crop Type 2025 & 2033
- Figure 35: Middle East & Africa Insecticides Industry Revenue Share (%), by Crop Type 2025 & 2033
- Figure 36: Middle East & Africa Insecticides Industry Revenue (billion), by Application Mode 2025 & 2033
- Figure 37: Middle East & Africa Insecticides Industry Revenue Share (%), by Application Mode 2025 & 2033
- Figure 38: Middle East & Africa Insecticides Industry Revenue (billion), by Crop Type 2025 & 2033
- Figure 39: Middle East & Africa Insecticides Industry Revenue Share (%), by Crop Type 2025 & 2033
- Figure 40: Middle East & Africa Insecticides Industry Revenue (billion), by Country 2025 & 2033
- Figure 41: Middle East & Africa Insecticides Industry Revenue Share (%), by Country 2025 & 2033
- Figure 42: Asia Pacific Insecticides Industry Revenue (billion), by Application Mode 2025 & 2033
- Figure 43: Asia Pacific Insecticides Industry Revenue Share (%), by Application Mode 2025 & 2033
- Figure 44: Asia Pacific Insecticides Industry Revenue (billion), by Crop Type 2025 & 2033
- Figure 45: Asia Pacific Insecticides Industry Revenue Share (%), by Crop Type 2025 & 2033
- Figure 46: Asia Pacific Insecticides Industry Revenue (billion), by Application Mode 2025 & 2033
- Figure 47: Asia Pacific Insecticides Industry Revenue Share (%), by Application Mode 2025 & 2033
- Figure 48: Asia Pacific Insecticides Industry Revenue (billion), by Crop Type 2025 & 2033
- Figure 49: Asia Pacific Insecticides Industry Revenue Share (%), by Crop Type 2025 & 2033
- Figure 50: Asia Pacific Insecticides Industry Revenue (billion), by Country 2025 & 2033
- Figure 51: Asia Pacific Insecticides Industry Revenue Share (%), by Country 2025 & 2033
List of Tables
- Table 1: Global Insecticides Industry Revenue billion Forecast, by Application Mode 2020 & 2033
- Table 2: Global Insecticides Industry Revenue billion Forecast, by Crop Type 2020 & 2033
- Table 3: Global Insecticides Industry Revenue billion Forecast, by Application Mode 2020 & 2033
- Table 4: Global Insecticides Industry Revenue billion Forecast, by Crop Type 2020 & 2033
- Table 5: Global Insecticides Industry Revenue billion Forecast, by Region 2020 & 2033
- Table 6: Global Insecticides Industry Revenue billion Forecast, by Application Mode 2020 & 2033
- Table 7: Global Insecticides Industry Revenue billion Forecast, by Crop Type 2020 & 2033
- Table 8: Global Insecticides Industry Revenue billion Forecast, by Application Mode 2020 & 2033
- Table 9: Global Insecticides Industry Revenue billion Forecast, by Crop Type 2020 & 2033
- Table 10: Global Insecticides Industry Revenue billion Forecast, by Country 2020 & 2033
- Table 11: United States Insecticides Industry Revenue (billion) Forecast, by Application 2020 & 2033
- Table 12: Canada Insecticides Industry Revenue (billion) Forecast, by Application 2020 & 2033
- Table 13: Mexico Insecticides Industry Revenue (billion) Forecast, by Application 2020 & 2033
- Table 14: Global Insecticides Industry Revenue billion Forecast, by Application Mode 2020 & 2033
- Table 15: Global Insecticides Industry Revenue billion Forecast, by Crop Type 2020 & 2033
- Table 16: Global Insecticides Industry Revenue billion Forecast, by Application Mode 2020 & 2033
- Table 17: Global Insecticides Industry Revenue billion Forecast, by Crop Type 2020 & 2033
- Table 18: Global Insecticides Industry Revenue billion Forecast, by Country 2020 & 2033
- Table 19: Brazil Insecticides Industry Revenue (billion) Forecast, by Application 2020 & 2033
- Table 20: Argentina Insecticides Industry Revenue (billion) Forecast, by Application 2020 & 2033
- Table 21: Rest of South America Insecticides Industry Revenue (billion) Forecast, by Application 2020 & 2033
- Table 22: Global Insecticides Industry Revenue billion Forecast, by Application Mode 2020 & 2033
- Table 23: Global Insecticides Industry Revenue billion Forecast, by Crop Type 2020 & 2033
- Table 24: Global Insecticides Industry Revenue billion Forecast, by Application Mode 2020 & 2033
- Table 25: Global Insecticides Industry Revenue billion Forecast, by Crop Type 2020 & 2033
- Table 26: Global Insecticides Industry Revenue billion Forecast, by Country 2020 & 2033
- Table 27: United Kingdom Insecticides Industry Revenue (billion) Forecast, by Application 2020 & 2033
- Table 28: Germany Insecticides Industry Revenue (billion) Forecast, by Application 2020 & 2033
- Table 29: France Insecticides Industry Revenue (billion) Forecast, by Application 2020 & 2033
- Table 30: Italy Insecticides Industry Revenue (billion) Forecast, by Application 2020 & 2033
- Table 31: Spain Insecticides Industry Revenue (billion) Forecast, by Application 2020 & 2033
- Table 32: Russia Insecticides Industry Revenue (billion) Forecast, by Application 2020 & 2033
- Table 33: Benelux Insecticides Industry Revenue (billion) Forecast, by Application 2020 & 2033
- Table 34: Nordics Insecticides Industry Revenue (billion) Forecast, by Application 2020 & 2033
- Table 35: Rest of Europe Insecticides Industry Revenue (billion) Forecast, by Application 2020 & 2033
- Table 36: Global Insecticides Industry Revenue billion Forecast, by Application Mode 2020 & 2033
- Table 37: Global Insecticides Industry Revenue billion Forecast, by Crop Type 2020 & 2033
- Table 38: Global Insecticides Industry Revenue billion Forecast, by Application Mode 2020 & 2033
- Table 39: Global Insecticides Industry Revenue billion Forecast, by Crop Type 2020 & 2033
- Table 40: Global Insecticides Industry Revenue billion Forecast, by Country 2020 & 2033
- Table 41: Turkey Insecticides Industry Revenue (billion) Forecast, by Application 2020 & 2033
- Table 42: Israel Insecticides Industry Revenue (billion) Forecast, by Application 2020 & 2033
- Table 43: GCC Insecticides Industry Revenue (billion) Forecast, by Application 2020 & 2033
- Table 44: North Africa Insecticides Industry Revenue (billion) Forecast, by Application 2020 & 2033
- Table 45: South Africa Insecticides Industry Revenue (billion) Forecast, by Application 2020 & 2033
- Table 46: Rest of Middle East & Africa Insecticides Industry Revenue (billion) Forecast, by Application 2020 & 2033
- Table 47: Global Insecticides Industry Revenue billion Forecast, by Application Mode 2020 & 2033
- Table 48: Global Insecticides Industry Revenue billion Forecast, by Crop Type 2020 & 2033
- Table 49: Global Insecticides Industry Revenue billion Forecast, by Application Mode 2020 & 2033
- Table 50: Global Insecticides Industry Revenue billion Forecast, by Crop Type 2020 & 2033
- Table 51: Global Insecticides Industry Revenue billion Forecast, by Country 2020 & 2033
- Table 52: China Insecticides Industry Revenue (billion) Forecast, by Application 2020 & 2033
- Table 53: India Insecticides Industry Revenue (billion) Forecast, by Application 2020 & 2033
- Table 54: Japan Insecticides Industry Revenue (billion) Forecast, by Application 2020 & 2033
- Table 55: South Korea Insecticides Industry Revenue (billion) Forecast, by Application 2020 & 2033
- Table 56: ASEAN Insecticides Industry Revenue (billion) Forecast, by Application 2020 & 2033
- Table 57: Oceania Insecticides Industry Revenue (billion) Forecast, by Application 2020 & 2033
- Table 58: Rest of Asia Pacific Insecticides Industry Revenue (billion) Forecast, by Application 2020 & 2033
Frequently Asked Questions
1. What is the projected Compound Annual Growth Rate (CAGR) of the Insecticides Industry?
The projected CAGR is approximately 14.25%.
2. Which companies are prominent players in the Insecticides Industry?
Key companies in the market include FMC Corporation, Sumitomo Chemical Co Ltd, ADAMA Agricultural Solutions Ltd, Bayer AG, UPL Limite, Syngenta Group, Jiangsu Yangnong Chemical Co Ltd, Corteva Agriscience, Nufarm Ltd, BASF SE.
3. What are the main segments of the Insecticides Industry?
The market segments include Application Mode, Crop Type, Application Mode, Crop Type.
4. Can you provide details about the market size?
The market size is estimated to be USD 8.36 billion as of 2022.
5. What are some drivers contributing to market growth?
Seed Treatment As A Solution To Enhance Yield; Growing Awareness For Seed Treatment Among The Farmers; Rising Trend Of Organic Farming.
6. What are the notable trends driving market growth?
The expansion of cropland areas with changes in climate conditions is contributing to the growth of the market.
7. Are there any restraints impacting market growth?
Limitations Across Farm-Level Seed Treatment; Rising Environmental Concerns.
8. Can you provide examples of recent developments in the market?
January 2023: Bayer formed a new partnership with Oerth Bio to enhance crop protection technology and create more eco-friendly crop protection solutions.September 2022: FMC launched Talstar Plus Insecticide to protect Indian farmers of groundnut, cotton, and sugarcane crops from sucking and chewing pests.September 2022: FMC India launched Corprima, an insecticide that combines the company's Rynaxypyr insect control technology to provide crop protection against fruit borers, a major problem for Indian farmers.
9. What pricing options are available for accessing the report?
Pricing options include single-user, multi-user, and enterprise licenses priced at USD 3800, USD 4500, and USD 5800 respectively.
10. Is the market size provided in terms of value or volume?
The market size is provided in terms of value, measured in billion.
11. Are there any specific market keywords associated with the report?
Yes, the market keyword associated with the report is "Insecticides Industry," which aids in identifying and referencing the specific market segment covered.
12. How do I determine which pricing option suits my needs best?
The pricing options vary based on user requirements and access needs. Individual users may opt for single-user licenses, while businesses requiring broader access may choose multi-user or enterprise licenses for cost-effective access to the report.
13. Are there any additional resources or data provided in the Insecticides Industry report?
While the report offers comprehensive insights, it's advisable to review the specific contents or supplementary materials provided to ascertain if additional resources or data are available.
14. How can I stay updated on further developments or reports in the Insecticides Industry?
To stay informed about further developments, trends, and reports in the Insecticides Industry, consider subscribing to industry newsletters, following relevant companies and organizations, or regularly checking reputable industry news sources and publications.
Methodology
Step 1 - Identification of Relevant Samples Size from Population Database


Step 2 - Approaches for Defining Global Market Size (Value, Volume* & Price*)

Note*: In applicable scenarios
Step 3 - Data Sources
Primary Research
- Web Analytics
- Survey Reports
- Research Institute
- Latest Research Reports
- Opinion Leaders
Secondary Research
- Annual Reports
- White Paper
- Latest Press Release
- Industry Association
- Paid Database
- Investor Presentations

Step 4 - Data Triangulation
Involves using different sources of information in order to increase the validity of a study
These sources are likely to be stakeholders in a program - participants, other researchers, program staff, other community members, and so on.
Then we put all data in single framework & apply various statistical tools to find out the dynamic on the market.
During the analysis stage, feedback from the stakeholder groups would be compared to determine areas of agreement as well as areas of divergence

