

Key Insights
The global Instant Beverage Premixes market is poised for significant expansion, projected to reach an estimated $80.24 billion in 2025. This robust growth is underpinned by a compound annual growth rate (CAGR) of 7.3% anticipated over the forecast period from 2025 to 2033. A primary driver for this surge is the increasing consumer demand for convenience and quick preparation of beverages, aligning with the fast-paced lifestyles prevalent globally. The proliferation of ready-to-drink (RTD) options, coupled with advancements in formulation and packaging technologies, further fuels market expansion. Consumers are increasingly seeking specialized health drinks, functional beverages, and flavored options that offer a tailored experience, contributing to the diversification and growth of the instant beverage premixes sector.
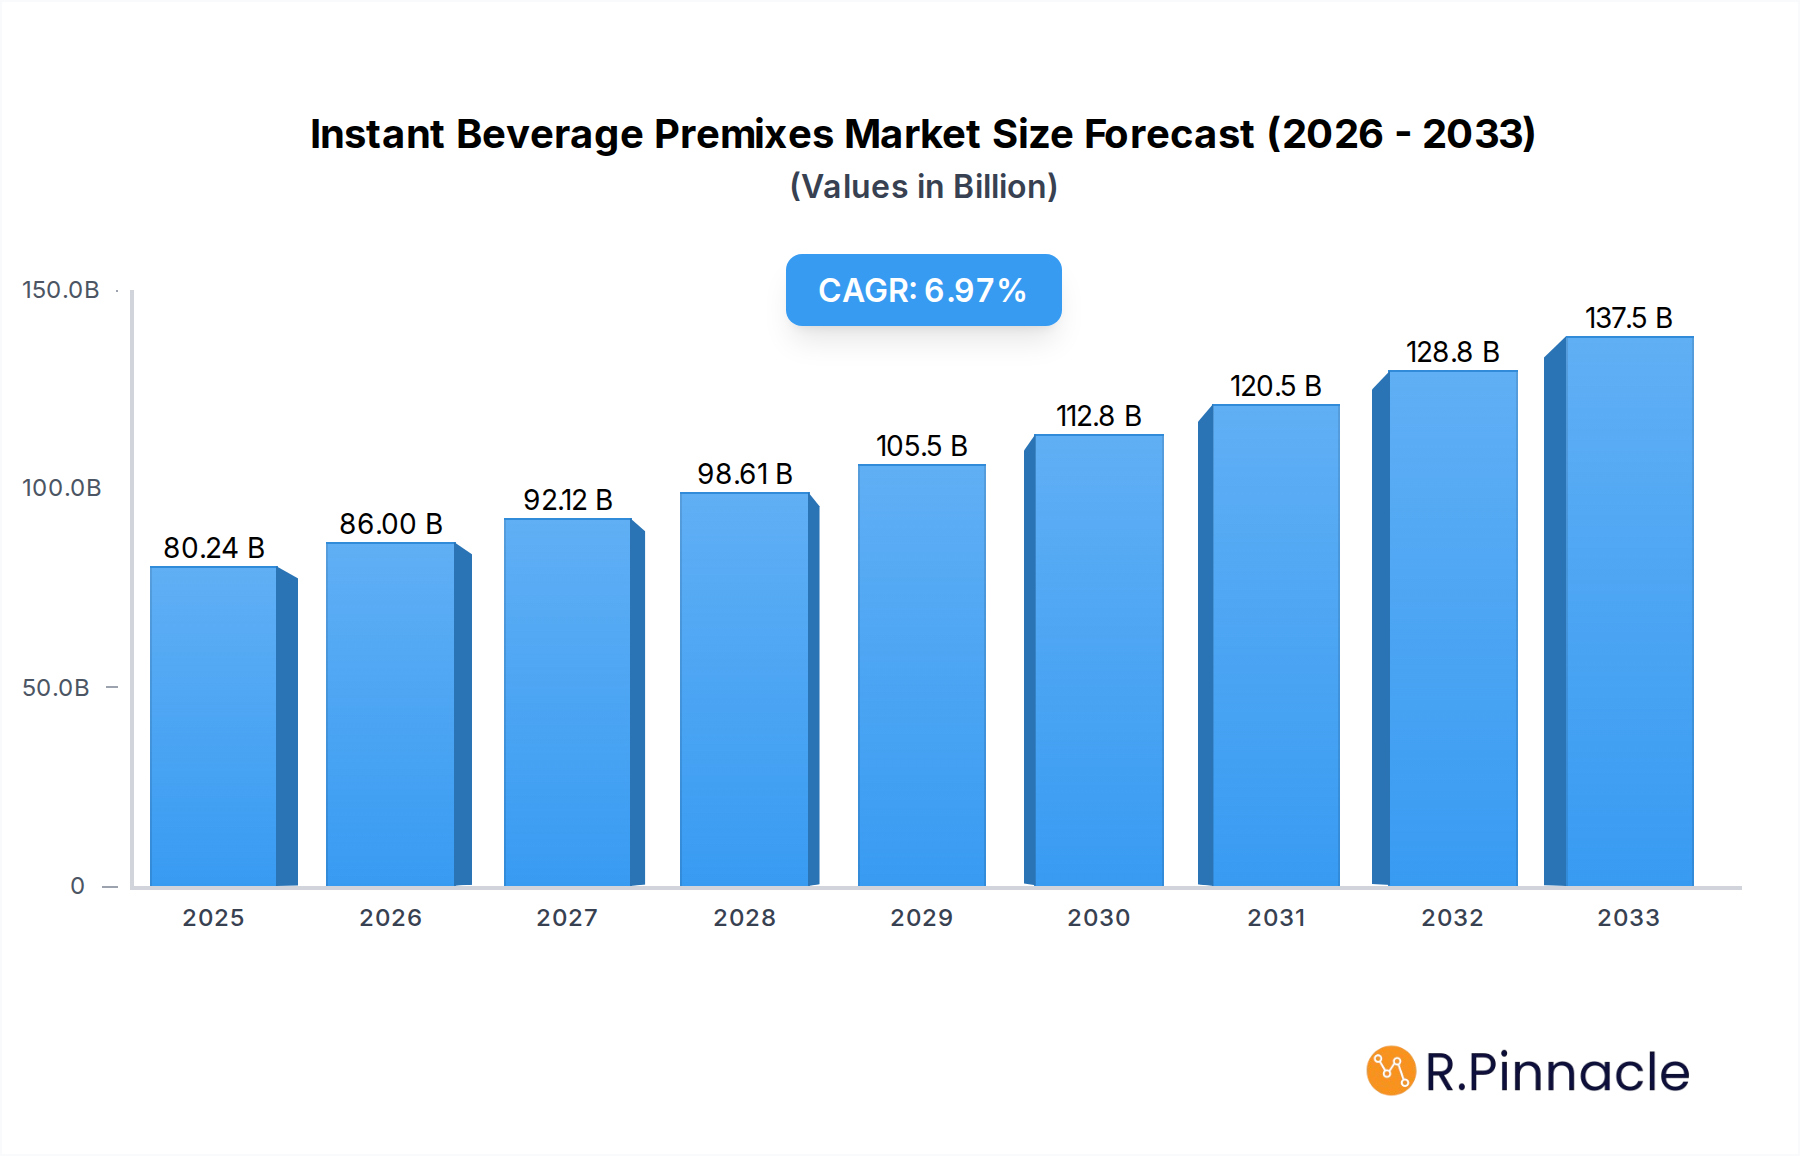
Instant Beverage Premixes Market Size (In Billion)
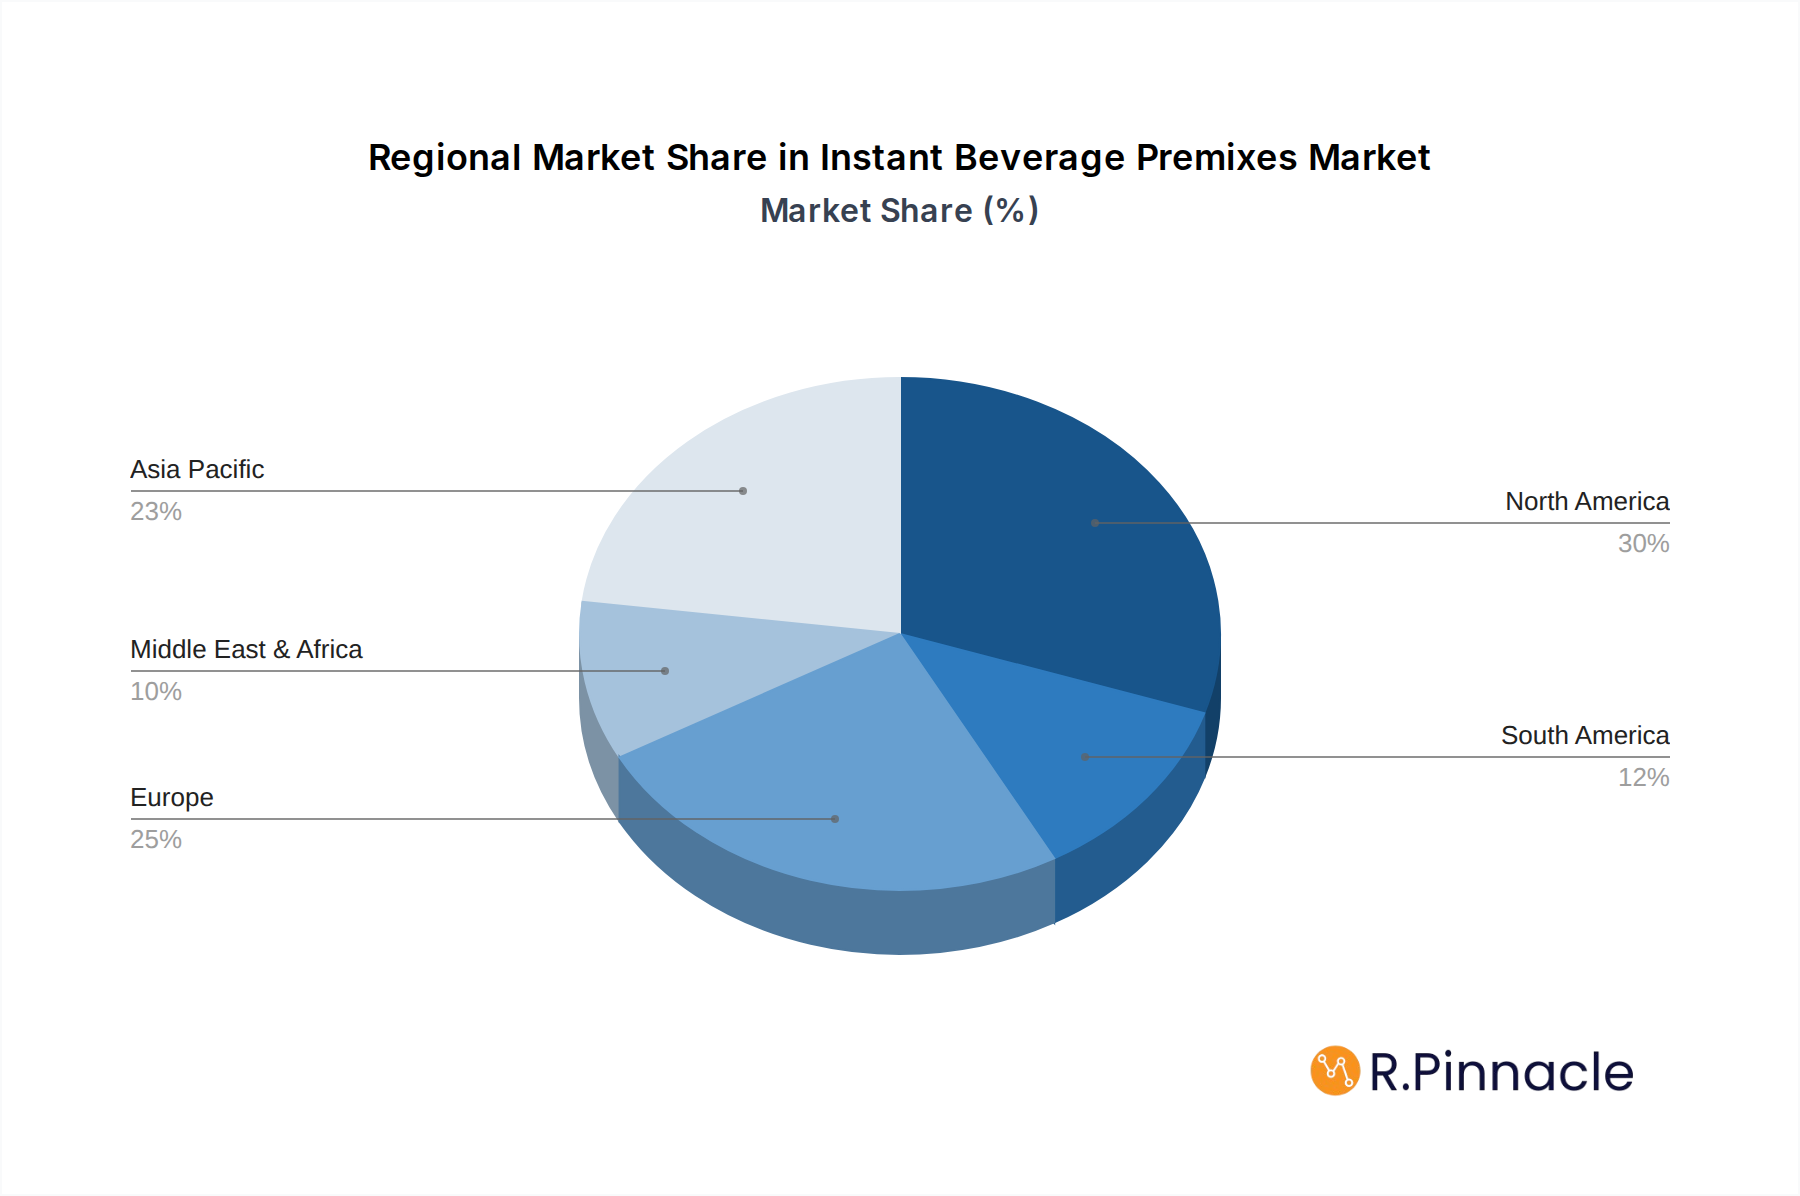
The market is segmented across various applications including instant coffee, instant tea, instant milk, instant health drinks, instant soup, and others. The "Others" category, encompassing novel and emerging instant beverage formats, is expected to show dynamic growth. Similarly, the "Flavored" segment is anticipated to outperform the "Plain" segment due to evolving consumer preferences for taste and variety. Geographically, the Asia Pacific region is anticipated to be a significant contributor to market growth, driven by a large and growing population, increasing disposable incomes, and a rising awareness of health and wellness trends. North America and Europe are also expected to maintain strong market positions due to established consumption patterns and ongoing innovation by key players such as Keurig Green Mountain, PepsiCo Inc., and The Republic of Tea.

Instant Beverage Premixes Company Market Share
This comprehensive market research report offers an in-depth analysis of the global Instant Beverage Premixes market, projecting significant growth and evolution. Covering the study period of 2019–2033, with a base year of 2025 and a forecast period from 2025–2033, this report provides critical insights for industry stakeholders aiming to capitalize on emerging trends and navigate market complexities. The historical period analyzed is 2019–2024.
Instant Beverage Premixes Market Structure & Innovation Trends
The global Instant Beverage Premixes market exhibits a moderate to high market concentration, with key players like Keurig Green Mountain (US) and PepsiCo Inc (US) holding substantial market shares, estimated to be in the billions. Innovation is a primary driver, fueled by advancements in encapsulation technologies, flavor development, and the increasing demand for healthier and functional beverage options. Regulatory frameworks, particularly concerning food safety and ingredient labeling, play a crucial role in shaping market entry and product development. Substitute products, such as ready-to-drink (RTD) beverages and powdered drink mixes, present a constant competitive pressure. End-user demographics are expanding, encompassing busy professionals, students, and health-conscious consumers seeking convenient and customizable beverage solutions. Mergers and acquisitions (M&A) activities are anticipated to remain robust, with an estimated M&A deal value exceeding $5 billion within the forecast period, aimed at expanding product portfolios and market reach.
- Market Concentration: Moderate to High
- Innovation Drivers: Functional ingredients, novel flavor profiles, sustainable packaging.
- Regulatory Frameworks: Food safety standards (e.g., FDA, EFSA), ingredient disclosure mandates.
- Product Substitutes: Ready-to-drink (RTD) beverages, traditional coffee/tea brewing.
- End-User Demographics: Millennials, Gen Z, health-conscious consumers, convenience seekers.
- M&A Activity: Expected to rise, with an estimated deal value of over $5 billion.
Instant Beverage Premixes Market Dynamics & Trends
The Instant Beverage Premixes market is poised for substantial expansion, driven by a confluence of factors. The Compound Annual Growth Rate (CAGR) is projected to be approximately 7.2% from 2025 to 2033, indicating a robust growth trajectory. Market penetration is expected to reach over 60% in developed economies by 2033, showcasing the increasing adoption of these convenient solutions. Technological advancements in spray drying, freeze-drying, and agglomeration techniques are enhancing the quality, solubility, and shelf-life of premixes, directly contributing to market growth. The escalating demand for personalized nutrition and functional beverages, fortified with vitamins, minerals, and botanical extracts, is a significant trend. Consumer preferences are shifting towards healthier options, leading to a surge in demand for low-sugar, natural, and organic premixes. Competitive dynamics are characterized by intense product innovation, strategic partnerships, and aggressive marketing campaigns by major players. The rise of e-commerce channels has also significantly boosted market reach and accessibility. The convenience factor remains paramount, with consumers increasingly valuing quick preparation times and portability. The growing disposable income in emerging economies further fuels the demand for premium and innovative beverage solutions.
Dominant Regions & Segments in Instant Beverage Premixes
North America currently dominates the Instant Beverage Premixes market, driven by the established presence of key players like Keurig Green Mountain (US) and PepsiCo Inc (US), and a strong consumer preference for convenience and variety. The United States, in particular, represents a significant market due to high disposable incomes and a well-developed retail infrastructure.
Application Segmentation:
- Instant Coffee: This segment holds the largest market share, estimated to be over $15 billion in 2025. The demand is fueled by the ubiquitous nature of coffee consumption and the desire for quick preparation at home and in offices. Leading companies like Ito En (Japan) and Ajinomoto General Foods Inc (Japan) are key contributors to this segment's growth.
- Instant Tea: Following closely, the Instant Tea segment is expected to reach over $12 billion by 2025. Growing health consciousness and the popularity of iced tea and specialty tea blends are driving this growth. The Republic of Tea (US) is a prominent player in this space.
- Instant Milk: This segment, including milk-based beverage mixes and infant formula premixes, is projected to grow at a steady pace, driven by infant nutrition needs and the demand for convenient dairy alternatives.
- Instant Health Drinks: Experiencing rapid growth, this segment is projected to exceed $8 billion by 2025, propelled by the increasing consumer focus on wellness, immunity boosting, and specialized nutritional needs. Monster Beverage Co (US) is a significant player with its energy drink premixes.
- Instant Soup: While a niche segment, Instant Soup premixes cater to the demand for quick and easy meal solutions, particularly in busy households.
- Others: This category encompasses a range of premixes for hot chocolate, smoothies, and specialty beverages, reflecting a growing trend towards personalized and diverse beverage experiences.
Type Segmentation:
- Flavored: This segment currently holds a larger market share, estimated to be over $30 billion in 2025, owing to the wide array of taste options appealing to a broader consumer base.
- Plain: The Plain segment, though smaller, is experiencing steady growth, driven by consumers who prefer to add their own sweeteners and flavorings, emphasizing customization and control over ingredients.
Instant Beverage Premixes Product Innovations
The Instant Beverage Premixes sector is witnessing a surge in product innovations driven by consumer demand for enhanced functionality, improved taste, and convenience. Companies are developing premixes fortified with probiotics, prebiotics, adaptogens, and other functional ingredients to cater to the growing wellness market. Advancements in flavor encapsulation technology are enabling the creation of more authentic and long-lasting taste profiles. Furthermore, the development of plant-based and allergen-free premixes is expanding the market reach to cater to diverse dietary needs. These innovations offer a competitive advantage by addressing specific consumer pain points and creating new market opportunities.
Report Scope & Segmentation Analysis
This report meticulously segments the Instant Beverage Premixes market across key applications and types.
- Application Segments: The Instant Coffee segment, projected to reach over $25 billion by 2033, will continue its dominance due to widespread consumption. Instant Tea is expected to exhibit a CAGR of approximately 6.8%. Instant Milk premixes are set for consistent growth, driven by infant nutrition and dairy alternative trends. The Instant Health Drinks segment is poised for the highest growth rate, projected to exceed $15 billion by 2033, driven by the surging demand for functional beverages. Instant Soup and Others represent niche but evolving segments with promising potential.
- Type Segments: The Flavored premixes segment, estimated at over $50 billion by 2033, will maintain its leadership. The Plain premixes segment, while smaller, is projected to grow at a CAGR of around 6.5%, fueled by customization trends.
Key Drivers of Instant Beverage Premixes Growth
The Instant Beverage Premixes market is propelled by several key drivers. Technological advancements in processing and formulation are enhancing product quality and variety. The increasing demand for convenience and time-saving solutions among busy consumers is a significant factor. Growing health and wellness trends, leading to a demand for functional and fortified beverages, are further accelerating growth. Rising disposable incomes globally, especially in emerging economies, are enabling consumers to opt for premium and innovative beverage premixes. E-commerce expansion is improving accessibility and reach.
Challenges in the Instant Beverage Premixes Sector
Despite robust growth, the Instant Beverage Premixes sector faces several challenges. Stringent regulatory landscapes concerning food safety, ingredient sourcing, and labeling can hinder product development and market entry. Fluctuations in raw material prices, such as coffee beans and tea leaves, can impact profitability. Intense competition from established players and new entrants necessitates continuous innovation and competitive pricing strategies. Consumer perception regarding the quality and taste of some instant products remains a concern, requiring ongoing efforts to enhance product offerings.
Emerging Opportunities in Instant Beverage Premixes
Emerging opportunities abound in the Instant Beverage Premixes market. The growing demand for sustainable and ethically sourced ingredients presents a significant opportunity for eco-conscious brands. Expansion into untapped emerging markets with rising disposable incomes and a growing middle class offers substantial growth potential. The development of personalized nutrition premixes tailored to specific health needs and dietary preferences is a burgeoning trend. Innovations in plant-based and vegan premixes are catering to a rapidly expanding consumer base.
Leading Players in the Instant Beverage Premixes Market
- The Republic of Tea
- Keurig Green Mountain
- Ito En
- PepsiCo Inc
- Ajinomoto General Foods Inc
- Suntory Beverage & Food Limited
- Monster Beverage Co
Key Developments in Instant Beverage Premixes Industry
- 2023/01: Keurig Green Mountain launches a new line of plant-based coffee creamers in premix format, responding to growing consumer demand for dairy alternatives.
- 2023/04: PepsiCo Inc announces strategic investment in a sustainable sourcing initiative for its cocoa powder used in chocolate beverage premixes.
- 2023/07: Ito En introduces a range of functional instant green tea premixes fortified with L-theanine for enhanced cognitive benefits.
- 2023/10: Monster Beverage Co expands its portfolio with the introduction of energy drink premixes designed for at-home preparation.
- 2024/02: Suntory Beverage & Food Limited announces a partnership with a technology firm to develop advanced flavor encapsulation for its tea premixes.
Future Outlook for Instant Beverage Premixes Market
The future outlook for the Instant Beverage Premixes market is exceptionally bright. The market is expected to witness sustained growth, driven by continued innovation in functional ingredients, natural formulations, and personalized nutrition. The increasing consumer preference for convenience, coupled with the expansion of e-commerce channels, will further fuel demand. Strategic collaborations and mergers will continue to shape the competitive landscape, leading to greater market consolidation and expansion. The focus on sustainability and ethical sourcing will become a critical differentiator, influencing brand loyalty and market positioning. The market is projected to exceed $100 billion by 2033, presenting substantial opportunities for both established players and agile newcomers.
Instant Beverage Premixes Segmentation
-
1. Application
- 1.1. Instant Coffee
- 1.2. Instant Tea
- 1.3. Instant Milk
- 1.4. Instant Health Drinks
- 1.5. Instant Soup
- 1.6. Others
-
2. Type
- 2.1. Plain
- 2.2. Flavored
Instant Beverage Premixes Segmentation By Geography
-
1. North America
- 1.1. United States
- 1.2. Canada
- 1.3. Mexico
-
2. South America
- 2.1. Brazil
- 2.2. Argentina
- 2.3. Rest of South America
-
3. Europe
- 3.1. United Kingdom
- 3.2. Germany
- 3.3. France
- 3.4. Italy
- 3.5. Spain
- 3.6. Russia
- 3.7. Benelux
- 3.8. Nordics
- 3.9. Rest of Europe
-
4. Middle East & Africa
- 4.1. Turkey
- 4.2. Israel
- 4.3. GCC
- 4.4. North Africa
- 4.5. South Africa
- 4.6. Rest of Middle East & Africa
-
5. Asia Pacific
- 5.1. China
- 5.2. India
- 5.3. Japan
- 5.4. South Korea
- 5.5. ASEAN
- 5.6. Oceania
- 5.7. Rest of Asia Pacific
Instant Beverage Premixes Regional Market Share
Geographic Coverage of Instant Beverage Premixes
Instant Beverage Premixes REPORT HIGHLIGHTS
| Aspects | Details |
|---|---|
| Study Period | 2020-2034 |
| Base Year | 2025 |
| Estimated Year | 2026 |
| Forecast Period | 2026-2034 |
| Historical Period | 2020-2025 |
| Growth Rate | CAGR of 7.3% from 2020-2034 |
| Segmentation |
|
Table of Contents
- 1. Introduction
- 1.1. Research Scope
- 1.2. Market Segmentation
- 1.3. Research Methodology
- 1.4. Definitions and Assumptions
- 2. Executive Summary
- 2.1. Introduction
- 3. Market Dynamics
- 3.1. Introduction
- 3.2. Market Drivers
- 3.3. Market Restrains
- 3.4. Market Trends
- 4. Market Factor Analysis
- 4.1. Porters Five Forces
- 4.2. Supply/Value Chain
- 4.3. PESTEL analysis
- 4.4. Market Entropy
- 4.5. Patent/Trademark Analysis
- 5. Global Instant Beverage Premixes Analysis, Insights and Forecast, 2020-2032
- 5.1. Market Analysis, Insights and Forecast - by Application
- 5.1.1. Instant Coffee
- 5.1.2. Instant Tea
- 5.1.3. Instant Milk
- 5.1.4. Instant Health Drinks
- 5.1.5. Instant Soup
- 5.1.6. Others
- 5.2. Market Analysis, Insights and Forecast - by Type
- 5.2.1. Plain
- 5.2.2. Flavored
- 5.3. Market Analysis, Insights and Forecast - by Region
- 5.3.1. North America
- 5.3.2. South America
- 5.3.3. Europe
- 5.3.4. Middle East & Africa
- 5.3.5. Asia Pacific
- 5.1. Market Analysis, Insights and Forecast - by Application
- 6. North America Instant Beverage Premixes Analysis, Insights and Forecast, 2020-2032
- 6.1. Market Analysis, Insights and Forecast - by Application
- 6.1.1. Instant Coffee
- 6.1.2. Instant Tea
- 6.1.3. Instant Milk
- 6.1.4. Instant Health Drinks
- 6.1.5. Instant Soup
- 6.1.6. Others
- 6.2. Market Analysis, Insights and Forecast - by Type
- 6.2.1. Plain
- 6.2.2. Flavored
- 6.1. Market Analysis, Insights and Forecast - by Application
- 7. South America Instant Beverage Premixes Analysis, Insights and Forecast, 2020-2032
- 7.1. Market Analysis, Insights and Forecast - by Application
- 7.1.1. Instant Coffee
- 7.1.2. Instant Tea
- 7.1.3. Instant Milk
- 7.1.4. Instant Health Drinks
- 7.1.5. Instant Soup
- 7.1.6. Others
- 7.2. Market Analysis, Insights and Forecast - by Type
- 7.2.1. Plain
- 7.2.2. Flavored
- 7.1. Market Analysis, Insights and Forecast - by Application
- 8. Europe Instant Beverage Premixes Analysis, Insights and Forecast, 2020-2032
- 8.1. Market Analysis, Insights and Forecast - by Application
- 8.1.1. Instant Coffee
- 8.1.2. Instant Tea
- 8.1.3. Instant Milk
- 8.1.4. Instant Health Drinks
- 8.1.5. Instant Soup
- 8.1.6. Others
- 8.2. Market Analysis, Insights and Forecast - by Type
- 8.2.1. Plain
- 8.2.2. Flavored
- 8.1. Market Analysis, Insights and Forecast - by Application
- 9. Middle East & Africa Instant Beverage Premixes Analysis, Insights and Forecast, 2020-2032
- 9.1. Market Analysis, Insights and Forecast - by Application
- 9.1.1. Instant Coffee
- 9.1.2. Instant Tea
- 9.1.3. Instant Milk
- 9.1.4. Instant Health Drinks
- 9.1.5. Instant Soup
- 9.1.6. Others
- 9.2. Market Analysis, Insights and Forecast - by Type
- 9.2.1. Plain
- 9.2.2. Flavored
- 9.1. Market Analysis, Insights and Forecast - by Application
- 10. Asia Pacific Instant Beverage Premixes Analysis, Insights and Forecast, 2020-2032
- 10.1. Market Analysis, Insights and Forecast - by Application
- 10.1.1. Instant Coffee
- 10.1.2. Instant Tea
- 10.1.3. Instant Milk
- 10.1.4. Instant Health Drinks
- 10.1.5. Instant Soup
- 10.1.6. Others
- 10.2. Market Analysis, Insights and Forecast - by Type
- 10.2.1. Plain
- 10.2.2. Flavored
- 10.1. Market Analysis, Insights and Forecast - by Application
- 11. Competitive Analysis
- 11.1. Global Market Share Analysis 2025
- 11.2. Company Profiles
- 11.2.1 The Republic of Tea (US)
- 11.2.1.1. Overview
- 11.2.1.2. Products
- 11.2.1.3. SWOT Analysis
- 11.2.1.4. Recent Developments
- 11.2.1.5. Financials (Based on Availability)
- 11.2.2 Keurig Green Mountain ( US)
- 11.2.2.1. Overview
- 11.2.2.2. Products
- 11.2.2.3. SWOT Analysis
- 11.2.2.4. Recent Developments
- 11.2.2.5. Financials (Based on Availability)
- 11.2.3 Ito En (Japan)
- 11.2.3.1. Overview
- 11.2.3.2. Products
- 11.2.3.3. SWOT Analysis
- 11.2.3.4. Recent Developments
- 11.2.3.5. Financials (Based on Availability)
- 11.2.4 PepsiCo Inc ( US)
- 11.2.4.1. Overview
- 11.2.4.2. Products
- 11.2.4.3. SWOT Analysis
- 11.2.4.4. Recent Developments
- 11.2.4.5. Financials (Based on Availability)
- 11.2.5 Ajinomoto General Foods Inc (Japan)
- 11.2.5.1. Overview
- 11.2.5.2. Products
- 11.2.5.3. SWOT Analysis
- 11.2.5.4. Recent Developments
- 11.2.5.5. Financials (Based on Availability)
- 11.2.6 Suntory Beverage & Food Limited (Japan)
- 11.2.6.1. Overview
- 11.2.6.2. Products
- 11.2.6.3. SWOT Analysis
- 11.2.6.4. Recent Developments
- 11.2.6.5. Financials (Based on Availability)
- 11.2.7 Monster Beverage Co ( US)
- 11.2.7.1. Overview
- 11.2.7.2. Products
- 11.2.7.3. SWOT Analysis
- 11.2.7.4. Recent Developments
- 11.2.7.5. Financials (Based on Availability)
- 11.2.1 The Republic of Tea (US)
List of Figures
- Figure 1: Global Instant Beverage Premixes Revenue Breakdown (billion, %) by Region 2025 & 2033
- Figure 2: Global Instant Beverage Premixes Volume Breakdown (K, %) by Region 2025 & 2033
- Figure 3: North America Instant Beverage Premixes Revenue (billion), by Application 2025 & 2033
- Figure 4: North America Instant Beverage Premixes Volume (K), by Application 2025 & 2033
- Figure 5: North America Instant Beverage Premixes Revenue Share (%), by Application 2025 & 2033
- Figure 6: North America Instant Beverage Premixes Volume Share (%), by Application 2025 & 2033
- Figure 7: North America Instant Beverage Premixes Revenue (billion), by Type 2025 & 2033
- Figure 8: North America Instant Beverage Premixes Volume (K), by Type 2025 & 2033
- Figure 9: North America Instant Beverage Premixes Revenue Share (%), by Type 2025 & 2033
- Figure 10: North America Instant Beverage Premixes Volume Share (%), by Type 2025 & 2033
- Figure 11: North America Instant Beverage Premixes Revenue (billion), by Country 2025 & 2033
- Figure 12: North America Instant Beverage Premixes Volume (K), by Country 2025 & 2033
- Figure 13: North America Instant Beverage Premixes Revenue Share (%), by Country 2025 & 2033
- Figure 14: North America Instant Beverage Premixes Volume Share (%), by Country 2025 & 2033
- Figure 15: South America Instant Beverage Premixes Revenue (billion), by Application 2025 & 2033
- Figure 16: South America Instant Beverage Premixes Volume (K), by Application 2025 & 2033
- Figure 17: South America Instant Beverage Premixes Revenue Share (%), by Application 2025 & 2033
- Figure 18: South America Instant Beverage Premixes Volume Share (%), by Application 2025 & 2033
- Figure 19: South America Instant Beverage Premixes Revenue (billion), by Type 2025 & 2033
- Figure 20: South America Instant Beverage Premixes Volume (K), by Type 2025 & 2033
- Figure 21: South America Instant Beverage Premixes Revenue Share (%), by Type 2025 & 2033
- Figure 22: South America Instant Beverage Premixes Volume Share (%), by Type 2025 & 2033
- Figure 23: South America Instant Beverage Premixes Revenue (billion), by Country 2025 & 2033
- Figure 24: South America Instant Beverage Premixes Volume (K), by Country 2025 & 2033
- Figure 25: South America Instant Beverage Premixes Revenue Share (%), by Country 2025 & 2033
- Figure 26: South America Instant Beverage Premixes Volume Share (%), by Country 2025 & 2033
- Figure 27: Europe Instant Beverage Premixes Revenue (billion), by Application 2025 & 2033
- Figure 28: Europe Instant Beverage Premixes Volume (K), by Application 2025 & 2033
- Figure 29: Europe Instant Beverage Premixes Revenue Share (%), by Application 2025 & 2033
- Figure 30: Europe Instant Beverage Premixes Volume Share (%), by Application 2025 & 2033
- Figure 31: Europe Instant Beverage Premixes Revenue (billion), by Type 2025 & 2033
- Figure 32: Europe Instant Beverage Premixes Volume (K), by Type 2025 & 2033
- Figure 33: Europe Instant Beverage Premixes Revenue Share (%), by Type 2025 & 2033
- Figure 34: Europe Instant Beverage Premixes Volume Share (%), by Type 2025 & 2033
- Figure 35: Europe Instant Beverage Premixes Revenue (billion), by Country 2025 & 2033
- Figure 36: Europe Instant Beverage Premixes Volume (K), by Country 2025 & 2033
- Figure 37: Europe Instant Beverage Premixes Revenue Share (%), by Country 2025 & 2033
- Figure 38: Europe Instant Beverage Premixes Volume Share (%), by Country 2025 & 2033
- Figure 39: Middle East & Africa Instant Beverage Premixes Revenue (billion), by Application 2025 & 2033
- Figure 40: Middle East & Africa Instant Beverage Premixes Volume (K), by Application 2025 & 2033
- Figure 41: Middle East & Africa Instant Beverage Premixes Revenue Share (%), by Application 2025 & 2033
- Figure 42: Middle East & Africa Instant Beverage Premixes Volume Share (%), by Application 2025 & 2033
- Figure 43: Middle East & Africa Instant Beverage Premixes Revenue (billion), by Type 2025 & 2033
- Figure 44: Middle East & Africa Instant Beverage Premixes Volume (K), by Type 2025 & 2033
- Figure 45: Middle East & Africa Instant Beverage Premixes Revenue Share (%), by Type 2025 & 2033
- Figure 46: Middle East & Africa Instant Beverage Premixes Volume Share (%), by Type 2025 & 2033
- Figure 47: Middle East & Africa Instant Beverage Premixes Revenue (billion), by Country 2025 & 2033
- Figure 48: Middle East & Africa Instant Beverage Premixes Volume (K), by Country 2025 & 2033
- Figure 49: Middle East & Africa Instant Beverage Premixes Revenue Share (%), by Country 2025 & 2033
- Figure 50: Middle East & Africa Instant Beverage Premixes Volume Share (%), by Country 2025 & 2033
- Figure 51: Asia Pacific Instant Beverage Premixes Revenue (billion), by Application 2025 & 2033
- Figure 52: Asia Pacific Instant Beverage Premixes Volume (K), by Application 2025 & 2033
- Figure 53: Asia Pacific Instant Beverage Premixes Revenue Share (%), by Application 2025 & 2033
- Figure 54: Asia Pacific Instant Beverage Premixes Volume Share (%), by Application 2025 & 2033
- Figure 55: Asia Pacific Instant Beverage Premixes Revenue (billion), by Type 2025 & 2033
- Figure 56: Asia Pacific Instant Beverage Premixes Volume (K), by Type 2025 & 2033
- Figure 57: Asia Pacific Instant Beverage Premixes Revenue Share (%), by Type 2025 & 2033
- Figure 58: Asia Pacific Instant Beverage Premixes Volume Share (%), by Type 2025 & 2033
- Figure 59: Asia Pacific Instant Beverage Premixes Revenue (billion), by Country 2025 & 2033
- Figure 60: Asia Pacific Instant Beverage Premixes Volume (K), by Country 2025 & 2033
- Figure 61: Asia Pacific Instant Beverage Premixes Revenue Share (%), by Country 2025 & 2033
- Figure 62: Asia Pacific Instant Beverage Premixes Volume Share (%), by Country 2025 & 2033
List of Tables
- Table 1: Global Instant Beverage Premixes Revenue billion Forecast, by Application 2020 & 2033
- Table 2: Global Instant Beverage Premixes Volume K Forecast, by Application 2020 & 2033
- Table 3: Global Instant Beverage Premixes Revenue billion Forecast, by Type 2020 & 2033
- Table 4: Global Instant Beverage Premixes Volume K Forecast, by Type 2020 & 2033
- Table 5: Global Instant Beverage Premixes Revenue billion Forecast, by Region 2020 & 2033
- Table 6: Global Instant Beverage Premixes Volume K Forecast, by Region 2020 & 2033
- Table 7: Global Instant Beverage Premixes Revenue billion Forecast, by Application 2020 & 2033
- Table 8: Global Instant Beverage Premixes Volume K Forecast, by Application 2020 & 2033
- Table 9: Global Instant Beverage Premixes Revenue billion Forecast, by Type 2020 & 2033
- Table 10: Global Instant Beverage Premixes Volume K Forecast, by Type 2020 & 2033
- Table 11: Global Instant Beverage Premixes Revenue billion Forecast, by Country 2020 & 2033
- Table 12: Global Instant Beverage Premixes Volume K Forecast, by Country 2020 & 2033
- Table 13: United States Instant Beverage Premixes Revenue (billion) Forecast, by Application 2020 & 2033
- Table 14: United States Instant Beverage Premixes Volume (K) Forecast, by Application 2020 & 2033
- Table 15: Canada Instant Beverage Premixes Revenue (billion) Forecast, by Application 2020 & 2033
- Table 16: Canada Instant Beverage Premixes Volume (K) Forecast, by Application 2020 & 2033
- Table 17: Mexico Instant Beverage Premixes Revenue (billion) Forecast, by Application 2020 & 2033
- Table 18: Mexico Instant Beverage Premixes Volume (K) Forecast, by Application 2020 & 2033
- Table 19: Global Instant Beverage Premixes Revenue billion Forecast, by Application 2020 & 2033
- Table 20: Global Instant Beverage Premixes Volume K Forecast, by Application 2020 & 2033
- Table 21: Global Instant Beverage Premixes Revenue billion Forecast, by Type 2020 & 2033
- Table 22: Global Instant Beverage Premixes Volume K Forecast, by Type 2020 & 2033
- Table 23: Global Instant Beverage Premixes Revenue billion Forecast, by Country 2020 & 2033
- Table 24: Global Instant Beverage Premixes Volume K Forecast, by Country 2020 & 2033
- Table 25: Brazil Instant Beverage Premixes Revenue (billion) Forecast, by Application 2020 & 2033
- Table 26: Brazil Instant Beverage Premixes Volume (K) Forecast, by Application 2020 & 2033
- Table 27: Argentina Instant Beverage Premixes Revenue (billion) Forecast, by Application 2020 & 2033
- Table 28: Argentina Instant Beverage Premixes Volume (K) Forecast, by Application 2020 & 2033
- Table 29: Rest of South America Instant Beverage Premixes Revenue (billion) Forecast, by Application 2020 & 2033
- Table 30: Rest of South America Instant Beverage Premixes Volume (K) Forecast, by Application 2020 & 2033
- Table 31: Global Instant Beverage Premixes Revenue billion Forecast, by Application 2020 & 2033
- Table 32: Global Instant Beverage Premixes Volume K Forecast, by Application 2020 & 2033
- Table 33: Global Instant Beverage Premixes Revenue billion Forecast, by Type 2020 & 2033
- Table 34: Global Instant Beverage Premixes Volume K Forecast, by Type 2020 & 2033
- Table 35: Global Instant Beverage Premixes Revenue billion Forecast, by Country 2020 & 2033
- Table 36: Global Instant Beverage Premixes Volume K Forecast, by Country 2020 & 2033
- Table 37: United Kingdom Instant Beverage Premixes Revenue (billion) Forecast, by Application 2020 & 2033
- Table 38: United Kingdom Instant Beverage Premixes Volume (K) Forecast, by Application 2020 & 2033
- Table 39: Germany Instant Beverage Premixes Revenue (billion) Forecast, by Application 2020 & 2033
- Table 40: Germany Instant Beverage Premixes Volume (K) Forecast, by Application 2020 & 2033
- Table 41: France Instant Beverage Premixes Revenue (billion) Forecast, by Application 2020 & 2033
- Table 42: France Instant Beverage Premixes Volume (K) Forecast, by Application 2020 & 2033
- Table 43: Italy Instant Beverage Premixes Revenue (billion) Forecast, by Application 2020 & 2033
- Table 44: Italy Instant Beverage Premixes Volume (K) Forecast, by Application 2020 & 2033
- Table 45: Spain Instant Beverage Premixes Revenue (billion) Forecast, by Application 2020 & 2033
- Table 46: Spain Instant Beverage Premixes Volume (K) Forecast, by Application 2020 & 2033
- Table 47: Russia Instant Beverage Premixes Revenue (billion) Forecast, by Application 2020 & 2033
- Table 48: Russia Instant Beverage Premixes Volume (K) Forecast, by Application 2020 & 2033
- Table 49: Benelux Instant Beverage Premixes Revenue (billion) Forecast, by Application 2020 & 2033
- Table 50: Benelux Instant Beverage Premixes Volume (K) Forecast, by Application 2020 & 2033
- Table 51: Nordics Instant Beverage Premixes Revenue (billion) Forecast, by Application 2020 & 2033
- Table 52: Nordics Instant Beverage Premixes Volume (K) Forecast, by Application 2020 & 2033
- Table 53: Rest of Europe Instant Beverage Premixes Revenue (billion) Forecast, by Application 2020 & 2033
- Table 54: Rest of Europe Instant Beverage Premixes Volume (K) Forecast, by Application 2020 & 2033
- Table 55: Global Instant Beverage Premixes Revenue billion Forecast, by Application 2020 & 2033
- Table 56: Global Instant Beverage Premixes Volume K Forecast, by Application 2020 & 2033
- Table 57: Global Instant Beverage Premixes Revenue billion Forecast, by Type 2020 & 2033
- Table 58: Global Instant Beverage Premixes Volume K Forecast, by Type 2020 & 2033
- Table 59: Global Instant Beverage Premixes Revenue billion Forecast, by Country 2020 & 2033
- Table 60: Global Instant Beverage Premixes Volume K Forecast, by Country 2020 & 2033
- Table 61: Turkey Instant Beverage Premixes Revenue (billion) Forecast, by Application 2020 & 2033
- Table 62: Turkey Instant Beverage Premixes Volume (K) Forecast, by Application 2020 & 2033
- Table 63: Israel Instant Beverage Premixes Revenue (billion) Forecast, by Application 2020 & 2033
- Table 64: Israel Instant Beverage Premixes Volume (K) Forecast, by Application 2020 & 2033
- Table 65: GCC Instant Beverage Premixes Revenue (billion) Forecast, by Application 2020 & 2033
- Table 66: GCC Instant Beverage Premixes Volume (K) Forecast, by Application 2020 & 2033
- Table 67: North Africa Instant Beverage Premixes Revenue (billion) Forecast, by Application 2020 & 2033
- Table 68: North Africa Instant Beverage Premixes Volume (K) Forecast, by Application 2020 & 2033
- Table 69: South Africa Instant Beverage Premixes Revenue (billion) Forecast, by Application 2020 & 2033
- Table 70: South Africa Instant Beverage Premixes Volume (K) Forecast, by Application 2020 & 2033
- Table 71: Rest of Middle East & Africa Instant Beverage Premixes Revenue (billion) Forecast, by Application 2020 & 2033
- Table 72: Rest of Middle East & Africa Instant Beverage Premixes Volume (K) Forecast, by Application 2020 & 2033
- Table 73: Global Instant Beverage Premixes Revenue billion Forecast, by Application 2020 & 2033
- Table 74: Global Instant Beverage Premixes Volume K Forecast, by Application 2020 & 2033
- Table 75: Global Instant Beverage Premixes Revenue billion Forecast, by Type 2020 & 2033
- Table 76: Global Instant Beverage Premixes Volume K Forecast, by Type 2020 & 2033
- Table 77: Global Instant Beverage Premixes Revenue billion Forecast, by Country 2020 & 2033
- Table 78: Global Instant Beverage Premixes Volume K Forecast, by Country 2020 & 2033
- Table 79: China Instant Beverage Premixes Revenue (billion) Forecast, by Application 2020 & 2033
- Table 80: China Instant Beverage Premixes Volume (K) Forecast, by Application 2020 & 2033
- Table 81: India Instant Beverage Premixes Revenue (billion) Forecast, by Application 2020 & 2033
- Table 82: India Instant Beverage Premixes Volume (K) Forecast, by Application 2020 & 2033
- Table 83: Japan Instant Beverage Premixes Revenue (billion) Forecast, by Application 2020 & 2033
- Table 84: Japan Instant Beverage Premixes Volume (K) Forecast, by Application 2020 & 2033
- Table 85: South Korea Instant Beverage Premixes Revenue (billion) Forecast, by Application 2020 & 2033
- Table 86: South Korea Instant Beverage Premixes Volume (K) Forecast, by Application 2020 & 2033
- Table 87: ASEAN Instant Beverage Premixes Revenue (billion) Forecast, by Application 2020 & 2033
- Table 88: ASEAN Instant Beverage Premixes Volume (K) Forecast, by Application 2020 & 2033
- Table 89: Oceania Instant Beverage Premixes Revenue (billion) Forecast, by Application 2020 & 2033
- Table 90: Oceania Instant Beverage Premixes Volume (K) Forecast, by Application 2020 & 2033
- Table 91: Rest of Asia Pacific Instant Beverage Premixes Revenue (billion) Forecast, by Application 2020 & 2033
- Table 92: Rest of Asia Pacific Instant Beverage Premixes Volume (K) Forecast, by Application 2020 & 2033
Frequently Asked Questions
1. What is the projected Compound Annual Growth Rate (CAGR) of the Instant Beverage Premixes?
The projected CAGR is approximately 7.3%.
2. Which companies are prominent players in the Instant Beverage Premixes?
Key companies in the market include The Republic of Tea (US), Keurig Green Mountain ( US), Ito En (Japan), PepsiCo Inc ( US), Ajinomoto General Foods Inc (Japan), Suntory Beverage & Food Limited (Japan), Monster Beverage Co ( US).
3. What are the main segments of the Instant Beverage Premixes?
The market segments include Application, Type.
4. Can you provide details about the market size?
The market size is estimated to be USD 80.24 billion as of 2022.
5. What are some drivers contributing to market growth?
N/A
6. What are the notable trends driving market growth?
N/A
7. Are there any restraints impacting market growth?
N/A
8. Can you provide examples of recent developments in the market?
N/A
9. What pricing options are available for accessing the report?
Pricing options include single-user, multi-user, and enterprise licenses priced at USD 3950.00, USD 5925.00, and USD 7900.00 respectively.
10. Is the market size provided in terms of value or volume?
The market size is provided in terms of value, measured in billion and volume, measured in K.
11. Are there any specific market keywords associated with the report?
Yes, the market keyword associated with the report is "Instant Beverage Premixes," which aids in identifying and referencing the specific market segment covered.
12. How do I determine which pricing option suits my needs best?
The pricing options vary based on user requirements and access needs. Individual users may opt for single-user licenses, while businesses requiring broader access may choose multi-user or enterprise licenses for cost-effective access to the report.
13. Are there any additional resources or data provided in the Instant Beverage Premixes report?
While the report offers comprehensive insights, it's advisable to review the specific contents or supplementary materials provided to ascertain if additional resources or data are available.
14. How can I stay updated on further developments or reports in the Instant Beverage Premixes?
To stay informed about further developments, trends, and reports in the Instant Beverage Premixes, consider subscribing to industry newsletters, following relevant companies and organizations, or regularly checking reputable industry news sources and publications.
Methodology
Step 1 - Identification of Relevant Samples Size from Population Database


Step 2 - Approaches for Defining Global Market Size (Value, Volume* & Price*)

Note*: In applicable scenarios
Step 3 - Data Sources
Primary Research
- Web Analytics
- Survey Reports
- Research Institute
- Latest Research Reports
- Opinion Leaders
Secondary Research
- Annual Reports
- White Paper
- Latest Press Release
- Industry Association
- Paid Database
- Investor Presentations

Step 4 - Data Triangulation
Involves using different sources of information in order to increase the validity of a study
These sources are likely to be stakeholders in a program - participants, other researchers, program staff, other community members, and so on.
Then we put all data in single framework & apply various statistical tools to find out the dynamic on the market.
During the analysis stage, feedback from the stakeholder groups would be compared to determine areas of agreement as well as areas of divergence