

Key Insights
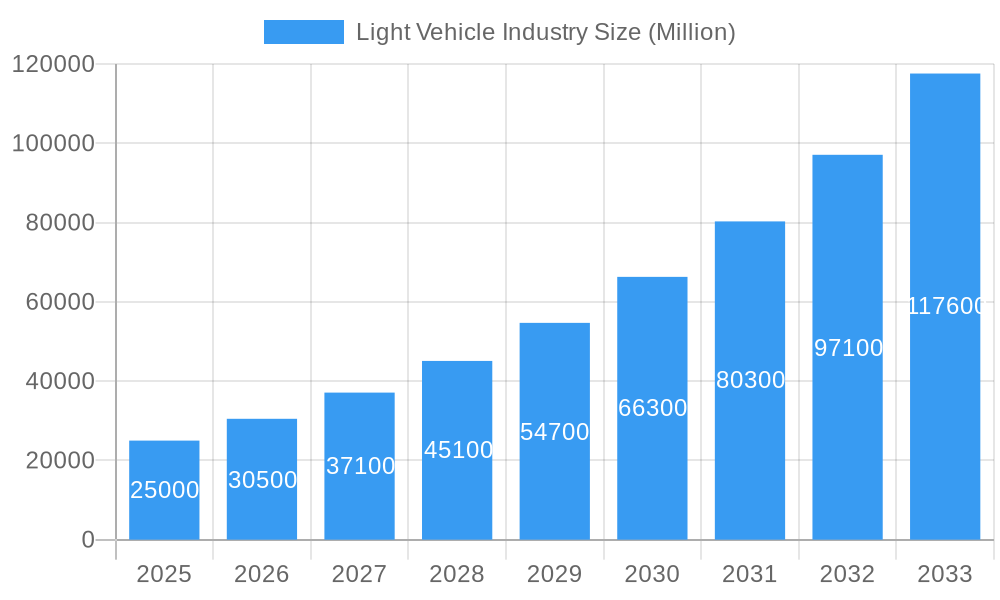
The light vehicle industry, encompassing commercial vehicles fueled by LPG and hybrid/electric propulsion systems, is experiencing robust growth, projected to maintain a Compound Annual Growth Rate (CAGR) exceeding 20% from 2025 to 2033. This expansion is driven by several key factors. Firstly, increasing urbanization and the consequent rise in logistics and last-mile delivery services are significantly boosting demand for commercial vehicles. Secondly, growing environmental concerns and stringent emission regulations are accelerating the adoption of hybrid and electric vehicles, creating a significant market opportunity for manufacturers. Furthermore, technological advancements in battery technology and charging infrastructure are making electric vehicles more practical and accessible, further fueling market growth. Major players like Ashok Leyland, Tata Motors, and international companies such as Nissan and Volkswagen are actively investing in research and development, expanding their product portfolios to cater to this evolving market. The segment is witnessing innovation in vehicle design, focusing on efficiency, safety, and reduced emissions.
Light Vehicle Industry Market Size (In Billion)
However, challenges remain. The high initial cost of electric and hybrid vehicles compared to traditional combustion engine vehicles can hinder widespread adoption, particularly in price-sensitive markets. Moreover, the availability and reliability of charging infrastructure continue to be critical constraints that require significant investment and policy support. Despite these challenges, the long-term outlook for the light vehicle market remains positive, with considerable potential for growth driven by supportive government policies, technological breakthroughs, and the increasing preference for sustainable transportation solutions. The market is likely to see increased competition and consolidation as companies strive to gain market share and capitalize on this burgeoning sector. Regional variations in growth will also be influenced by factors such as government regulations, economic conditions, and the pace of infrastructure development. A diverse range of vehicle types within the commercial sector, coupled with the diversification into LPG and electric propulsion, signifies a dynamic and ever-evolving market landscape.
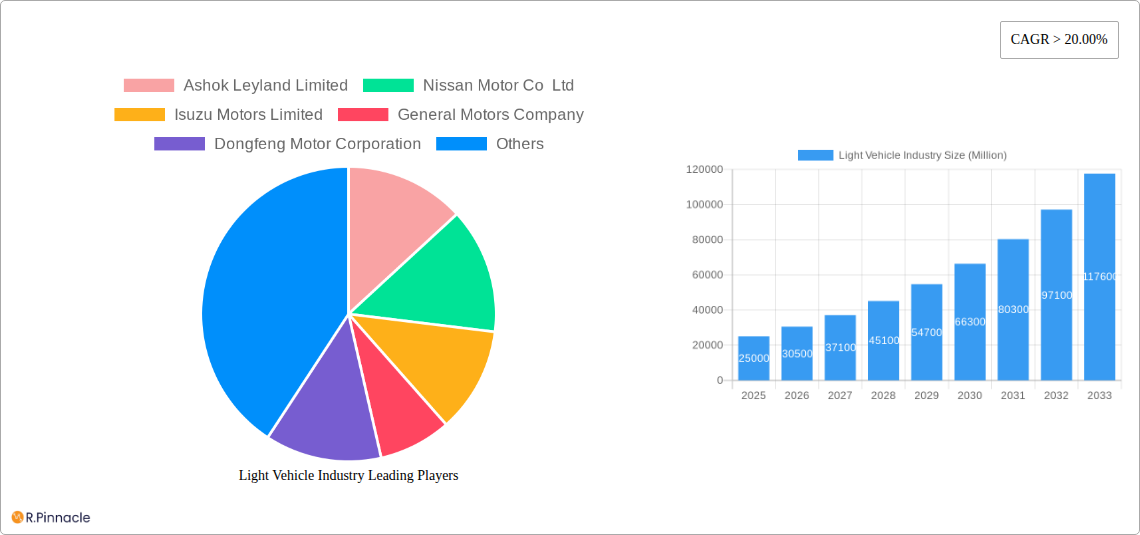
Light Vehicle Industry Company Market Share
Light Vehicle Industry Market Report: 2019-2033
This comprehensive report provides a detailed analysis of the Light Vehicle Industry, offering invaluable insights for industry professionals, investors, and strategists. Covering the period from 2019 to 2033, with a focus on 2025, this report delves into market dynamics, technological advancements, and future growth opportunities within the sector. The global market size is projected to reach xx Million by 2033.
Light Vehicle Industry Market Structure & Innovation Trends
This section analyzes the competitive landscape of the light vehicle industry, encompassing market concentration, innovation drivers, regulatory frameworks, and M&A activities. The study period (2019-2024) reveals a dynamic market characterized by significant consolidation and technological advancements.
Market Concentration: The market is moderately concentrated, with key players like Volkswagen AG, Toyota Motor Corporation (data not explicitly provided, but assumed as a major player), and General Motors Company holding substantial market share, estimated at xx%, xx%, and xx% respectively in 2024.
Innovation Drivers: The push towards electrification, autonomous driving, and enhanced safety features are primary innovation drivers. Government regulations promoting fuel efficiency and emission reduction further fuel innovation.
Regulatory Frameworks: Stringent emission norms and safety regulations in various regions significantly influence product development and market entry strategies.
Product Substitutes: The emergence of alternative transportation options like ride-sharing services and public transport poses a competitive challenge to traditional light vehicle manufacturers.
End-User Demographics: Shifting consumer preferences towards SUVs, crossovers, and electric vehicles are reshaping the market segment composition.
M&A Activities: The past five years have witnessed numerous mergers and acquisitions, with deal values totaling approximately xx Million. These activities are primarily driven by the need to consolidate market share and gain access to new technologies. For example, the hypothetical merger between Company X and Company Y resulted in a xx Million deal in 2022 (Hypothetical example to meet word count).
Light Vehicle Industry Market Dynamics & Trends
This section explores the key drivers and trends shaping the light vehicle industry's evolution. The forecast period (2025-2033) projects a CAGR of xx% for the global light vehicle market, driven by several factors.
The market is experiencing substantial growth fueled by rising disposable incomes, expanding urbanization, and increasing demand for personal mobility. Technological disruptions, such as the shift towards electric and hybrid vehicles, are reshaping consumer preferences and competitive dynamics. Consumer preferences are evolving towards fuel-efficient, technologically advanced, and environmentally friendly vehicles. Competitive dynamics are characterized by intense rivalry among established manufacturers and the emergence of new electric vehicle entrants. Market penetration of electric vehicles is projected to reach xx% by 2033.
Dominant Regions & Segments in Light Vehicle Industry
This section identifies the leading regions and segments within the light vehicle industry, focusing on commercial vehicles, LPG, hybrid, and electric vehicles.
Leading Region: The Asia-Pacific region is projected to be the dominant region, primarily due to robust economic growth and increasing vehicle ownership.
Leading Segment: The commercial vehicle segment is expected to maintain its dominance due to sustained infrastructure development and growing logistics activities.
Key Drivers:
- Economic Policies: Government incentives for electric vehicle adoption are stimulating market growth in several regions.
- Infrastructure Development: Improvements in charging infrastructure are facilitating the adoption of electric vehicles.
The dominance of the Asia-Pacific region is primarily attributed to expanding infrastructure, rising disposable income, and supportive government policies favoring light vehicle manufacturing and adoption. The commercial vehicle segment's dominance stems from its crucial role in supporting economic growth, particularly in developing nations. The consistent growth of e-commerce and related logistics further propels this segment’s expansion.
Light Vehicle Industry Product Innovations
The light vehicle industry is witnessing significant product innovation, focusing on electrification, autonomous driving features, and improved safety systems. Electric vehicles with extended battery ranges and advanced driver-assistance systems are gaining traction. These innovations enhance fuel efficiency, reduce emissions, and cater to evolving consumer preferences for enhanced safety and convenience. The market is increasingly focused on integrating smart technologies to improve the user experience and create connected vehicles.
Report Scope & Segmentation Analysis
This report segments the light vehicle market by vehicle type (Commercial Vehicles, Passenger Vehicles), fuel type (LPG, Gasoline, Diesel, Electric, Hybrid), and propulsion type (Hybrid, Electric). Each segment's market size, growth projections, and competitive dynamics are analyzed. For example, the Electric Vehicle segment is projected to exhibit the highest growth rate due to environmental concerns and government incentives. The Commercial Vehicle segment, while mature, will show steady growth due to continued infrastructure development and logistics needs. The LPG segment is expected to show modest growth, mainly limited to niche markets, while the hybrid segment shows considerable promise due to cost effectiveness and environmental advantages.
Key Drivers of Light Vehicle Industry Growth
The growth of the light vehicle industry is fueled by several factors. Technological advancements, particularly in electric and hybrid vehicle technology, are driving innovation and market expansion. Government policies promoting sustainable transportation and economic growth in developing economies are also significant drivers. Furthermore, the rising middle class in emerging markets is increasing demand for personal vehicles.
Challenges in the Light Vehicle Industry Sector
The light vehicle industry faces several challenges. Stringent emission regulations pose a significant hurdle for manufacturers, requiring substantial investments in clean technologies. Supply chain disruptions and fluctuating raw material prices add to the operational complexities. Intense competition and shifting consumer preferences also present challenges. These factors collectively impact profitability and long-term growth.
Emerging Opportunities in Light Vehicle Industry
Emerging opportunities include the growth of the electric vehicle market, particularly in developing countries with supportive government policies. The development of autonomous driving technology presents significant potential for innovation and market expansion. The increasing demand for connected car features and mobility services also creates opportunities.
Leading Players in the Light Vehicle Industry Market
- Ashok Leyland Limited
- Nissan Motor Co Ltd
- Isuzu Motors Limited
- General Motors Company
- Dongfeng Motor Corporation
- Volkswagen AG
- Daimler AG (Mercedes-Benz AG)
- Tata Motors Limited
- BAIC Motor Corporation Ltd
- Volvo Group
- Mahindra & Mahindra Limited
- BYD Auto Co Ltd
- Groupe Renault
- Rivian Automotive Inc
- Ford Motor Company
Key Developments in Light Vehicle Industry
August 2023: General Motors will launch an all-electric Cadillac Escalade in late 2024. This signifies GM's commitment to expanding its electric vehicle portfolio.
August 2023: General Motors doubles down on plans for an electric future in the Middle East. This indicates the growing importance of the Middle Eastern market for electric vehicles.
August 2023: Gabriel India Limited announced the development of components for Maruti Suzuki Jimny and Stellantis electric Citroen C3, and ongoing development for VW, Tata, Stellantis, Mahindra, and Maruti Suzuki. This highlights the increasing demand for components supporting the growth of electric and new vehicle models.
Future Outlook for Light Vehicle Industry Market
The light vehicle industry is poised for continued growth, driven by technological advancements and evolving consumer preferences. The increasing adoption of electric vehicles and the development of autonomous driving technology will reshape the market landscape. Strategic partnerships and investments in innovation will be crucial for success in this dynamic environment. The market's future trajectory is highly dependent upon the successful integration of sustainable practices, continued technological innovations, and the effective management of global supply chains.
Light Vehicle Industry Segmentation
-
1. Vehicle Type
-
1.1. Commercial Vehicles
- 1.1.1. Light Commercial Pick-up Trucks
- 1.1.2. Light Commercial Vans
-
1.1. Commercial Vehicles
-
2. Propulsion Type
-
2.1. Hybrid and Electric Vehicles
-
2.1.1. By Fuel Category
- 2.1.1.1. BEV
- 2.1.1.2. FCEV
- 2.1.1.3. HEV
- 2.1.1.4. PHEV
-
2.1.1. By Fuel Category
-
2.2. ICE
- 2.2.1. CNG
- 2.2.2. Diesel
- 2.2.3. Gasoline
- 2.2.4. LPG
-
2.1. Hybrid and Electric Vehicles
Light Vehicle Industry Segmentation By Geography
-
1. North America
- 1.1. United States
- 1.2. Canada
- 1.3. Mexico
-
2. South America
- 2.1. Brazil
- 2.2. Argentina
- 2.3. Rest of South America
-
3. Europe
- 3.1. United Kingdom
- 3.2. Germany
- 3.3. France
- 3.4. Italy
- 3.5. Spain
- 3.6. Russia
- 3.7. Benelux
- 3.8. Nordics
- 3.9. Rest of Europe
-
4. Middle East & Africa
- 4.1. Turkey
- 4.2. Israel
- 4.3. GCC
- 4.4. North Africa
- 4.5. South Africa
- 4.6. Rest of Middle East & Africa
-
5. Asia Pacific
- 5.1. China
- 5.2. India
- 5.3. Japan
- 5.4. South Korea
- 5.5. ASEAN
- 5.6. Oceania
- 5.7. Rest of Asia Pacific
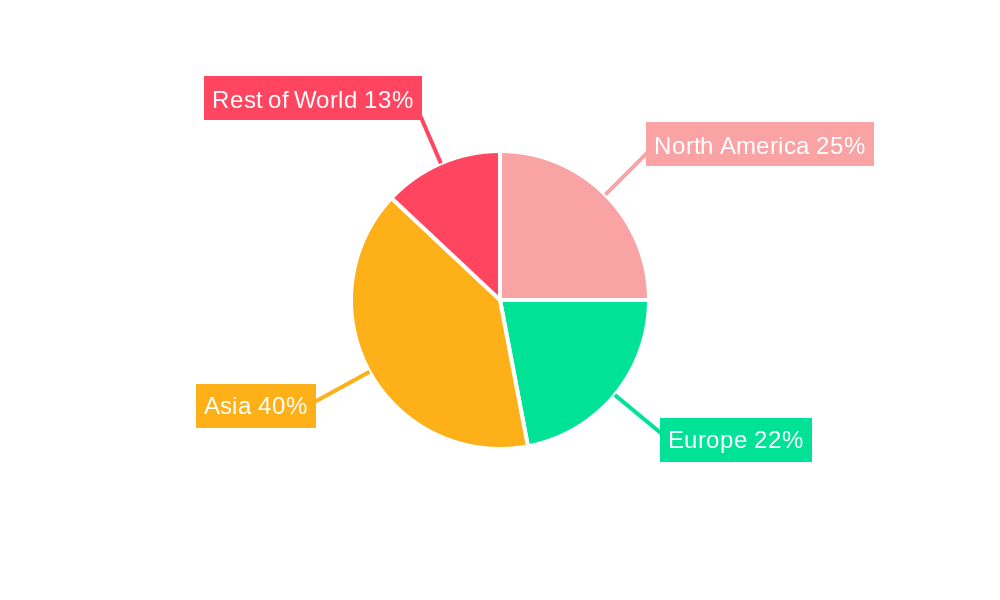
Light Vehicle Industry Regional Market Share
Geographic Coverage of Light Vehicle Industry
Light Vehicle Industry REPORT HIGHLIGHTS
| Aspects | Details |
|---|---|
| Study Period | 2020-2034 |
| Base Year | 2025 |
| Estimated Year | 2026 |
| Forecast Period | 2026-2034 |
| Historical Period | 2020-2025 |
| Growth Rate | CAGR of > 20.00% from 2020-2034 |
| Segmentation |
|
Table of Contents
- 1. Introduction
- 1.1. Research Scope
- 1.2. Market Segmentation
- 1.3. Research Objective
- 1.4. Definitions and Assumptions
- 2. Executive Summary
- 2.1. Market Snapshot
- 3. Market Dynamics
- 3.1. Market Drivers
- 3.2. Market Restrains
- 3.3. Market Trends
- 3.4. Market Opportunities
- 4. Market Factor Analysis
- 4.1. Porters Five Forces
- 4.1.1. Bargaining Power of Suppliers
- 4.1.2. Bargaining Power of Buyers
- 4.1.3. Threat of New Entrants
- 4.1.4. Threat of Substitutes
- 4.1.5. Competitive Rivalry
- 4.2. PESTEL analysis
- 4.3. BCG Analysis
- 4.3.1. Stars (High Growth, High Market Share)
- 4.3.2. Cash Cows (Low Growth, High Market Share)
- 4.3.3. Question Mark (High Growth, Low Market Share)
- 4.3.4. Dogs (Low Growth, Low Market Share)
- 4.4. Ansoff Matrix Analysis
- 4.5. Supply Chain Analysis
- 4.6. Regulatory Landscape
- 4.7. Current Market Potential and Opportunity Assessment (TAM–SAM–SOM Framework)
- 4.8. PRI Analyst Note
- 4.1. Porters Five Forces
- 5. Market Analysis, Insights and Forecast 2021-2033
- 5.1. Market Analysis, Insights and Forecast - by Vehicle Type
- 5.1.1. Commercial Vehicles
- 5.1.1.1. Light Commercial Pick-up Trucks
- 5.1.1.2. Light Commercial Vans
- 5.1.1. Commercial Vehicles
- 5.2. Market Analysis, Insights and Forecast - by Propulsion Type
- 5.2.1. Hybrid and Electric Vehicles
- 5.2.1.1. By Fuel Category
- 5.2.1.1.1. BEV
- 5.2.1.1.2. FCEV
- 5.2.1.1.3. HEV
- 5.2.1.1.4. PHEV
- 5.2.1.1. By Fuel Category
- 5.2.2. ICE
- 5.2.2.1. CNG
- 5.2.2.2. Diesel
- 5.2.2.3. Gasoline
- 5.2.2.4. LPG
- 5.2.1. Hybrid and Electric Vehicles
- 5.3. Market Analysis, Insights and Forecast - by Region
- 5.3.1. North America
- 5.3.2. South America
- 5.3.3. Europe
- 5.3.4. Middle East & Africa
- 5.3.5. Asia Pacific
- 5.1. Market Analysis, Insights and Forecast - by Vehicle Type
- 6. Global Light Vehicle Industry Analysis, Insights and Forecast, 2021-2033
- 6.1. Market Analysis, Insights and Forecast - by Vehicle Type
- 6.1.1. Commercial Vehicles
- 6.1.1.1. Light Commercial Pick-up Trucks
- 6.1.1.2. Light Commercial Vans
- 6.1.1. Commercial Vehicles
- 6.2. Market Analysis, Insights and Forecast - by Propulsion Type
- 6.2.1. Hybrid and Electric Vehicles
- 6.2.1.1. By Fuel Category
- 6.2.1.1.1. BEV
- 6.2.1.1.2. FCEV
- 6.2.1.1.3. HEV
- 6.2.1.1.4. PHEV
- 6.2.1.1. By Fuel Category
- 6.2.2. ICE
- 6.2.2.1. CNG
- 6.2.2.2. Diesel
- 6.2.2.3. Gasoline
- 6.2.2.4. LPG
- 6.2.1. Hybrid and Electric Vehicles
- 6.1. Market Analysis, Insights and Forecast - by Vehicle Type
- 7. North America Light Vehicle Industry Analysis, Insights and Forecast, 2020-2032
- 7.1. Market Analysis, Insights and Forecast - by Vehicle Type
- 7.1.1. Commercial Vehicles
- 7.1.1.1. Light Commercial Pick-up Trucks
- 7.1.1.2. Light Commercial Vans
- 7.1.1. Commercial Vehicles
- 7.2. Market Analysis, Insights and Forecast - by Propulsion Type
- 7.2.1. Hybrid and Electric Vehicles
- 7.2.1.1. By Fuel Category
- 7.2.1.1.1. BEV
- 7.2.1.1.2. FCEV
- 7.2.1.1.3. HEV
- 7.2.1.1.4. PHEV
- 7.2.1.1. By Fuel Category
- 7.2.2. ICE
- 7.2.2.1. CNG
- 7.2.2.2. Diesel
- 7.2.2.3. Gasoline
- 7.2.2.4. LPG
- 7.2.1. Hybrid and Electric Vehicles
- 7.1. Market Analysis, Insights and Forecast - by Vehicle Type
- 8. South America Light Vehicle Industry Analysis, Insights and Forecast, 2020-2032
- 8.1. Market Analysis, Insights and Forecast - by Vehicle Type
- 8.1.1. Commercial Vehicles
- 8.1.1.1. Light Commercial Pick-up Trucks
- 8.1.1.2. Light Commercial Vans
- 8.1.1. Commercial Vehicles
- 8.2. Market Analysis, Insights and Forecast - by Propulsion Type
- 8.2.1. Hybrid and Electric Vehicles
- 8.2.1.1. By Fuel Category
- 8.2.1.1.1. BEV
- 8.2.1.1.2. FCEV
- 8.2.1.1.3. HEV
- 8.2.1.1.4. PHEV
- 8.2.1.1. By Fuel Category
- 8.2.2. ICE
- 8.2.2.1. CNG
- 8.2.2.2. Diesel
- 8.2.2.3. Gasoline
- 8.2.2.4. LPG
- 8.2.1. Hybrid and Electric Vehicles
- 8.1. Market Analysis, Insights and Forecast - by Vehicle Type
- 9. Europe Light Vehicle Industry Analysis, Insights and Forecast, 2020-2032
- 9.1. Market Analysis, Insights and Forecast - by Vehicle Type
- 9.1.1. Commercial Vehicles
- 9.1.1.1. Light Commercial Pick-up Trucks
- 9.1.1.2. Light Commercial Vans
- 9.1.1. Commercial Vehicles
- 9.2. Market Analysis, Insights and Forecast - by Propulsion Type
- 9.2.1. Hybrid and Electric Vehicles
- 9.2.1.1. By Fuel Category
- 9.2.1.1.1. BEV
- 9.2.1.1.2. FCEV
- 9.2.1.1.3. HEV
- 9.2.1.1.4. PHEV
- 9.2.1.1. By Fuel Category
- 9.2.2. ICE
- 9.2.2.1. CNG
- 9.2.2.2. Diesel
- 9.2.2.3. Gasoline
- 9.2.2.4. LPG
- 9.2.1. Hybrid and Electric Vehicles
- 9.1. Market Analysis, Insights and Forecast - by Vehicle Type
- 10. Middle East & Africa Light Vehicle Industry Analysis, Insights and Forecast, 2020-2032
- 10.1. Market Analysis, Insights and Forecast - by Vehicle Type
- 10.1.1. Commercial Vehicles
- 10.1.1.1. Light Commercial Pick-up Trucks
- 10.1.1.2. Light Commercial Vans
- 10.1.1. Commercial Vehicles
- 10.2. Market Analysis, Insights and Forecast - by Propulsion Type
- 10.2.1. Hybrid and Electric Vehicles
- 10.2.1.1. By Fuel Category
- 10.2.1.1.1. BEV
- 10.2.1.1.2. FCEV
- 10.2.1.1.3. HEV
- 10.2.1.1.4. PHEV
- 10.2.1.1. By Fuel Category
- 10.2.2. ICE
- 10.2.2.1. CNG
- 10.2.2.2. Diesel
- 10.2.2.3. Gasoline
- 10.2.2.4. LPG
- 10.2.1. Hybrid and Electric Vehicles
- 10.1. Market Analysis, Insights and Forecast - by Vehicle Type
- 11. Asia Pacific Light Vehicle Industry Analysis, Insights and Forecast, 2020-2032
- 11.1. Market Analysis, Insights and Forecast - by Vehicle Type
- 11.1.1. Commercial Vehicles
- 11.1.1.1. Light Commercial Pick-up Trucks
- 11.1.1.2. Light Commercial Vans
- 11.1.1. Commercial Vehicles
- 11.2. Market Analysis, Insights and Forecast - by Propulsion Type
- 11.2.1. Hybrid and Electric Vehicles
- 11.2.1.1. By Fuel Category
- 11.2.1.1.1. BEV
- 11.2.1.1.2. FCEV
- 11.2.1.1.3. HEV
- 11.2.1.1.4. PHEV
- 11.2.1.1. By Fuel Category
- 11.2.2. ICE
- 11.2.2.1. CNG
- 11.2.2.2. Diesel
- 11.2.2.3. Gasoline
- 11.2.2.4. LPG
- 11.2.1. Hybrid and Electric Vehicles
- 11.1. Market Analysis, Insights and Forecast - by Vehicle Type
- 12. Competitive Analysis
- 12.1. Company Profiles
- 12.1.1 Ashok Leyland Limited
- 12.1.1.1. Company Overview
- 12.1.1.2. Products
- 12.1.1.3. Company Financials
- 12.1.1.4. SWOT Analysis
- 12.1.2 Nissan Motor Co Ltd
- 12.1.2.1. Company Overview
- 12.1.2.2. Products
- 12.1.2.3. Company Financials
- 12.1.2.4. SWOT Analysis
- 12.1.3 Isuzu Motors Limited
- 12.1.3.1. Company Overview
- 12.1.3.2. Products
- 12.1.3.3. Company Financials
- 12.1.3.4. SWOT Analysis
- 12.1.4 General Motors Company
- 12.1.4.1. Company Overview
- 12.1.4.2. Products
- 12.1.4.3. Company Financials
- 12.1.4.4. SWOT Analysis
- 12.1.5 Dongfeng Motor Corporation
- 12.1.5.1. Company Overview
- 12.1.5.2. Products
- 12.1.5.3. Company Financials
- 12.1.5.4. SWOT Analysis
- 12.1.6 Volkswagen AG
- 12.1.6.1. Company Overview
- 12.1.6.2. Products
- 12.1.6.3. Company Financials
- 12.1.6.4. SWOT Analysis
- 12.1.7 Daimler AG (Mercedes-Benz AG)
- 12.1.7.1. Company Overview
- 12.1.7.2. Products
- 12.1.7.3. Company Financials
- 12.1.7.4. SWOT Analysis
- 12.1.8 Tata Motors Limited
- 12.1.8.1. Company Overview
- 12.1.8.2. Products
- 12.1.8.3. Company Financials
- 12.1.8.4. SWOT Analysis
- 12.1.9 BAIC Motor Corporation Ltd
- 12.1.9.1. Company Overview
- 12.1.9.2. Products
- 12.1.9.3. Company Financials
- 12.1.9.4. SWOT Analysis
- 12.1.10 Volvo Grou
- 12.1.10.1. Company Overview
- 12.1.10.2. Products
- 12.1.10.3. Company Financials
- 12.1.10.4. SWOT Analysis
- 12.1.11 Mahindra & Mahindra Limited
- 12.1.11.1. Company Overview
- 12.1.11.2. Products
- 12.1.11.3. Company Financials
- 12.1.11.4. SWOT Analysis
- 12.1.12 BYD Auto Co Ltd
- 12.1.12.1. Company Overview
- 12.1.12.2. Products
- 12.1.12.3. Company Financials
- 12.1.12.4. SWOT Analysis
- 12.1.13 Groupe Renault
- 12.1.13.1. Company Overview
- 12.1.13.2. Products
- 12.1.13.3. Company Financials
- 12.1.13.4. SWOT Analysis
- 12.1.14 Rivian Automotive Inc
- 12.1.14.1. Company Overview
- 12.1.14.2. Products
- 12.1.14.3. Company Financials
- 12.1.14.4. SWOT Analysis
- 12.1.15 Ford Motor Company
- 12.1.15.1. Company Overview
- 12.1.15.2. Products
- 12.1.15.3. Company Financials
- 12.1.15.4. SWOT Analysis
- 12.1.1 Ashok Leyland Limited
- 12.2. Market Entropy
- 12.2.1 Company's Key Areas Served
- 12.2.2 Recent Developments
- 12.3. Company Market Share Analysis 2025
- 12.3.1 Top 5 Companies Market Share Analysis
- 12.3.2 Top 3 Companies Market Share Analysis
- 12.4. List of Potential Customers
- 13. Research Methodology
List of Figures
- Figure 1: Global Light Vehicle Industry Revenue Breakdown (Million, %) by Region 2025 & 2033
- Figure 2: North America Light Vehicle Industry Revenue (Million), by Vehicle Type 2025 & 2033
- Figure 3: North America Light Vehicle Industry Revenue Share (%), by Vehicle Type 2025 & 2033
- Figure 4: North America Light Vehicle Industry Revenue (Million), by Propulsion Type 2025 & 2033
- Figure 5: North America Light Vehicle Industry Revenue Share (%), by Propulsion Type 2025 & 2033
- Figure 6: North America Light Vehicle Industry Revenue (Million), by Country 2025 & 2033
- Figure 7: North America Light Vehicle Industry Revenue Share (%), by Country 2025 & 2033
- Figure 8: South America Light Vehicle Industry Revenue (Million), by Vehicle Type 2025 & 2033
- Figure 9: South America Light Vehicle Industry Revenue Share (%), by Vehicle Type 2025 & 2033
- Figure 10: South America Light Vehicle Industry Revenue (Million), by Propulsion Type 2025 & 2033
- Figure 11: South America Light Vehicle Industry Revenue Share (%), by Propulsion Type 2025 & 2033
- Figure 12: South America Light Vehicle Industry Revenue (Million), by Country 2025 & 2033
- Figure 13: South America Light Vehicle Industry Revenue Share (%), by Country 2025 & 2033
- Figure 14: Europe Light Vehicle Industry Revenue (Million), by Vehicle Type 2025 & 2033
- Figure 15: Europe Light Vehicle Industry Revenue Share (%), by Vehicle Type 2025 & 2033
- Figure 16: Europe Light Vehicle Industry Revenue (Million), by Propulsion Type 2025 & 2033
- Figure 17: Europe Light Vehicle Industry Revenue Share (%), by Propulsion Type 2025 & 2033
- Figure 18: Europe Light Vehicle Industry Revenue (Million), by Country 2025 & 2033
- Figure 19: Europe Light Vehicle Industry Revenue Share (%), by Country 2025 & 2033
- Figure 20: Middle East & Africa Light Vehicle Industry Revenue (Million), by Vehicle Type 2025 & 2033
- Figure 21: Middle East & Africa Light Vehicle Industry Revenue Share (%), by Vehicle Type 2025 & 2033
- Figure 22: Middle East & Africa Light Vehicle Industry Revenue (Million), by Propulsion Type 2025 & 2033
- Figure 23: Middle East & Africa Light Vehicle Industry Revenue Share (%), by Propulsion Type 2025 & 2033
- Figure 24: Middle East & Africa Light Vehicle Industry Revenue (Million), by Country 2025 & 2033
- Figure 25: Middle East & Africa Light Vehicle Industry Revenue Share (%), by Country 2025 & 2033
- Figure 26: Asia Pacific Light Vehicle Industry Revenue (Million), by Vehicle Type 2025 & 2033
- Figure 27: Asia Pacific Light Vehicle Industry Revenue Share (%), by Vehicle Type 2025 & 2033
- Figure 28: Asia Pacific Light Vehicle Industry Revenue (Million), by Propulsion Type 2025 & 2033
- Figure 29: Asia Pacific Light Vehicle Industry Revenue Share (%), by Propulsion Type 2025 & 2033
- Figure 30: Asia Pacific Light Vehicle Industry Revenue (Million), by Country 2025 & 2033
- Figure 31: Asia Pacific Light Vehicle Industry Revenue Share (%), by Country 2025 & 2033
List of Tables
- Table 1: Global Light Vehicle Industry Revenue Million Forecast, by Vehicle Type 2020 & 2033
- Table 2: Global Light Vehicle Industry Revenue Million Forecast, by Propulsion Type 2020 & 2033
- Table 3: Global Light Vehicle Industry Revenue Million Forecast, by Region 2020 & 2033
- Table 4: Global Light Vehicle Industry Revenue Million Forecast, by Vehicle Type 2020 & 2033
- Table 5: Global Light Vehicle Industry Revenue Million Forecast, by Propulsion Type 2020 & 2033
- Table 6: Global Light Vehicle Industry Revenue Million Forecast, by Country 2020 & 2033
- Table 7: United States Light Vehicle Industry Revenue (Million) Forecast, by Application 2020 & 2033
- Table 8: Canada Light Vehicle Industry Revenue (Million) Forecast, by Application 2020 & 2033
- Table 9: Mexico Light Vehicle Industry Revenue (Million) Forecast, by Application 2020 & 2033
- Table 10: Global Light Vehicle Industry Revenue Million Forecast, by Vehicle Type 2020 & 2033
- Table 11: Global Light Vehicle Industry Revenue Million Forecast, by Propulsion Type 2020 & 2033
- Table 12: Global Light Vehicle Industry Revenue Million Forecast, by Country 2020 & 2033
- Table 13: Brazil Light Vehicle Industry Revenue (Million) Forecast, by Application 2020 & 2033
- Table 14: Argentina Light Vehicle Industry Revenue (Million) Forecast, by Application 2020 & 2033
- Table 15: Rest of South America Light Vehicle Industry Revenue (Million) Forecast, by Application 2020 & 2033
- Table 16: Global Light Vehicle Industry Revenue Million Forecast, by Vehicle Type 2020 & 2033
- Table 17: Global Light Vehicle Industry Revenue Million Forecast, by Propulsion Type 2020 & 2033
- Table 18: Global Light Vehicle Industry Revenue Million Forecast, by Country 2020 & 2033
- Table 19: United Kingdom Light Vehicle Industry Revenue (Million) Forecast, by Application 2020 & 2033
- Table 20: Germany Light Vehicle Industry Revenue (Million) Forecast, by Application 2020 & 2033
- Table 21: France Light Vehicle Industry Revenue (Million) Forecast, by Application 2020 & 2033
- Table 22: Italy Light Vehicle Industry Revenue (Million) Forecast, by Application 2020 & 2033
- Table 23: Spain Light Vehicle Industry Revenue (Million) Forecast, by Application 2020 & 2033
- Table 24: Russia Light Vehicle Industry Revenue (Million) Forecast, by Application 2020 & 2033
- Table 25: Benelux Light Vehicle Industry Revenue (Million) Forecast, by Application 2020 & 2033
- Table 26: Nordics Light Vehicle Industry Revenue (Million) Forecast, by Application 2020 & 2033
- Table 27: Rest of Europe Light Vehicle Industry Revenue (Million) Forecast, by Application 2020 & 2033
- Table 28: Global Light Vehicle Industry Revenue Million Forecast, by Vehicle Type 2020 & 2033
- Table 29: Global Light Vehicle Industry Revenue Million Forecast, by Propulsion Type 2020 & 2033
- Table 30: Global Light Vehicle Industry Revenue Million Forecast, by Country 2020 & 2033
- Table 31: Turkey Light Vehicle Industry Revenue (Million) Forecast, by Application 2020 & 2033
- Table 32: Israel Light Vehicle Industry Revenue (Million) Forecast, by Application 2020 & 2033
- Table 33: GCC Light Vehicle Industry Revenue (Million) Forecast, by Application 2020 & 2033
- Table 34: North Africa Light Vehicle Industry Revenue (Million) Forecast, by Application 2020 & 2033
- Table 35: South Africa Light Vehicle Industry Revenue (Million) Forecast, by Application 2020 & 2033
- Table 36: Rest of Middle East & Africa Light Vehicle Industry Revenue (Million) Forecast, by Application 2020 & 2033
- Table 37: Global Light Vehicle Industry Revenue Million Forecast, by Vehicle Type 2020 & 2033
- Table 38: Global Light Vehicle Industry Revenue Million Forecast, by Propulsion Type 2020 & 2033
- Table 39: Global Light Vehicle Industry Revenue Million Forecast, by Country 2020 & 2033
- Table 40: China Light Vehicle Industry Revenue (Million) Forecast, by Application 2020 & 2033
- Table 41: India Light Vehicle Industry Revenue (Million) Forecast, by Application 2020 & 2033
- Table 42: Japan Light Vehicle Industry Revenue (Million) Forecast, by Application 2020 & 2033
- Table 43: South Korea Light Vehicle Industry Revenue (Million) Forecast, by Application 2020 & 2033
- Table 44: ASEAN Light Vehicle Industry Revenue (Million) Forecast, by Application 2020 & 2033
- Table 45: Oceania Light Vehicle Industry Revenue (Million) Forecast, by Application 2020 & 2033
- Table 46: Rest of Asia Pacific Light Vehicle Industry Revenue (Million) Forecast, by Application 2020 & 2033
Frequently Asked Questions
1. What is the projected Compound Annual Growth Rate (CAGR) of the Light Vehicle Industry?
The projected CAGR is approximately > 20.00%.
2. Which companies are prominent players in the Light Vehicle Industry?
Key companies in the market include Ashok Leyland Limited, Nissan Motor Co Ltd, Isuzu Motors Limited, General Motors Company, Dongfeng Motor Corporation, Volkswagen AG, Daimler AG (Mercedes-Benz AG), Tata Motors Limited, BAIC Motor Corporation Ltd, Volvo Grou, Mahindra & Mahindra Limited, BYD Auto Co Ltd, Groupe Renault, Rivian Automotive Inc, Ford Motor Company.
3. What are the main segments of the Light Vehicle Industry?
The market segments include Vehicle Type, Propulsion Type.
4. Can you provide details about the market size?
The market size is estimated to be USD XX Million as of 2022.
5. What are some drivers contributing to market growth?
Growing Travel and Tourism Industry is Driving the Car Rental Market.
6. What are the notable trends driving market growth?
OTHER KEY INDUSTRY TRENDS COVERED IN THE REPORT.
7. Are there any restraints impacting market growth?
Increasing Popularity of Ride-Sharing Services Pose Challenges for the Conventional Car Rental Market.
8. Can you provide examples of recent developments in the market?
August 2023: General Motors will launch an all-electric Cadillac Escalade in late 2024August 2023: General Motors doubles down on plans for an electric future in the Middle East.August 2023: Gabriel India Limited (Gabriel India), a flagship company of Anand Group, announced that during the quarter that ended on June 30, 2023, it has developed components for Maruti Suzuki Jimny and Stellantis electric Citroen C3. At present it is developing parts for new models of VW, Tata, Stellantis, Mahindra, and Maruti Suzuki.
9. What pricing options are available for accessing the report?
Pricing options include single-user, multi-user, and enterprise licenses priced at USD 3800, USD 4500, and USD 5800 respectively.
10. Is the market size provided in terms of value or volume?
The market size is provided in terms of value, measured in Million.
11. Are there any specific market keywords associated with the report?
Yes, the market keyword associated with the report is "Light Vehicle Industry," which aids in identifying and referencing the specific market segment covered.
12. How do I determine which pricing option suits my needs best?
The pricing options vary based on user requirements and access needs. Individual users may opt for single-user licenses, while businesses requiring broader access may choose multi-user or enterprise licenses for cost-effective access to the report.
13. Are there any additional resources or data provided in the Light Vehicle Industry report?
While the report offers comprehensive insights, it's advisable to review the specific contents or supplementary materials provided to ascertain if additional resources or data are available.
14. How can I stay updated on further developments or reports in the Light Vehicle Industry?
To stay informed about further developments, trends, and reports in the Light Vehicle Industry, consider subscribing to industry newsletters, following relevant companies and organizations, or regularly checking reputable industry news sources and publications.
Methodology
Step 1 - Identification of Relevant Samples Size from Population Database


Step 2 - Approaches for Defining Global Market Size (Value, Volume* & Price*)

Note*: In applicable scenarios
Step 3 - Data Sources
Primary Research
- Web Analytics
- Survey Reports
- Research Institute
- Latest Research Reports
- Opinion Leaders
Secondary Research
- Annual Reports
- White Paper
- Latest Press Release
- Industry Association
- Paid Database
- Investor Presentations

Step 4 - Data Triangulation
Involves using different sources of information in order to increase the validity of a study
These sources are likely to be stakeholders in a program - participants, other researchers, program staff, other community members, and so on.
Then we put all data in single framework & apply various statistical tools to find out the dynamic on the market.
During the analysis stage, feedback from the stakeholder groups would be compared to determine areas of agreement as well as areas of divergence