Global Perspectives on Liquid Hydrogen Industry Growth: 2025-2033 Insights

Liquid Hydrogen Industry by Distribution (Cryogenic Tank, High-Pressure Tube Trailers), by End-user Industry (Automotive, Aerospace (including Outer Space), Marine, Other End-User Industries), by Asia Pacific (China, India, Japan, South Korea, Rest of Asia Pacific), by North America (United States, Canada, Mexico), by Europe (Germany, United Kingdom, Italy, France, Rest of Europe), by Rest of the World (South America, Middle East and Africa) Forecast 2025-2033

Jul 3 2025
Base Year: 2024

180 Pages
Main Logo

Global Perspectives on Liquid Hydrogen Industry Growth: 2025-2033 Insights


Home
Industries
Chemicals & Materials
sponsor image
sponsor image
sponsor image
sponsor image

Tailored for you

  • In-depth Analysis Tailored to Specified Regions or Segments
  • Company Profiles Customized to User Preferences
  • Comprehensive Insights Focused on Specific Segments or Regions
  • Customized Evaluation of Competitive Landscape to Meet Your Needs
  • Tailored Customization to Address Other Specific Requirements
Ask for customization


Key Insights

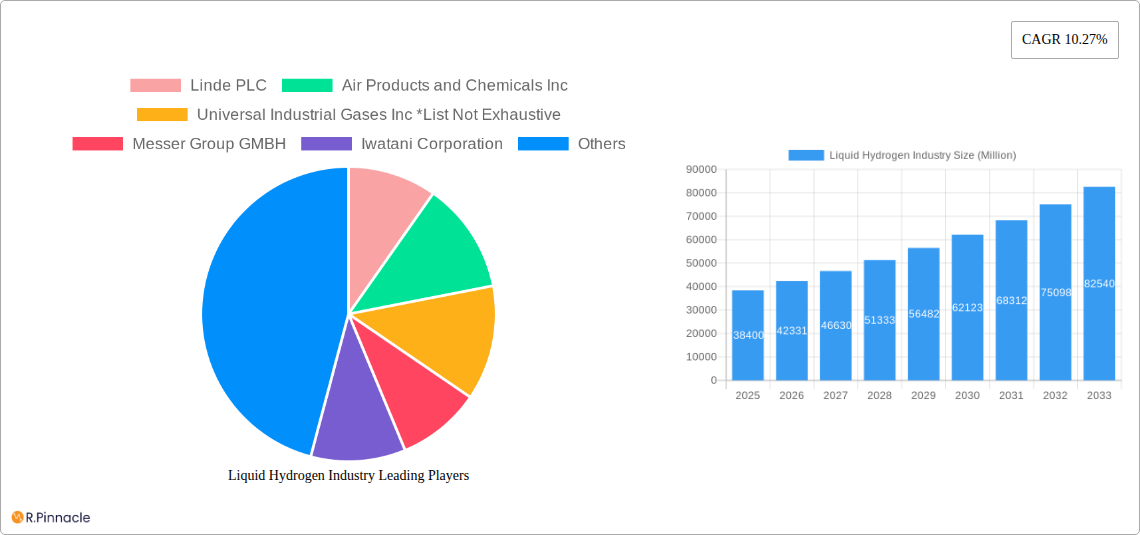
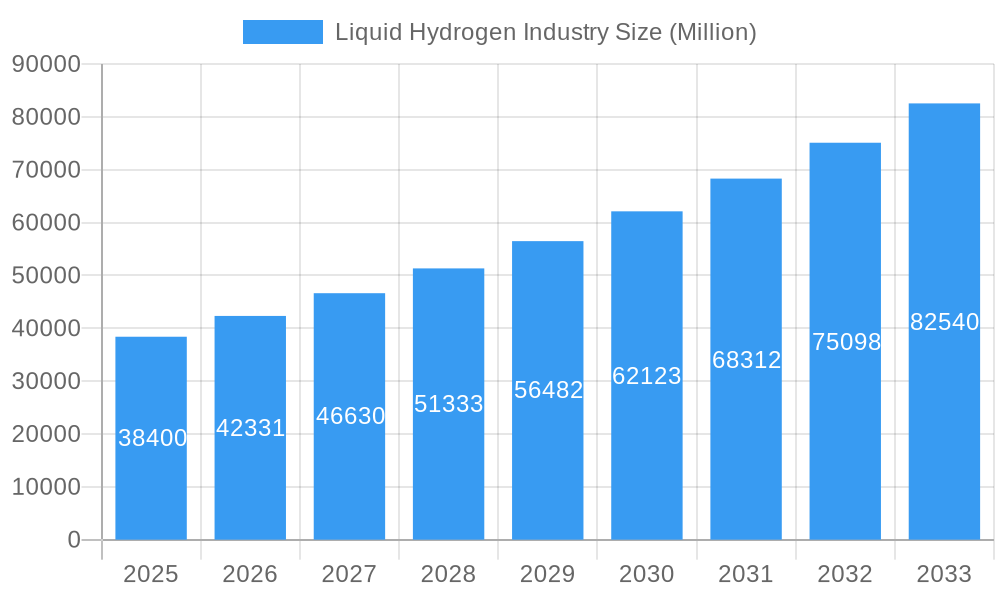
The global liquid hydrogen market, valued at $38.4 billion in 2025, is projected to experience robust growth, driven by the increasing demand for clean energy and the burgeoning adoption of hydrogen fuel cell technology across various sectors. A compound annual growth rate (CAGR) of 10.27% from 2025 to 2033 signifies a significant expansion, propelled by several key factors. The automotive industry's push towards zero-emission vehicles, coupled with the expanding aerospace sector's need for sustainable propulsion systems, are major contributors to this growth. Furthermore, advancements in cryogenic storage and transportation technologies, like improved cryogenic tanks and high-pressure tube trailers, are enhancing the efficiency and cost-effectiveness of liquid hydrogen distribution, facilitating market expansion. While challenges remain, such as the high cost of production and infrastructure limitations, ongoing technological advancements and supportive government policies are expected to mitigate these restraints. The market segmentation reflects this diverse demand, with significant contributions from automotive, aerospace, and marine end-user industries. Geographical distribution reveals strong growth potential across North America, Europe, and Asia-Pacific, driven by substantial investments in renewable energy sources and hydrogen infrastructure development.

Growth within specific segments will likely be uneven. The aerospace sector, including outer space applications, is expected to demonstrate strong growth due to its urgent need for sustainable fuel alternatives. Similarly, the automotive industry's increasing adoption of hydrogen fuel cell vehicles will fuel considerable expansion. The marine industry's adoption, while perhaps slower initially, shows high potential for long-term growth as environmentally conscious shipping becomes a priority. Regional variations will also exist, with North America and Europe maintaining a significant market share due to established infrastructure and government support. However, rapid industrialization and government initiatives in Asia-Pacific are likely to fuel significant growth in this region over the forecast period. The competitive landscape is characterized by both established players, such as Linde PLC, Air Products and Chemicals Inc., and Air Liquide, and emerging companies focused on technological advancements and cost reduction. The market will likely see increased consolidation and strategic partnerships as companies strive to secure their position in this rapidly evolving sector.

Liquid Hydrogen Industry: A Comprehensive Market Report (2019-2033)

This in-depth report provides a comprehensive analysis of the liquid hydrogen industry, covering market size, growth drivers, challenges, and future opportunities. With a study period spanning 2019-2033, a base year of 2025, and a forecast period of 2025-2033, this report offers invaluable insights for industry professionals, investors, and stakeholders. The report leverages extensive data and analysis to provide actionable intelligence, focusing on key players such as Linde PLC, Air Products and Chemicals Inc., and Air Liquide, among others. The market is projected to reach xx Million by 2033, showcasing significant growth potential.

Liquid Hydrogen Industry Research Report - Market Size, Growth & Forecast

Liquid Hydrogen Industry Market Structure & Innovation Trends

The liquid hydrogen industry is characterized by a moderately concentrated market structure, with key players like Linde PLC, Air Products and Chemicals Inc., Air Liquide, Messer Group GMBH, Iwatani Corporation, Nippon Sanso Holdings Corporation, and Praxair Technology Inc. holding significant market share. While precise market share figures vary depending on the segment and region, these companies collectively account for a substantial portion of global production and distribution. The industry is witnessing significant innovation driven by the increasing demand for clean energy solutions and supportive government policies.

  • Innovation Drivers: Advancements in cryogenic storage and transportation technologies, coupled with progress in hydrogen production methods (including electrolysis powered by renewable sources), are major catalysts.
  • Regulatory Frameworks: Government regulations and incentives, particularly those promoting green hydrogen production and infrastructure development, play a crucial role in shaping market dynamics.
  • Product Substitutes: While liquid hydrogen faces competition from other energy sources and storage methods (e.g., batteries, compressed natural gas), its unique properties and environmental advantages offer distinct competitive benefits.
  • End-User Demographics: The key end-user industries – automotive, aerospace, and marine – represent rapidly growing segments, driving demand for liquid hydrogen.
  • M&A Activities: Recent years have seen several significant mergers and acquisitions, with deal values exceeding xx Million in some cases, highlighting industry consolidation and investment. For instance, Air Liquide's USD 250 Million investment in a liquid hydrogen production facility demonstrates the scale of current investments.
Liquid Hydrogen Industry Growth

Liquid Hydrogen Industry Market Dynamics & Trends

The global liquid hydrogen market is experiencing substantial growth, driven by a confluence of factors. The increasing demand for cleaner energy solutions, coupled with technological advancements in hydrogen production and storage, is fueling market expansion. The compound annual growth rate (CAGR) is projected to be xx% during the forecast period (2025-2033), with market penetration increasing significantly in key end-user sectors. Technological disruptions, such as the development of more efficient electrolyzers and improved cryogenic tank designs, are further enhancing the competitiveness and economic viability of liquid hydrogen. Consumer preferences are shifting towards environmentally friendly alternatives, creating a strong demand for green hydrogen produced from renewable sources. Competitive dynamics are largely shaped by the ongoing efforts of major players to expand production capacity, optimize supply chains, and develop innovative solutions.

Liquid Hydrogen Industry Growth

Dominant Regions & Segments in Liquid Hydrogen Industry

The dominance within the liquid hydrogen industry varies by segment. However, based on current trends, several key areas stand out:

  • Leading Regions: North America and Asia are currently leading the market, driven by strong government support, substantial investments in renewable energy infrastructure, and a growing focus on clean transportation. Europe is also showing considerable growth.
  • Dominant Distribution Segments: Cryogenic tanks currently constitute the largest segment of the distribution market due to their established technology and capacity for large-scale hydrogen storage and transportation. However, high-pressure tube trailers are gaining traction due to their improved efficiency in certain applications.
  • Leading End-User Industries: The automotive sector, propelled by the growing adoption of fuel-cell electric vehicles, holds significant potential. Aerospace (including outer space) is another critical segment owing to liquid hydrogen's role as a potent rocket propellant. The marine sector represents a growing market segment, as liquid hydrogen is increasingly being seen as a viable fuel for ships. Other end-user industries are also emerging, including industrial applications and power generation.

Key Drivers: Economic policies favoring clean energy adoption, coupled with investments in research and development, are paramount. Additionally, the expansion of refueling infrastructure is crucial for widespread adoption, especially in the automotive and marine sectors.

Liquid Hydrogen Industry Product Innovations

Recent innovations focus on enhancing the efficiency and cost-effectiveness of liquid hydrogen production, storage, and transportation. Advancements in cryogenic tank technology, improved electrolyzer designs, and the development of more efficient high-pressure tube trailers are key developments. These innovations are improving safety, lowering costs, and expanding the range of applications for liquid hydrogen. This directly addresses the market’s need for a more practical and economically viable clean energy solution.

Report Scope & Segmentation Analysis

This report segments the liquid hydrogen market based on distribution methods (Cryogenic Tank and High-Pressure Tube Trailers) and end-user industries (Automotive, Aerospace, Marine, and Other End-User Industries). Each segment is analyzed in terms of its current market size, growth projections, and competitive dynamics.

  • Distribution: The cryogenic tank segment holds the largest market share currently, but high-pressure tube trailers are expected to show higher growth in the forecast period due to improved efficiency and lower costs for certain applications.
  • End-user Industries: The Automotive sector is projected to have the fastest growth due to the rising adoption of fuel cell electric vehicles. The Aerospace and Marine sectors are also showing significant growth potential. The "Other End-User Industries" segment includes various industrial applications where liquid hydrogen is increasingly being adopted as a cleaner alternative.

Key Drivers of Liquid Hydrogen Industry Growth

The liquid hydrogen industry's growth is driven by several factors: the increasing urgency to reduce greenhouse gas emissions, supportive government policies and subsidies, technological advancements reducing production costs, and the growing demand for cleaner energy solutions across various sectors. The automotive industry's push toward fuel cell electric vehicles is a significant driver, alongside increasing investments in renewable energy sources (like solar and wind) used to power electrolyzers for green hydrogen production.

Challenges in the Liquid Hydrogen Industry Sector

Challenges include the high cost of production, energy-intensive liquefaction processes, and the need for specialized infrastructure for storage and transportation. Regulatory uncertainty in some regions and safety concerns related to hydrogen handling also pose significant hurdles. Supply chain issues, particularly concerning the availability of certain components for electrolyzers and cryogenic equipment, can also lead to production bottlenecks. Furthermore, competition from alternative clean energy technologies presents a continuous challenge.

Emerging Opportunities in Liquid Hydrogen Industry

The burgeoning market offers substantial opportunities. The development of more efficient and cost-effective electrolyzers is a key area. The expansion into new markets, particularly in developing economies with a strong push for clean energy, offers significant potential. Further advancements in hydrogen storage and transportation technologies, along with innovations in fuel cell technology for various applications, will unlock further market growth.

Leading Players in the Liquid Hydrogen Industry Market

  • Linde PLC
  • Air Products and Chemicals Inc.
  • Universal Industrial Gases Inc
  • Messer Group GMBH
  • Iwatani Corporation
  • Air Liquide
  • Nippon Sanso Holdings Corporation
  • Praxair Technology Inc.
  • ITM Power

Key Developments in Liquid Hydrogen Industry

  • May 2022: Air Liquide invested USD 250 Million in a large liquid hydrogen production facility in Nevada, significantly boosting its production capacity.
  • Sept 2022: Linde announced the construction of a 35-megawatt electrolyzer in New York, expanding its green hydrogen production capabilities.
  • Mar 2023: Iwatani Corporation and ENEOS Corporation launched a project to develop marine transportation technologies for liquefied hydrogen, aiming for a cost reduction to 30 JPY/Nm3 by 2030.

Future Outlook for Liquid Hydrogen Industry Market

The liquid hydrogen market is poised for substantial growth, driven by continued technological advancements, supportive government policies, and the increasing urgency to decarbonize various sectors. Strategic partnerships, investments in R&D, and the expansion of infrastructure will play crucial roles in shaping future market dynamics. The development of green hydrogen production methods and efficient storage and transport solutions will be vital to unlocking the full potential of this promising industry.

Liquid Hydrogen Industry Segmentation

  • 1. Distribution
    • 1.1. Cryogenic Tank
    • 1.2. High-Pressure Tube Trailers
  • 2. End-user Industry
    • 2.1. Automotive
    • 2.2. Aerospace (including Outer Space)
    • 2.3. Marine
    • 2.4. Other End-User Industries

Liquid Hydrogen Industry Segmentation By Geography

  • 1. Asia Pacific
    • 1.1. China
    • 1.2. India
    • 1.3. Japan
    • 1.4. South Korea
    • 1.5. Rest of Asia Pacific
  • 2. North America
    • 2.1. United States
    • 2.2. Canada
    • 2.3. Mexico
  • 3. Europe
    • 3.1. Germany
    • 3.2. United Kingdom
    • 3.3. Italy
    • 3.4. France
    • 3.5. Rest of Europe
  • 4. Rest of the World
    • 4.1. South America
    • 4.2. Middle East and Africa
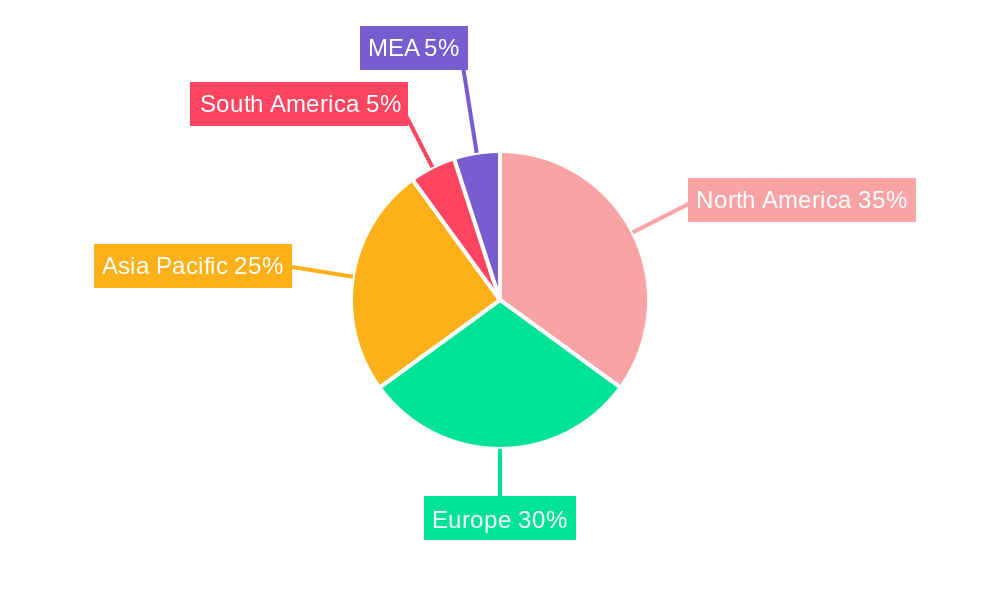
Liquid Hydrogen Industry Regional Share


Liquid Hydrogen Industry REPORT HIGHLIGHTS

AspectsDetails
Study Period 2019-2033
Base Year 2024
Estimated Year 2025
Forecast Period2025-2033
Historical Period2019-2024
Growth RateCAGR of 10.27% from 2019-2033
Segmentation
    • By Distribution
      • Cryogenic Tank
      • High-Pressure Tube Trailers
    • By End-user Industry
      • Automotive
      • Aerospace (including Outer Space)
      • Marine
      • Other End-User Industries
  • By Geography
    • Asia Pacific
      • China
      • India
      • Japan
      • South Korea
      • Rest of Asia Pacific
    • North America
      • United States
      • Canada
      • Mexico
    • Europe
      • Germany
      • United Kingdom
      • Italy
      • France
      • Rest of Europe
    • Rest of the World
      • South America
      • Middle East and Africa


Table of Contents

  1. 1. Introduction
    • 1.1. Research Scope
    • 1.2. Market Segmentation
    • 1.3. Research Methodology
    • 1.4. Definitions and Assumptions
  2. 2. Executive Summary
    • 2.1. Introduction
  3. 3. Market Dynamics
    • 3.1. Introduction
      • 3.2. Market Drivers
        • 3.2.1. Growing Demand for Liquid Hydrogen for Space Exploration; Increasing Adoption of Hydrogen Fuel Cell in Commercial Vehicle
      • 3.3. Market Restrains
        • 3.3.1. High Cost Associated with Handling and Storage; Other Restraints
      • 3.4. Market Trends
        • 3.4.1. Aerospace Industry to Dominate the Market
  4. 4. Market Factor Analysis
    • 4.1. Porters Five Forces
    • 4.2. Supply/Value Chain
    • 4.3. PESTEL analysis
    • 4.4. Market Entropy
    • 4.5. Patent/Trademark Analysis
  5. 5. Global Liquid Hydrogen Industry Analysis, Insights and Forecast, 2019-2031
    • 5.1. Market Analysis, Insights and Forecast - by Distribution
      • 5.1.1. Cryogenic Tank
      • 5.1.2. High-Pressure Tube Trailers
    • 5.2. Market Analysis, Insights and Forecast - by End-user Industry
      • 5.2.1. Automotive
      • 5.2.2. Aerospace (including Outer Space)
      • 5.2.3. Marine
      • 5.2.4. Other End-User Industries
    • 5.3. Market Analysis, Insights and Forecast - by Region
      • 5.3.1. Asia Pacific
      • 5.3.2. North America
      • 5.3.3. Europe
      • 5.3.4. Rest of the World
  6. 6. Asia Pacific Liquid Hydrogen Industry Analysis, Insights and Forecast, 2019-2031
    • 6.1. Market Analysis, Insights and Forecast - by Distribution
      • 6.1.1. Cryogenic Tank
      • 6.1.2. High-Pressure Tube Trailers
    • 6.2. Market Analysis, Insights and Forecast - by End-user Industry
      • 6.2.1. Automotive
      • 6.2.2. Aerospace (including Outer Space)
      • 6.2.3. Marine
      • 6.2.4. Other End-User Industries
  7. 7. North America Liquid Hydrogen Industry Analysis, Insights and Forecast, 2019-2031
    • 7.1. Market Analysis, Insights and Forecast - by Distribution
      • 7.1.1. Cryogenic Tank
      • 7.1.2. High-Pressure Tube Trailers
    • 7.2. Market Analysis, Insights and Forecast - by End-user Industry
      • 7.2.1. Automotive
      • 7.2.2. Aerospace (including Outer Space)
      • 7.2.3. Marine
      • 7.2.4. Other End-User Industries
  8. 8. Europe Liquid Hydrogen Industry Analysis, Insights and Forecast, 2019-2031
    • 8.1. Market Analysis, Insights and Forecast - by Distribution
      • 8.1.1. Cryogenic Tank
      • 8.1.2. High-Pressure Tube Trailers
    • 8.2. Market Analysis, Insights and Forecast - by End-user Industry
      • 8.2.1. Automotive
      • 8.2.2. Aerospace (including Outer Space)
      • 8.2.3. Marine
      • 8.2.4. Other End-User Industries
  9. 9. Rest of the World Liquid Hydrogen Industry Analysis, Insights and Forecast, 2019-2031
    • 9.1. Market Analysis, Insights and Forecast - by Distribution
      • 9.1.1. Cryogenic Tank
      • 9.1.2. High-Pressure Tube Trailers
    • 9.2. Market Analysis, Insights and Forecast - by End-user Industry
      • 9.2.1. Automotive
      • 9.2.2. Aerospace (including Outer Space)
      • 9.2.3. Marine
      • 9.2.4. Other End-User Industries
  10. 10. North America Liquid Hydrogen Industry Analysis, Insights and Forecast, 2019-2031
      • 10.1. Market Analysis, Insights and Forecast - By Country/Sub-region
        • 10.1.1 United States
        • 10.1.2 Canada
        • 10.1.3 Mexico
  11. 11. Europe Liquid Hydrogen Industry Analysis, Insights and Forecast, 2019-2031
      • 11.1. Market Analysis, Insights and Forecast - By Country/Sub-region
        • 11.1.1 Germany
        • 11.1.2 United Kingdom
        • 11.1.3 France
        • 11.1.4 Spain
        • 11.1.5 Italy
        • 11.1.6 Spain
        • 11.1.7 Belgium
        • 11.1.8 Netherland
        • 11.1.9 Nordics
        • 11.1.10 Rest of Europe
  12. 12. Asia Pacific Liquid Hydrogen Industry Analysis, Insights and Forecast, 2019-2031
      • 12.1. Market Analysis, Insights and Forecast - By Country/Sub-region
        • 12.1.1 China
        • 12.1.2 Japan
        • 12.1.3 India
        • 12.1.4 South Korea
        • 12.1.5 Southeast Asia
        • 12.1.6 Australia
        • 12.1.7 Indonesia
        • 12.1.8 Phillipes
        • 12.1.9 Singapore
        • 12.1.10 Thailandc
        • 12.1.11 Rest of Asia Pacific
  13. 13. South America Liquid Hydrogen Industry Analysis, Insights and Forecast, 2019-2031
      • 13.1. Market Analysis, Insights and Forecast - By Country/Sub-region
        • 13.1.1 Brazil
        • 13.1.2 Argentina
        • 13.1.3 Peru
        • 13.1.4 Chile
        • 13.1.5 Colombia
        • 13.1.6 Ecuador
        • 13.1.7 Venezuela
        • 13.1.8 Rest of South America
  14. 14. North America Liquid Hydrogen Industry Analysis, Insights and Forecast, 2019-2031
      • 14.1. Market Analysis, Insights and Forecast - By Country/Sub-region
        • 14.1.1 United States
        • 14.1.2 Canada
        • 14.1.3 Mexico
  15. 15. MEA Liquid Hydrogen Industry Analysis, Insights and Forecast, 2019-2031
      • 15.1. Market Analysis, Insights and Forecast - By Country/Sub-region
        • 15.1.1 United Arab Emirates
        • 15.1.2 Saudi Arabia
        • 15.1.3 South Africa
        • 15.1.4 Rest of Middle East and Africa
  16. 16. Competitive Analysis
    • 16.1. Global Market Share Analysis 2024
      • 16.2. Company Profiles
        • 16.2.1 Linde PLC
          • 16.2.1.1. Overview
          • 16.2.1.2. Products
          • 16.2.1.3. SWOT Analysis
          • 16.2.1.4. Recent Developments
          • 16.2.1.5. Financials (Based on Availability)
        • 16.2.2 Air Products and Chemicals Inc
          • 16.2.2.1. Overview
          • 16.2.2.2. Products
          • 16.2.2.3. SWOT Analysis
          • 16.2.2.4. Recent Developments
          • 16.2.2.5. Financials (Based on Availability)
        • 16.2.3 Universal Industrial Gases Inc *List Not Exhaustive
          • 16.2.3.1. Overview
          • 16.2.3.2. Products
          • 16.2.3.3. SWOT Analysis
          • 16.2.3.4. Recent Developments
          • 16.2.3.5. Financials (Based on Availability)
        • 16.2.4 Messer Group GMBH
          • 16.2.4.1. Overview
          • 16.2.4.2. Products
          • 16.2.4.3. SWOT Analysis
          • 16.2.4.4. Recent Developments
          • 16.2.4.5. Financials (Based on Availability)
        • 16.2.5 Iwatani Corporation
          • 16.2.5.1. Overview
          • 16.2.5.2. Products
          • 16.2.5.3. SWOT Analysis
          • 16.2.5.4. Recent Developments
          • 16.2.5.5. Financials (Based on Availability)
        • 16.2.6 Air Liquide
          • 16.2.6.1. Overview
          • 16.2.6.2. Products
          • 16.2.6.3. SWOT Analysis
          • 16.2.6.4. Recent Developments
          • 16.2.6.5. Financials (Based on Availability)
        • 16.2.7 Nippon Sanso Holdings Corporation
          • 16.2.7.1. Overview
          • 16.2.7.2. Products
          • 16.2.7.3. SWOT Analysis
          • 16.2.7.4. Recent Developments
          • 16.2.7.5. Financials (Based on Availability)
        • 16.2.8 Nippon Sanso Holdings Corporation
          • 16.2.8.1. Overview
          • 16.2.8.2. Products
          • 16.2.8.3. SWOT Analysis
          • 16.2.8.4. Recent Developments
          • 16.2.8.5. Financials (Based on Availability)
        • 16.2.9 Praxair Technology Inc.
          • 16.2.9.1. Overview
          • 16.2.9.2. Products
          • 16.2.9.3. SWOT Analysis
          • 16.2.9.4. Recent Developments
          • 16.2.9.5. Financials (Based on Availability)
        • 16.2.10 ITM Power
          • 16.2.10.1. Overview
          • 16.2.10.2. Products
          • 16.2.10.3. SWOT Analysis
          • 16.2.10.4. Recent Developments
          • 16.2.10.5. Financials (Based on Availability)

List of Figures

  1. Figure 1: Global Liquid Hydrogen Industry Revenue Breakdown (Million, %) by Region 2024 & 2032
  2. Figure 2: Global Liquid Hydrogen Industry Volume Breakdown (kilotons, %) by Region 2024 & 2032
  3. Figure 3: North America Liquid Hydrogen Industry Revenue (Million), by Country 2024 & 2032
  4. Figure 4: North America Liquid Hydrogen Industry Volume (kilotons), by Country 2024 & 2032
  5. Figure 5: North America Liquid Hydrogen Industry Revenue Share (%), by Country 2024 & 2032
  6. Figure 6: North America Liquid Hydrogen Industry Volume Share (%), by Country 2024 & 2032
  7. Figure 7: Europe Liquid Hydrogen Industry Revenue (Million), by Country 2024 & 2032
  8. Figure 8: Europe Liquid Hydrogen Industry Volume (kilotons), by Country 2024 & 2032
  9. Figure 9: Europe Liquid Hydrogen Industry Revenue Share (%), by Country 2024 & 2032
  10. Figure 10: Europe Liquid Hydrogen Industry Volume Share (%), by Country 2024 & 2032
  11. Figure 11: Asia Pacific Liquid Hydrogen Industry Revenue (Million), by Country 2024 & 2032
  12. Figure 12: Asia Pacific Liquid Hydrogen Industry Volume (kilotons), by Country 2024 & 2032
  13. Figure 13: Asia Pacific Liquid Hydrogen Industry Revenue Share (%), by Country 2024 & 2032
  14. Figure 14: Asia Pacific Liquid Hydrogen Industry Volume Share (%), by Country 2024 & 2032
  15. Figure 15: South America Liquid Hydrogen Industry Revenue (Million), by Country 2024 & 2032
  16. Figure 16: South America Liquid Hydrogen Industry Volume (kilotons), by Country 2024 & 2032
  17. Figure 17: South America Liquid Hydrogen Industry Revenue Share (%), by Country 2024 & 2032
  18. Figure 18: South America Liquid Hydrogen Industry Volume Share (%), by Country 2024 & 2032
  19. Figure 19: North America Liquid Hydrogen Industry Revenue (Million), by Country 2024 & 2032
  20. Figure 20: North America Liquid Hydrogen Industry Volume (kilotons), by Country 2024 & 2032
  21. Figure 21: North America Liquid Hydrogen Industry Revenue Share (%), by Country 2024 & 2032
  22. Figure 22: North America Liquid Hydrogen Industry Volume Share (%), by Country 2024 & 2032
  23. Figure 23: MEA Liquid Hydrogen Industry Revenue (Million), by Country 2024 & 2032
  24. Figure 24: MEA Liquid Hydrogen Industry Volume (kilotons), by Country 2024 & 2032
  25. Figure 25: MEA Liquid Hydrogen Industry Revenue Share (%), by Country 2024 & 2032
  26. Figure 26: MEA Liquid Hydrogen Industry Volume Share (%), by Country 2024 & 2032
  27. Figure 27: Asia Pacific Liquid Hydrogen Industry Revenue (Million), by Distribution 2024 & 2032
  28. Figure 28: Asia Pacific Liquid Hydrogen Industry Volume (kilotons), by Distribution 2024 & 2032
  29. Figure 29: Asia Pacific Liquid Hydrogen Industry Revenue Share (%), by Distribution 2024 & 2032
  30. Figure 30: Asia Pacific Liquid Hydrogen Industry Volume Share (%), by Distribution 2024 & 2032
  31. Figure 31: Asia Pacific Liquid Hydrogen Industry Revenue (Million), by End-user Industry 2024 & 2032
  32. Figure 32: Asia Pacific Liquid Hydrogen Industry Volume (kilotons), by End-user Industry 2024 & 2032
  33. Figure 33: Asia Pacific Liquid Hydrogen Industry Revenue Share (%), by End-user Industry 2024 & 2032
  34. Figure 34: Asia Pacific Liquid Hydrogen Industry Volume Share (%), by End-user Industry 2024 & 2032
  35. Figure 35: Asia Pacific Liquid Hydrogen Industry Revenue (Million), by Country 2024 & 2032
  36. Figure 36: Asia Pacific Liquid Hydrogen Industry Volume (kilotons), by Country 2024 & 2032
  37. Figure 37: Asia Pacific Liquid Hydrogen Industry Revenue Share (%), by Country 2024 & 2032
  38. Figure 38: Asia Pacific Liquid Hydrogen Industry Volume Share (%), by Country 2024 & 2032
  39. Figure 39: North America Liquid Hydrogen Industry Revenue (Million), by Distribution 2024 & 2032
  40. Figure 40: North America Liquid Hydrogen Industry Volume (kilotons), by Distribution 2024 & 2032
  41. Figure 41: North America Liquid Hydrogen Industry Revenue Share (%), by Distribution 2024 & 2032
  42. Figure 42: North America Liquid Hydrogen Industry Volume Share (%), by Distribution 2024 & 2032
  43. Figure 43: North America Liquid Hydrogen Industry Revenue (Million), by End-user Industry 2024 & 2032
  44. Figure 44: North America Liquid Hydrogen Industry Volume (kilotons), by End-user Industry 2024 & 2032
  45. Figure 45: North America Liquid Hydrogen Industry Revenue Share (%), by End-user Industry 2024 & 2032
  46. Figure 46: North America Liquid Hydrogen Industry Volume Share (%), by End-user Industry 2024 & 2032
  47. Figure 47: North America Liquid Hydrogen Industry Revenue (Million), by Country 2024 & 2032
  48. Figure 48: North America Liquid Hydrogen Industry Volume (kilotons), by Country 2024 & 2032
  49. Figure 49: North America Liquid Hydrogen Industry Revenue Share (%), by Country 2024 & 2032
  50. Figure 50: North America Liquid Hydrogen Industry Volume Share (%), by Country 2024 & 2032
  51. Figure 51: Europe Liquid Hydrogen Industry Revenue (Million), by Distribution 2024 & 2032
  52. Figure 52: Europe Liquid Hydrogen Industry Volume (kilotons), by Distribution 2024 & 2032
  53. Figure 53: Europe Liquid Hydrogen Industry Revenue Share (%), by Distribution 2024 & 2032
  54. Figure 54: Europe Liquid Hydrogen Industry Volume Share (%), by Distribution 2024 & 2032
  55. Figure 55: Europe Liquid Hydrogen Industry Revenue (Million), by End-user Industry 2024 & 2032
  56. Figure 56: Europe Liquid Hydrogen Industry Volume (kilotons), by End-user Industry 2024 & 2032
  57. Figure 57: Europe Liquid Hydrogen Industry Revenue Share (%), by End-user Industry 2024 & 2032
  58. Figure 58: Europe Liquid Hydrogen Industry Volume Share (%), by End-user Industry 2024 & 2032
  59. Figure 59: Europe Liquid Hydrogen Industry Revenue (Million), by Country 2024 & 2032
  60. Figure 60: Europe Liquid Hydrogen Industry Volume (kilotons), by Country 2024 & 2032
  61. Figure 61: Europe Liquid Hydrogen Industry Revenue Share (%), by Country 2024 & 2032
  62. Figure 62: Europe Liquid Hydrogen Industry Volume Share (%), by Country 2024 & 2032
  63. Figure 63: Rest of the World Liquid Hydrogen Industry Revenue (Million), by Distribution 2024 & 2032
  64. Figure 64: Rest of the World Liquid Hydrogen Industry Volume (kilotons), by Distribution 2024 & 2032
  65. Figure 65: Rest of the World Liquid Hydrogen Industry Revenue Share (%), by Distribution 2024 & 2032
  66. Figure 66: Rest of the World Liquid Hydrogen Industry Volume Share (%), by Distribution 2024 & 2032
  67. Figure 67: Rest of the World Liquid Hydrogen Industry Revenue (Million), by End-user Industry 2024 & 2032
  68. Figure 68: Rest of the World Liquid Hydrogen Industry Volume (kilotons), by End-user Industry 2024 & 2032
  69. Figure 69: Rest of the World Liquid Hydrogen Industry Revenue Share (%), by End-user Industry 2024 & 2032
  70. Figure 70: Rest of the World Liquid Hydrogen Industry Volume Share (%), by End-user Industry 2024 & 2032
  71. Figure 71: Rest of the World Liquid Hydrogen Industry Revenue (Million), by Country 2024 & 2032
  72. Figure 72: Rest of the World Liquid Hydrogen Industry Volume (kilotons), by Country 2024 & 2032
  73. Figure 73: Rest of the World Liquid Hydrogen Industry Revenue Share (%), by Country 2024 & 2032
  74. Figure 74: Rest of the World Liquid Hydrogen Industry Volume Share (%), by Country 2024 & 2032

List of Tables

  1. Table 1: Global Liquid Hydrogen Industry Revenue Million Forecast, by Region 2019 & 2032
  2. Table 2: Global Liquid Hydrogen Industry Volume kilotons Forecast, by Region 2019 & 2032
  3. Table 3: Global Liquid Hydrogen Industry Revenue Million Forecast, by Distribution 2019 & 2032
  4. Table 4: Global Liquid Hydrogen Industry Volume kilotons Forecast, by Distribution 2019 & 2032
  5. Table 5: Global Liquid Hydrogen Industry Revenue Million Forecast, by End-user Industry 2019 & 2032
  6. Table 6: Global Liquid Hydrogen Industry Volume kilotons Forecast, by End-user Industry 2019 & 2032
  7. Table 7: Global Liquid Hydrogen Industry Revenue Million Forecast, by Region 2019 & 2032
  8. Table 8: Global Liquid Hydrogen Industry Volume kilotons Forecast, by Region 2019 & 2032
  9. Table 9: Global Liquid Hydrogen Industry Revenue Million Forecast, by Country 2019 & 2032
  10. Table 10: Global Liquid Hydrogen Industry Volume kilotons Forecast, by Country 2019 & 2032
  11. Table 11: United States Liquid Hydrogen Industry Revenue (Million) Forecast, by Application 2019 & 2032
  12. Table 12: United States Liquid Hydrogen Industry Volume (kilotons) Forecast, by Application 2019 & 2032
  13. Table 13: Canada Liquid Hydrogen Industry Revenue (Million) Forecast, by Application 2019 & 2032
  14. Table 14: Canada Liquid Hydrogen Industry Volume (kilotons) Forecast, by Application 2019 & 2032
  15. Table 15: Mexico Liquid Hydrogen Industry Revenue (Million) Forecast, by Application 2019 & 2032
  16. Table 16: Mexico Liquid Hydrogen Industry Volume (kilotons) Forecast, by Application 2019 & 2032
  17. Table 17: Global Liquid Hydrogen Industry Revenue Million Forecast, by Country 2019 & 2032
  18. Table 18: Global Liquid Hydrogen Industry Volume kilotons Forecast, by Country 2019 & 2032
  19. Table 19: Germany Liquid Hydrogen Industry Revenue (Million) Forecast, by Application 2019 & 2032
  20. Table 20: Germany Liquid Hydrogen Industry Volume (kilotons) Forecast, by Application 2019 & 2032
  21. Table 21: United Kingdom Liquid Hydrogen Industry Revenue (Million) Forecast, by Application 2019 & 2032
  22. Table 22: United Kingdom Liquid Hydrogen Industry Volume (kilotons) Forecast, by Application 2019 & 2032
  23. Table 23: France Liquid Hydrogen Industry Revenue (Million) Forecast, by Application 2019 & 2032
  24. Table 24: France Liquid Hydrogen Industry Volume (kilotons) Forecast, by Application 2019 & 2032
  25. Table 25: Spain Liquid Hydrogen Industry Revenue (Million) Forecast, by Application 2019 & 2032
  26. Table 26: Spain Liquid Hydrogen Industry Volume (kilotons) Forecast, by Application 2019 & 2032
  27. Table 27: Italy Liquid Hydrogen Industry Revenue (Million) Forecast, by Application 2019 & 2032
  28. Table 28: Italy Liquid Hydrogen Industry Volume (kilotons) Forecast, by Application 2019 & 2032
  29. Table 29: Spain Liquid Hydrogen Industry Revenue (Million) Forecast, by Application 2019 & 2032
  30. Table 30: Spain Liquid Hydrogen Industry Volume (kilotons) Forecast, by Application 2019 & 2032
  31. Table 31: Belgium Liquid Hydrogen Industry Revenue (Million) Forecast, by Application 2019 & 2032
  32. Table 32: Belgium Liquid Hydrogen Industry Volume (kilotons) Forecast, by Application 2019 & 2032
  33. Table 33: Netherland Liquid Hydrogen Industry Revenue (Million) Forecast, by Application 2019 & 2032
  34. Table 34: Netherland Liquid Hydrogen Industry Volume (kilotons) Forecast, by Application 2019 & 2032
  35. Table 35: Nordics Liquid Hydrogen Industry Revenue (Million) Forecast, by Application 2019 & 2032
  36. Table 36: Nordics Liquid Hydrogen Industry Volume (kilotons) Forecast, by Application 2019 & 2032
  37. Table 37: Rest of Europe Liquid Hydrogen Industry Revenue (Million) Forecast, by Application 2019 & 2032
  38. Table 38: Rest of Europe Liquid Hydrogen Industry Volume (kilotons) Forecast, by Application 2019 & 2032
  39. Table 39: Global Liquid Hydrogen Industry Revenue Million Forecast, by Country 2019 & 2032
  40. Table 40: Global Liquid Hydrogen Industry Volume kilotons Forecast, by Country 2019 & 2032
  41. Table 41: China Liquid Hydrogen Industry Revenue (Million) Forecast, by Application 2019 & 2032
  42. Table 42: China Liquid Hydrogen Industry Volume (kilotons) Forecast, by Application 2019 & 2032
  43. Table 43: Japan Liquid Hydrogen Industry Revenue (Million) Forecast, by Application 2019 & 2032
  44. Table 44: Japan Liquid Hydrogen Industry Volume (kilotons) Forecast, by Application 2019 & 2032
  45. Table 45: India Liquid Hydrogen Industry Revenue (Million) Forecast, by Application 2019 & 2032
  46. Table 46: India Liquid Hydrogen Industry Volume (kilotons) Forecast, by Application 2019 & 2032
  47. Table 47: South Korea Liquid Hydrogen Industry Revenue (Million) Forecast, by Application 2019 & 2032
  48. Table 48: South Korea Liquid Hydrogen Industry Volume (kilotons) Forecast, by Application 2019 & 2032
  49. Table 49: Southeast Asia Liquid Hydrogen Industry Revenue (Million) Forecast, by Application 2019 & 2032
  50. Table 50: Southeast Asia Liquid Hydrogen Industry Volume (kilotons) Forecast, by Application 2019 & 2032
  51. Table 51: Australia Liquid Hydrogen Industry Revenue (Million) Forecast, by Application 2019 & 2032
  52. Table 52: Australia Liquid Hydrogen Industry Volume (kilotons) Forecast, by Application 2019 & 2032
  53. Table 53: Indonesia Liquid Hydrogen Industry Revenue (Million) Forecast, by Application 2019 & 2032
  54. Table 54: Indonesia Liquid Hydrogen Industry Volume (kilotons) Forecast, by Application 2019 & 2032
  55. Table 55: Phillipes Liquid Hydrogen Industry Revenue (Million) Forecast, by Application 2019 & 2032
  56. Table 56: Phillipes Liquid Hydrogen Industry Volume (kilotons) Forecast, by Application 2019 & 2032
  57. Table 57: Singapore Liquid Hydrogen Industry Revenue (Million) Forecast, by Application 2019 & 2032
  58. Table 58: Singapore Liquid Hydrogen Industry Volume (kilotons) Forecast, by Application 2019 & 2032
  59. Table 59: Thailandc Liquid Hydrogen Industry Revenue (Million) Forecast, by Application 2019 & 2032
  60. Table 60: Thailandc Liquid Hydrogen Industry Volume (kilotons) Forecast, by Application 2019 & 2032
  61. Table 61: Rest of Asia Pacific Liquid Hydrogen Industry Revenue (Million) Forecast, by Application 2019 & 2032
  62. Table 62: Rest of Asia Pacific Liquid Hydrogen Industry Volume (kilotons) Forecast, by Application 2019 & 2032
  63. Table 63: Global Liquid Hydrogen Industry Revenue Million Forecast, by Country 2019 & 2032
  64. Table 64: Global Liquid Hydrogen Industry Volume kilotons Forecast, by Country 2019 & 2032
  65. Table 65: Brazil Liquid Hydrogen Industry Revenue (Million) Forecast, by Application 2019 & 2032
  66. Table 66: Brazil Liquid Hydrogen Industry Volume (kilotons) Forecast, by Application 2019 & 2032
  67. Table 67: Argentina Liquid Hydrogen Industry Revenue (Million) Forecast, by Application 2019 & 2032
  68. Table 68: Argentina Liquid Hydrogen Industry Volume (kilotons) Forecast, by Application 2019 & 2032
  69. Table 69: Peru Liquid Hydrogen Industry Revenue (Million) Forecast, by Application 2019 & 2032
  70. Table 70: Peru Liquid Hydrogen Industry Volume (kilotons) Forecast, by Application 2019 & 2032
  71. Table 71: Chile Liquid Hydrogen Industry Revenue (Million) Forecast, by Application 2019 & 2032
  72. Table 72: Chile Liquid Hydrogen Industry Volume (kilotons) Forecast, by Application 2019 & 2032
  73. Table 73: Colombia Liquid Hydrogen Industry Revenue (Million) Forecast, by Application 2019 & 2032
  74. Table 74: Colombia Liquid Hydrogen Industry Volume (kilotons) Forecast, by Application 2019 & 2032
  75. Table 75: Ecuador Liquid Hydrogen Industry Revenue (Million) Forecast, by Application 2019 & 2032
  76. Table 76: Ecuador Liquid Hydrogen Industry Volume (kilotons) Forecast, by Application 2019 & 2032
  77. Table 77: Venezuela Liquid Hydrogen Industry Revenue (Million) Forecast, by Application 2019 & 2032
  78. Table 78: Venezuela Liquid Hydrogen Industry Volume (kilotons) Forecast, by Application 2019 & 2032
  79. Table 79: Rest of South America Liquid Hydrogen Industry Revenue (Million) Forecast, by Application 2019 & 2032
  80. Table 80: Rest of South America Liquid Hydrogen Industry Volume (kilotons) Forecast, by Application 2019 & 2032
  81. Table 81: Global Liquid Hydrogen Industry Revenue Million Forecast, by Country 2019 & 2032
  82. Table 82: Global Liquid Hydrogen Industry Volume kilotons Forecast, by Country 2019 & 2032
  83. Table 83: United States Liquid Hydrogen Industry Revenue (Million) Forecast, by Application 2019 & 2032
  84. Table 84: United States Liquid Hydrogen Industry Volume (kilotons) Forecast, by Application 2019 & 2032
  85. Table 85: Canada Liquid Hydrogen Industry Revenue (Million) Forecast, by Application 2019 & 2032
  86. Table 86: Canada Liquid Hydrogen Industry Volume (kilotons) Forecast, by Application 2019 & 2032
  87. Table 87: Mexico Liquid Hydrogen Industry Revenue (Million) Forecast, by Application 2019 & 2032
  88. Table 88: Mexico Liquid Hydrogen Industry Volume (kilotons) Forecast, by Application 2019 & 2032
  89. Table 89: Global Liquid Hydrogen Industry Revenue Million Forecast, by Country 2019 & 2032
  90. Table 90: Global Liquid Hydrogen Industry Volume kilotons Forecast, by Country 2019 & 2032
  91. Table 91: United Arab Emirates Liquid Hydrogen Industry Revenue (Million) Forecast, by Application 2019 & 2032
  92. Table 92: United Arab Emirates Liquid Hydrogen Industry Volume (kilotons) Forecast, by Application 2019 & 2032
  93. Table 93: Saudi Arabia Liquid Hydrogen Industry Revenue (Million) Forecast, by Application 2019 & 2032
  94. Table 94: Saudi Arabia Liquid Hydrogen Industry Volume (kilotons) Forecast, by Application 2019 & 2032
  95. Table 95: South Africa Liquid Hydrogen Industry Revenue (Million) Forecast, by Application 2019 & 2032
  96. Table 96: South Africa Liquid Hydrogen Industry Volume (kilotons) Forecast, by Application 2019 & 2032
  97. Table 97: Rest of Middle East and Africa Liquid Hydrogen Industry Revenue (Million) Forecast, by Application 2019 & 2032
  98. Table 98: Rest of Middle East and Africa Liquid Hydrogen Industry Volume (kilotons) Forecast, by Application 2019 & 2032
  99. Table 99: Global Liquid Hydrogen Industry Revenue Million Forecast, by Distribution 2019 & 2032
  100. Table 100: Global Liquid Hydrogen Industry Volume kilotons Forecast, by Distribution 2019 & 2032
  101. Table 101: Global Liquid Hydrogen Industry Revenue Million Forecast, by End-user Industry 2019 & 2032
  102. Table 102: Global Liquid Hydrogen Industry Volume kilotons Forecast, by End-user Industry 2019 & 2032
  103. Table 103: Global Liquid Hydrogen Industry Revenue Million Forecast, by Country 2019 & 2032
  104. Table 104: Global Liquid Hydrogen Industry Volume kilotons Forecast, by Country 2019 & 2032
  105. Table 105: China Liquid Hydrogen Industry Revenue (Million) Forecast, by Application 2019 & 2032
  106. Table 106: China Liquid Hydrogen Industry Volume (kilotons) Forecast, by Application 2019 & 2032
  107. Table 107: India Liquid Hydrogen Industry Revenue (Million) Forecast, by Application 2019 & 2032
  108. Table 108: India Liquid Hydrogen Industry Volume (kilotons) Forecast, by Application 2019 & 2032
  109. Table 109: Japan Liquid Hydrogen Industry Revenue (Million) Forecast, by Application 2019 & 2032
  110. Table 110: Japan Liquid Hydrogen Industry Volume (kilotons) Forecast, by Application 2019 & 2032
  111. Table 111: South Korea Liquid Hydrogen Industry Revenue (Million) Forecast, by Application 2019 & 2032
  112. Table 112: South Korea Liquid Hydrogen Industry Volume (kilotons) Forecast, by Application 2019 & 2032
  113. Table 113: Rest of Asia Pacific Liquid Hydrogen Industry Revenue (Million) Forecast, by Application 2019 & 2032
  114. Table 114: Rest of Asia Pacific Liquid Hydrogen Industry Volume (kilotons) Forecast, by Application 2019 & 2032
  115. Table 115: Global Liquid Hydrogen Industry Revenue Million Forecast, by Distribution 2019 & 2032
  116. Table 116: Global Liquid Hydrogen Industry Volume kilotons Forecast, by Distribution 2019 & 2032
  117. Table 117: Global Liquid Hydrogen Industry Revenue Million Forecast, by End-user Industry 2019 & 2032
  118. Table 118: Global Liquid Hydrogen Industry Volume kilotons Forecast, by End-user Industry 2019 & 2032
  119. Table 119: Global Liquid Hydrogen Industry Revenue Million Forecast, by Country 2019 & 2032
  120. Table 120: Global Liquid Hydrogen Industry Volume kilotons Forecast, by Country 2019 & 2032
  121. Table 121: United States Liquid Hydrogen Industry Revenue (Million) Forecast, by Application 2019 & 2032
  122. Table 122: United States Liquid Hydrogen Industry Volume (kilotons) Forecast, by Application 2019 & 2032
  123. Table 123: Canada Liquid Hydrogen Industry Revenue (Million) Forecast, by Application 2019 & 2032
  124. Table 124: Canada Liquid Hydrogen Industry Volume (kilotons) Forecast, by Application 2019 & 2032
  125. Table 125: Mexico Liquid Hydrogen Industry Revenue (Million) Forecast, by Application 2019 & 2032
  126. Table 126: Mexico Liquid Hydrogen Industry Volume (kilotons) Forecast, by Application 2019 & 2032
  127. Table 127: Global Liquid Hydrogen Industry Revenue Million Forecast, by Distribution 2019 & 2032
  128. Table 128: Global Liquid Hydrogen Industry Volume kilotons Forecast, by Distribution 2019 & 2032
  129. Table 129: Global Liquid Hydrogen Industry Revenue Million Forecast, by End-user Industry 2019 & 2032
  130. Table 130: Global Liquid Hydrogen Industry Volume kilotons Forecast, by End-user Industry 2019 & 2032
  131. Table 131: Global Liquid Hydrogen Industry Revenue Million Forecast, by Country 2019 & 2032
  132. Table 132: Global Liquid Hydrogen Industry Volume kilotons Forecast, by Country 2019 & 2032
  133. Table 133: Germany Liquid Hydrogen Industry Revenue (Million) Forecast, by Application 2019 & 2032
  134. Table 134: Germany Liquid Hydrogen Industry Volume (kilotons) Forecast, by Application 2019 & 2032
  135. Table 135: United Kingdom Liquid Hydrogen Industry Revenue (Million) Forecast, by Application 2019 & 2032
  136. Table 136: United Kingdom Liquid Hydrogen Industry Volume (kilotons) Forecast, by Application 2019 & 2032
  137. Table 137: Italy Liquid Hydrogen Industry Revenue (Million) Forecast, by Application 2019 & 2032
  138. Table 138: Italy Liquid Hydrogen Industry Volume (kilotons) Forecast, by Application 2019 & 2032
  139. Table 139: France Liquid Hydrogen Industry Revenue (Million) Forecast, by Application 2019 & 2032
  140. Table 140: France Liquid Hydrogen Industry Volume (kilotons) Forecast, by Application 2019 & 2032
  141. Table 141: Rest of Europe Liquid Hydrogen Industry Revenue (Million) Forecast, by Application 2019 & 2032
  142. Table 142: Rest of Europe Liquid Hydrogen Industry Volume (kilotons) Forecast, by Application 2019 & 2032
  143. Table 143: Global Liquid Hydrogen Industry Revenue Million Forecast, by Distribution 2019 & 2032
  144. Table 144: Global Liquid Hydrogen Industry Volume kilotons Forecast, by Distribution 2019 & 2032
  145. Table 145: Global Liquid Hydrogen Industry Revenue Million Forecast, by End-user Industry 2019 & 2032
  146. Table 146: Global Liquid Hydrogen Industry Volume kilotons Forecast, by End-user Industry 2019 & 2032
  147. Table 147: Global Liquid Hydrogen Industry Revenue Million Forecast, by Country 2019 & 2032
  148. Table 148: Global Liquid Hydrogen Industry Volume kilotons Forecast, by Country 2019 & 2032
  149. Table 149: South America Liquid Hydrogen Industry Revenue (Million) Forecast, by Application 2019 & 2032
  150. Table 150: South America Liquid Hydrogen Industry Volume (kilotons) Forecast, by Application 2019 & 2032
  151. Table 151: Middle East and Africa Liquid Hydrogen Industry Revenue (Million) Forecast, by Application 2019 & 2032
  152. Table 152: Middle East and Africa Liquid Hydrogen Industry Volume (kilotons) Forecast, by Application 2019 & 2032


Frequently Asked Questions

1. What is the projected Compound Annual Growth Rate (CAGR) of the Liquid Hydrogen Industry?

The projected CAGR is approximately 10.27%.

2. Which companies are prominent players in the Liquid Hydrogen Industry?

Key companies in the market include Linde PLC, Air Products and Chemicals Inc, Universal Industrial Gases Inc *List Not Exhaustive, Messer Group GMBH, Iwatani Corporation, Air Liquide, Nippon Sanso Holdings Corporation, Nippon Sanso Holdings Corporation , Praxair Technology Inc. , ITM Power.

3. What are the main segments of the Liquid Hydrogen Industry?

The market segments include Distribution, End-user Industry.

4. Can you provide details about the market size?

The market size is estimated to be USD 38400 Million as of 2022.

5. What are some drivers contributing to market growth?

Growing Demand for Liquid Hydrogen for Space Exploration; Increasing Adoption of Hydrogen Fuel Cell in Commercial Vehicle.

6. What are the notable trends driving market growth?

Aerospace Industry to Dominate the Market.

7. Are there any restraints impacting market growth?

High Cost Associated with Handling and Storage; Other Restraints.

8. Can you provide examples of recent developments in the market?

Mar 2023: Iwatani Corporation and ENEOS Corporation were working to deliver a "Liquefied Hydrogen Supply Chain Commercialization Demonstration Project. The project aims to develop marine transportation technologies of liquefied clean hydrogen, which will help to achieve a hydrogen supply cost of 30 JPY/Nm3 by 2030.

9. What pricing options are available for accessing the report?

Pricing options include single-user, multi-user, and enterprise licenses priced at USD 4750, USD 5250, and USD 8750 respectively.

10. Is the market size provided in terms of value or volume?

The market size is provided in terms of value, measured in Million and volume, measured in kilotons.

11. Are there any specific market keywords associated with the report?

Yes, the market keyword associated with the report is "Liquid Hydrogen Industry," which aids in identifying and referencing the specific market segment covered.

12. How do I determine which pricing option suits my needs best?

The pricing options vary based on user requirements and access needs. Individual users may opt for single-user licenses, while businesses requiring broader access may choose multi-user or enterprise licenses for cost-effective access to the report.

13. Are there any additional resources or data provided in the Liquid Hydrogen Industry report?

While the report offers comprehensive insights, it's advisable to review the specific contents or supplementary materials provided to ascertain if additional resources or data are available.

14. How can I stay updated on further developments or reports in the Liquid Hydrogen Industry?

To stay informed about further developments, trends, and reports in the Liquid Hydrogen Industry, consider subscribing to industry newsletters, following relevant companies and organizations, or regularly checking reputable industry news sources and publications.


Methodology

Step 1 - Identification of Relevant Samples Size from Population Database

Step Chart
Bar Chart
Method Chart

Step 2 - Approaches for Defining Global Market Size (Value, Volume* & Price*)

Approach Chart
Top-down and bottom-up approaches are used to validate the global market size and estimate the market size for manufactures, regional segments, product, and application.

Note*: In applicable scenarios

Step 3 - Data Sources

Primary Research

  • Web Analytics
  • Survey Reports
  • Research Institute
  • Latest Research Reports
  • Opinion Leaders

Secondary Research

  • Annual Reports
  • White Paper
  • Latest Press Release
  • Industry Association
  • Paid Database
  • Investor Presentations
Analyst Chart

Step 4 - Data Triangulation

Involves using different sources of information in order to increase the validity of a study

These sources are likely to be stakeholders in a program - participants, other researchers, program staff, other community members, and so on.

Then we put all data in single framework & apply various statistical tools to find out the dynamic on the market.

During the analysis stage, feedback from the stakeholder groups would be compared to determine areas of agreement as well as areas of divergence

Additionally, after gathering mixed and scattered data from a wide range of sources, data is triangulated and correlated to come up with estimated figures which are further validated through primary mediums or industry experts, opinion leaders.

About Report Pinnacle

Report Pinnacle provides top-tier market research, industry intelligence, and actionable insights for finance, technology, healthcare, and consumer sectors. Our reports empower you to make informed decisions and achieve business success.

Our expert team combines primary research, data analytics, and industry knowledge to deliver insights you can trust. We offer syndicated reports, custom research, and consulting services tailored to your unique business needs.

At Report Pinnacle, we are committed to quality, transparency, and client satisfaction. Every report is rigorously validated to ensure accuracy and relevance. Our global perspective and local expertise help you understand both broad trends and detailed market shifts.

Stay ahead with Report Pinnacle. Subscribe to our newsletter for the latest insights and research highlights, and follow us on social media for real-time updates.

Report Pinnacle – Your Partner for Reaching the Top in Market Intelligence.

Business Address

Head Office

Ansec House 3 rd floor Tank Road, Yerwada, Pune, Maharashtra 411014

Contact Information

Craig Francis

Business Development Head

+17162654855

[email protected]

Secure Payment Partners

payment image
RetailPackagingLogisticsHealthcareAutomotiveAgricultureEnergy & PowerFood & BeverageAerospace & DefenseChemicals & MaterialsHospitality and TourismConsumer Goods and ServicesAnimal Nutrition & WellnessReal Estate and ConstructionTechnology, Media and TelecomHome and Property ImprovementManufacturing Products and ServicesFinancial Services and Investment Intelligence

© 2025 PRDUA Research & Media Private Limited, All rights reserved

Privacy Policy
Terms and Conditions
FAQ
artwork spiralartwork spiralRelated Reports
artwork underline

Emerging Trends in Colombia Lubricants Market: A Technology Perspective 2025-2033

Explore the dynamic Colombian lubricants market, projected to grow over 4.50% CAGR to exceed $1.2 billion by 2025. Discover key drivers like automotive and heavy equipment, and emerging trends in synthetic and eco-friendly lubricants.

December 2025
Base Year: 2024
No Of Pages: 197
Price: $3800

China Automotive Engine Oils Market’s Role in Shaping Industry Trends 2025-2033

The size of the China Automotive Engine Oils Market market was valued at USD XX Million in 2024 and is projected to reach USD XXX Million by 2033, with an expected CAGR of 4.76% during the forecast period.

December 2025
Base Year: 2024
No Of Pages: 197
Price: $3800

Consumer-Centric Trends in Nickel Industry Industry

Explore the dynamic Nickel Industry market forecast from 2019-2033, highlighting CAGR > 4.80%. Discover key drivers like stainless steel and EV batteries, industry trends, and market restraints. Get insights into market segments and leading companies.

December 2025
Base Year: 2024
No Of Pages: 234
Price: $4750

Aramid Prepreg Market Market Expansion Strategies

Explore the dynamic Aramid Prepreg Market with insights into growth drivers, trends, and key segments like Aerospace and Automotive. Discover market size, CAGR, and regional dynamics shaping the future of advanced composites.

December 2025
Base Year: 2024
No Of Pages: 234
Price: $4750

United Kingdom Sealants Market 2025-2033 Overview: Trends, Competitor Dynamics, and Opportunities

Explore the booming United Kingdom sealants market analysis, uncovering key drivers, trends, and CAGR > 5.30%. Get insights into Acrylic, Epoxy, Polyurethane, and Silicone sealants for Aerospace, Automotive, Construction, and Healthcare.

December 2025
Base Year: 2024
No Of Pages: 197
Price: $3800

Iron Recycling Market 2025-2033: Preparing for Growth and Change

Explore the booming Iron Recycling Market, driven by sustainability and circular economy trends. Discover market size, CAGR > 7.00%, key drivers, restraints, and regional growth in building, automotive, and packaging industries.

December 2025
Base Year: 2024
No Of Pages: 180
Price: $4750

Pentaerythritol Industry Market Disruption and Future Trends

Explore the booming Pentaerythritol market with our in-depth analysis, covering market size, CAGR > 5%, key drivers like paints & coatings, and emerging trends from 2019-2033.

December 2025
Base Year: 2024
No Of Pages: 234
Price: $4750

Russian Engine Oil Market Analysis Report 2025: Market to Grow by a CAGR of XX to 2033, Driven by Government Incentives, Popularity of Virtual Assistants, and Strategic Partnerships

Explore the Russian Engine Oil Market analysis, including size, CAGR of 0.67%, key drivers like vehicle fleet age, and restraints from EVs. Discover leading companies and trends for 2025-2033.

December 2025
Base Year: 2024
No Of Pages: 197
Price: $3800

Saudi Arabia Architectural Paints Market in North America: Market Dynamics and Forecasts 2025-2033

The size of the Saudi Arabia Architectural Paints Market market was valued at USD 0.86 Million in 2024 and is projected to reach USD XXX Million by 2033, with an expected CAGR of 3.00">> 3.00% during the forecast period.

December 2025
Base Year: 2024
No Of Pages: 197
Price: $3800

Comprehensive Insights into Middle-East and Africa Pressure Sensitive Adhesives (PSA) Market: Trends and Growth Projections 2025-2033

Explore the thriving Middle-East and Africa Pressure Sensitive Adhesives (PSA) market. Discover key drivers, emerging trends, and growth opportunities in packaging, medical, and transportation sectors. CAGR > 4.00%.

December 2025
Base Year: 2024
No Of Pages: 234
Price: $4750

Growth Strategies in Thermally Conductive Grease Market Market: 2025-2033 Outlook

Explore the dynamic Thermally Conductive Grease Market, driven by electronics, automotive, and power sectors. Discover growth trends, key drivers, and regional insights for optimal thermal management solutions from 2025-2033.

December 2025
Base Year: 2024
No Of Pages: 234
Price: $4750

Fermentation Chemicals Industry Navigating Dynamics Comprehensive Analysis and Forecasts 2025-2033

Explore the dynamic Fermentation Chemicals Market, driven by sustainability trends and growing demand in food, pharma, and industrial sectors. Get insights into market size, CAGR, key players, and regional growth from 2019-2033.

December 2025
Base Year: 2024
No Of Pages: 150
Price: $4750

Exploring Opportunities in United States Betaine Market Sector

The size of the United States Betaine Market market was valued at USD XX Million in 2024 and is projected to reach USD XXX Million by 2033, with an expected CAGR of 4.00">> 4.00% during the forecast period.

December 2025
Base Year: 2024
No Of Pages: 120
Price: $3800

Exploring North America Ceramic Coatings Market’s Market Size Dynamics 2025-2033

Explore the robust growth and key drivers of the North America Ceramic Coatings Market, with a CAGR over 6.00%, driven by Aerospace, Transportation, Healthcare, and Energy. Discover market trends, restraints, and leading companies shaping the future of advanced surface solutions.

December 2025
Base Year: 2024
No Of Pages: 150
Price: $4750

Strategic Projections for MEA Waterborne Adhesives Industry Market Expansion

Explore the booming MEA Waterborne Adhesives Market! Discover key drivers, trends like sustainability and construction growth, and segment insights for Acrylics, PVA, EVA emulsions. Projected to exceed $1.5 billion.

December 2025
Base Year: 2024
No Of Pages: 234
Price: $4750

Acetic Anhydride Industry Market Valuation to Hit XXX Million by 2033

Explore the thriving Acetic Anhydride market, driven by demand in coatings, pharmaceuticals, and plastics. Discover market size, CAGR, key trends, restraints, and leading companies shaping the future of this essential chemical.

November 2025
Base Year: 2024
No Of Pages: 234
Price: $4750

Chromium Phosphate Market Market Analysis and Growth Roadmap

Explore the growing global Chromium Phosphate market, projected to reach $520 million by 2025 with a steady 5.8% CAGR through 2033. Discover key drivers, applications in corrosion inhibitors, pigments, and ceramics, and regional market insights.

November 2025
Base Year: 2024
No Of Pages: 180
Price: $4750

Europe Single-ply Membrane Market Market Dynamics: Drivers and Barriers to Growth 2025-2033

The size of the Europe Single-ply Membrane Market market was valued at USD XX Million in 2024 and is projected to reach USD XXX Million by 2033, with an expected CAGR of 5.00">> 5.00% during the forecast period.

November 2025
Base Year: 2024
No Of Pages: 234
Price: $4750

Composite Bearings Market Market Overview: Growth and Insights

Explore the dynamic Composite Bearings Market, driven by lightweighting and high-performance demands in automotive, aerospace, and construction. Discover market size, CAGR, key drivers, trends, and regional insights for 2025-2033.

November 2025
Base Year: 2024
No Of Pages: 180
Price: $4750

Middle-East and Africa Thermoplastics Market Analysis 2025 and Forecasts 2033: Unveiling Growth Opportunities

Explore the dynamic Middle-East and Africa thermoplastics market forecast to 2033. Discover key growth drivers, market size trends, and regional insights for this expanding sector.

November 2025
Base Year: 2024
No Of Pages: 150
Price: $4750

Overcoming Challenges in Medical Plastics Industry Market: Strategic Insights 2025-2033

Explore the booming Medical Plastics market, driven by advanced materials and innovative applications. Get insights into market size, growth trends, key drivers, and regional analysis from 2019-2033.

November 2025
Base Year: 2024
No Of Pages: 234
Price: $4750

Europe Packaging Tapes Market Market Outlook and Strategic Insights

Explore the dynamic Europe Packaging Tapes Market, driven by e-commerce and food & beverage growth. Discover key insights, CAGR trends, and market drivers from 2025-2033.

November 2025
Base Year: 2024
No Of Pages: 234
Price: $4750

Surfactants Market Report 2025: Growth Driven by Government Incentives and Partnerships

Discover the latest trends and growth opportunities in the booming surfactants market. This comprehensive analysis reveals key drivers, restraints, and regional market shares, along with projections to 2033. Explore market segmentation by type and application, and learn about leading companies shaping the future of this vital industry.

September 2025
Base Year: 2024
No Of Pages: 234
Price: $4750

Polyethyleneimine Market Market’s Consumer Preferences: Trends and Analysis 2025-2033

Discover the latest trends and insights into the Polyethyleneimine (PEI) market, projected to reach [estimated 2033 value based on CAGR] by 2033. This comprehensive analysis covers market size, CAGR, regional breakdowns (North America, Europe, Asia-Pacific), key applications (water treatment, adhesives), and leading companies. Learn more about this growing market and its future potential.

September 2025
Base Year: 2024
No Of Pages: 234
Price: $4750

Growth Roadmap for Resorbable Polymers Market Market 2025-2033

The resorbable polymers market is booming, projected to exceed $5 billion by 2033, driven by advancements in drug delivery and orthopedics. Explore key trends, leading companies, and regional growth forecasts in this comprehensive market analysis.

September 2025
Base Year: 2024
No Of Pages: 180
Price: $4750

Engineering Plastic Industry Comprehensive Market Study: Trends and Predictions 2025-2033

Discover the booming engineering plastics market! This comprehensive analysis explores key trends, growth drivers, and restraints impacting the industry, segmented by resin type and end-user. Learn about leading companies and regional market share projections for 2025-2033.

September 2025
Base Year: 2024
No Of Pages: 197
Price: $3800

Seals Industry 2025-2033 Overview: Trends, Competitor Dynamics, and Opportunities

The global seals industry is booming, projected to reach [estimated 2033 market size] by 2033 with a CAGR exceeding 4%. Discover key market trends, regional insights, leading companies (Trelleborg, Freudenberg, SKF), and the impact of automotive, oil & gas, and industrial automation on this dynamic sector.

September 2025
Base Year: 2024
No Of Pages: 150
Price: $4750

High Performance Foam Market Market’s Consumer Preferences: Trends and Analysis 2025-2033

Discover the booming high-performance foam market, projected to reach $XX billion by 2033 with a CAGR exceeding 8%. This in-depth analysis covers market drivers, trends, restraints, segmentation (silicone, polyurethane, etc.), key players (Solvay, 3M, BASF), and regional growth. Explore the future of high-performance foams in construction, transportation, and healthcare.

September 2025
Base Year: 2024
No Of Pages: 150
Price: $4750

Charting Thin Insulation Market Growth: CAGR Projections for 2025-2033

Discover the booming thin insulation market! This comprehensive analysis reveals a CAGR >5%, driven by energy efficiency mandates & advancements in aerogels & plastic foams. Explore market size, segmentation, key players (Dow, BASF, 3M), and regional trends through 2033.

September 2025
Base Year: 2024
No Of Pages: 234
Price: $4750

Proppants Industry Comprehensive Market Study: Trends and Predictions 2025-2033

Discover the booming proppants market analysis for 2025-2033. This in-depth report reveals key trends, CAGR projections, and regional market share for proppants used in hydraulic fracturing, offering valuable insights for investors and industry professionals. Explore the impact of oil prices, technological advancements, and environmental regulations.

September 2025
Base Year: 2024
No Of Pages: 234
Price: $4750

Exploring United States Non-Woven Fabric Market Market Disruption and Innovation

Discover the booming US non-woven fabric market! Explore key drivers, trends, and restraints shaping this $10 Billion+ industry (2025 est.), including insights into spunbond, polyester, and polypropylene segments. Learn about major players and future growth projections through 2033.

September 2025
Base Year: 2024
No Of Pages: 150
Price: $3800

United Arab Emirates Protective Coatings Market Future-proof Strategies: Trends, Competitor Dynamics, and Opportunities 2025-2033

The UAE protective coatings market is booming, projected to surpass $83 million by 2033, driven by infrastructure development and technological advancements. Discover key trends, market segmentation, and leading players in this lucrative sector. Explore growth opportunities in waterborne, epoxy, and polyurethane coatings for oil & gas, construction, and power industries.

September 2025
Base Year: 2024
No Of Pages: 180
Price: $3800

Exploring Growth Patterns in Germany Water Treatment Market Market

Discover the booming German water treatment market! Explore key trends, drivers, and restraints shaping this €[estimated value] industry, projected to grow at a CAGR exceeding 4% until 2033. Learn about leading companies and key segments.

September 2025
Base Year: 2024
No Of Pages: 197
Price: $3800

Specialty Gas Market: Harnessing Emerging Innovations for Growth 2025-2033

The specialty gas market is booming, projected to exceed a 4% CAGR through 2033, driven by electronics, automotive, and healthcare advancements. This comprehensive analysis explores market size, key players (Air Products, Linde, Air Liquide), regional trends, and future growth opportunities in high-purity gases, noble gases, and more.

September 2025
Base Year: 2024
No Of Pages: 180
Price: $4750

GCC Cement Market XX CAGR Growth Analysis 2025-2033

The GCC cement market is booming, with a CAGR exceeding 4.5% through 2033. Driven by massive infrastructure projects and urbanization, this report analyzes market size, segmentation (Portland, blended, residential, commercial), key players (Cemex, Holcim), and regional trends in Saudi Arabia, UAE, Qatar, Oman, Kuwait, and Bahrain. Discover growth opportunities in this dynamic market.

September 2025
Base Year: 2024
No Of Pages: 234
Price: $4750

Car Oil in Spain Market Market Overview: Growth and Insights

Discover the latest insights into the dynamic Spanish car oil market. Explore market size, growth trends (CAGR 2.08%), key players (Castrol, Shell, Repsol), and future projections to 2033. Learn about the impact of consumer behavior, economic factors, and environmental regulations on this competitive sector.

September 2025
Base Year: 2024
No Of Pages: 197
Price: $3800

BTX Industry Decade Long Trends, Analysis and Forecast 2025-2033

The BTX market (Benzene, Toluene, Xylene) is booming, with a CAGR exceeding 4% and projected to reach $XX million by 2033. Driven by rising petrochemical demand and economic growth in Asia-Pacific, this detailed analysis explores market trends, key players (Shell, ExxonMobil, Sinopec), and regional growth forecasts. Discover insights into BTX applications, segment performance, and future market potential.

September 2025
Base Year: 2024
No Of Pages: 234
Price: $4750

Anhydrous AlCl3 Market Innovations Shaping Market Growth 2025-2033

Discover the booming anhydrous aluminum chloride market! Explore key drivers, trends, and restraints impacting this $1.5B+ market, segmented by form (powder, granules, crystals) and application (pharmaceuticals, pesticides, more). Learn about leading companies and regional growth projections through 2033.

September 2025
Base Year: 2024
No Of Pages: 234
Price: $4750

Argentina Passenger Vehicles Lubricants Market Insights: Market Size Analysis to 2033

Discover the latest insights into Argentina's passenger vehicle lubricants market. This comprehensive analysis reveals a steady growth trajectory (CAGR 2.51%), driven by automotive industry expansion and consumer demand. Explore market segmentation, key players, and future growth projections (2025-2033).

September 2025
Base Year: 2024
No Of Pages: 197
Price: $3800

Exploring Barriers in Dry Mix Mortar Market Market: Trends and Analysis 2025-2033

Discover the booming Dry Mix Mortar market! Explore key trends, growth drivers, and competitive landscape analysis from 2019-2033. Learn about regional market share, leading companies (Holcim, Sika, etc.), and the impact of sustainability. Invest in future-proof construction materials.

September 2025
Base Year: 2024
No Of Pages: 180
Price: $3800

Germany Automotive Engine Oil Industry: Disruptive Technologies Driving Market Growth 2025-2033

Discover the latest trends and insights into the booming German automotive engine oil market. Explore market size, growth projections (CAGR 1.29%), key players (Castrol, Chevron, ExxonMobil), and future opportunities within this €1.5 billion industry. Learn about segment performance and the impact of new technologies.

September 2025
Base Year: 2024
No Of Pages: 197
Price: $3800

North America Compressor Oil Market Market Expansion Strategies

The North American compressor oil market is poised for steady growth, driven by industrial expansion and technological advancements. Learn about market size, CAGR, key players, and future trends in this comprehensive analysis. Discover insights into the segmentation by base oil type and end-user industries.

September 2025
Base Year: 2024
No Of Pages: 180
Price: $4750

Water-borne Adhesives Market Market Expansion Strategies

Discover the booming water-borne adhesives market, projected to exceed a 5% CAGR through 2033. This comprehensive analysis explores market size, key drivers (sustainability, innovation), restraints, regional trends (Asia-Pacific leading the charge), and leading companies. Learn about the expanding applications across building & construction, packaging, and more.

September 2025
Base Year: 2024
No Of Pages: 150
Price: $4750

Europe Gypsum Board Market Comprehensive Market Study: Trends and Predictions 2025-2033

Discover the booming European gypsum board market! This in-depth analysis reveals a CAGR exceeding 5%, driven by construction growth and sustainability trends. Explore key players, regional breakdowns, and future forecasts for 2025-2033. Learn about market segments, drivers, and restraints impacting wall board, ceiling board, and pre-decorated board sales.

September 2025
Base Year: 2024
No Of Pages: 234
Price: $4750

Strategic Insights for SCC Market Market Growth

Discover the booming Self-Consolidating Concrete (SCC) market! Explore its 5%+ CAGR, key drivers like infrastructure development & precast concrete, and leading players like UltraTech & LafargeHolcim. This in-depth analysis forecasts market trends to 2033, covering regional breakdowns and key applications.

September 2025
Base Year: 2024
No Of Pages: 234
Price: $4750

Future-Ready Strategies for Epoxy Powder Coatings Market Market Growth

Discover the booming epoxy powder coatings market! This comprehensive analysis reveals key trends, drivers, and restraints shaping the industry's growth through 2033, including regional insights and leading companies. Explore market size, CAGR, and segmentation data for protective coatings, automotive, aerospace, and construction applications.

September 2025
Base Year: 2024
No Of Pages: 234
Price: $4750

India Floor Coatings Market Market Predictions and Opportunities 2025-2033

Discover the booming India floor coatings market! This comprehensive analysis reveals a ₹14940 million market in 2025, projecting a CAGR exceeding 7% through 2033. Explore key drivers, trends, and segmentation data including epoxy, polyurethane, and other coatings across residential, commercial, and industrial sectors. Learn about leading players like Asian Paints and Sherwin-Williams.

September 2025
Base Year: 2024
No Of Pages: 180
Price: $3800

Strategic Vision for Middle-East and Africa Thermal Spray Market Industry Trends

The Middle East & Africa thermal spray market is booming, projected to reach \$16.54 billion by 2033, driven by aerospace, automotive, and energy sectors. Discover key trends, restraints, and leading companies shaping this high-growth market.

September 2025
Base Year: 2024
No Of Pages: 180
Price: $4750

Opportunities in Ion Exchange Membrane Market Market 2025-2033

The global ion exchange membrane market is booming, driven by water treatment, renewable energy, and battery technology advancements. Explore market size, CAGR, key players, and regional trends in this comprehensive analysis projecting to 2033. Discover lucrative investment opportunities in this rapidly expanding sector.

September 2025
Base Year: 2024
No Of Pages: 150
Price: $4750

Unlocking the Future of APAC Paints & Coatings Additives Industry: Growth and Trends 2025-2033

Discover the booming APAC paints & coatings additives market! This in-depth analysis reveals a CAGR exceeding 6%, driven by construction, automotive, and sustainability trends. Learn about key players, regional breakdowns (China, India, Japan, etc.), and future growth projections to 2033.

September 2025
Base Year: 2024
No Of Pages: 180
Price: $4750
  • Home
  • About Us
  • Industries
    • Packaging
    • Retail
    • Hospitality and Tourism
    • Agriculture
    • Manufacturing Products and Services
    • Healthcare
    • Logistics
    • Aerospace & Defense
    • Chemicals & Materials
    • Professional and Commercial Services
    • Financial Services and Investment Intelligence
    • Food & Beverage
    • Consumer Goods and Services
    • Animal Nutrition & Wellness
    • Technology, Media and Telecom
    • Real Estate and Construction
    • Automotive
    • Home and Property Improvement
    • Energy & Power
  • Services
  • Contact
Main Logo
  • Home
  • About Us
  • Industries
    • Packaging
    • Retail
    • Hospitality and Tourism
    • Agriculture
    • Manufacturing Products and Services
    • Healthcare
    • Logistics
    • Aerospace & Defense
    • Chemicals & Materials
    • Professional and Commercial Services
    • Financial Services and Investment Intelligence
    • Food & Beverage
    • Consumer Goods and Services
    • Animal Nutrition & Wellness
    • Technology, Media and Telecom
    • Real Estate and Construction
    • Automotive
    • Home and Property Improvement
    • Energy & Power
  • Services
  • Contact
+17162654855
[email protected]

+17162654855

[email protected]