

Key Insights
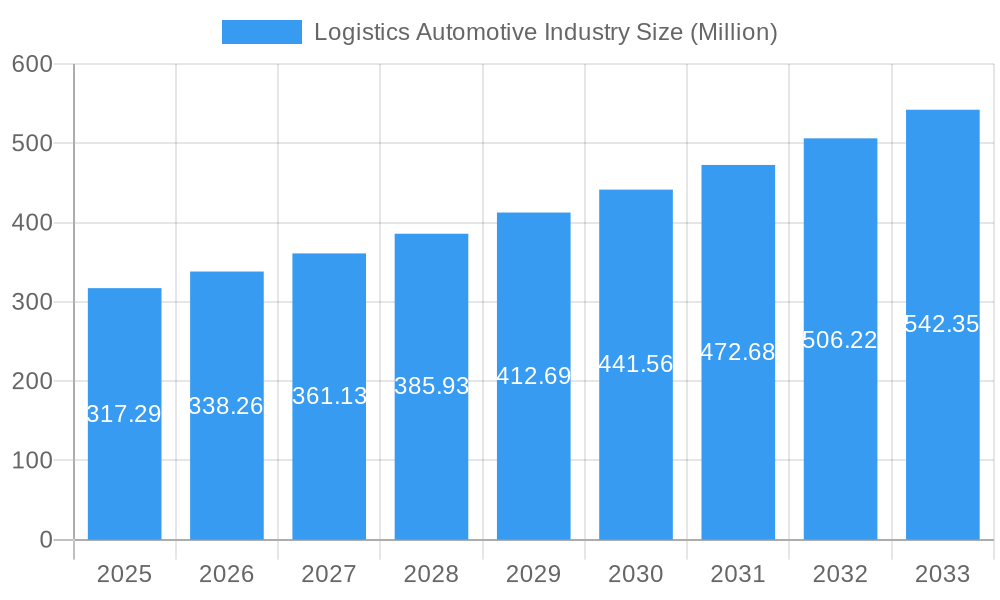
The global automotive logistics market, valued at $317.29 million in 2025, is projected to experience robust growth, driven by the expanding automotive industry, increasing vehicle production, and the growing adoption of just-in-time manufacturing and supply chain optimization strategies. The market's Compound Annual Growth Rate (CAGR) of 6.65% from 2025 to 2033 indicates significant expansion over the forecast period. Key growth drivers include the rising demand for efficient and reliable transportation and warehousing solutions for finished vehicles and auto components. Furthermore, technological advancements, such as the implementation of advanced tracking systems, automation in warehouses, and the utilization of data analytics for improved supply chain visibility, are contributing to market expansion. The market is segmented by service type (transportation, warehousing, other services) and vehicle type (finished vehicles, auto components, other types), with transportation services currently dominating the market share. Growth is further fueled by the increasing focus on sustainable logistics practices, including the use of electric vehicles for transportation and environmentally friendly warehousing facilities. Regional variations exist, with Asia Pacific, particularly China and India, expected to exhibit significant growth due to rapid automotive production increases and infrastructure development. North America and Europe will also continue to contribute significantly, albeit at potentially slower growth rates compared to the Asia-Pacific region. Competitive dynamics within the market are intense, with major players including DB Schenker, DHL, Kuehne + Nagel, and others vying for market share through strategic partnerships, technological innovations, and expansion into new markets.
Logistics Automotive Industry Market Size (In Million)
The automotive logistics market faces certain restraints, though these are generally outweighed by the growth drivers. These limitations include fluctuating fuel prices, geopolitical instability impacting global supply chains, and the potential for labor shortages in key logistics hubs. However, companies are actively mitigating these challenges through diversification of supply chains, investment in technology to enhance efficiency and reduce reliance on human resources, and the exploration of alternative fuel sources. The ongoing trend towards electric vehicles presents both a challenge and an opportunity; while creating new logistics needs for battery components and specialized handling, it also allows for the integration of sustainable practices, enhancing the sector's long-term outlook. The continued growth of the automotive industry globally, coupled with ongoing technological improvements in logistics, strongly suggests a positive trajectory for the automotive logistics market in the coming years. The expansion into emerging markets and the adoption of innovative technologies will be pivotal for sustained market expansion and competitiveness.
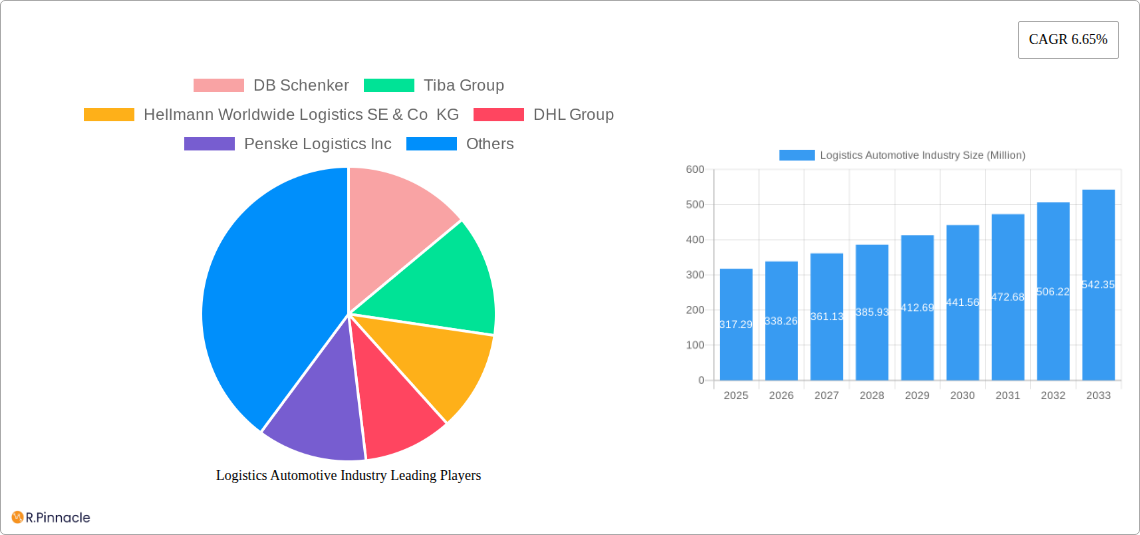
Logistics Automotive Industry Company Market Share
Logistics Automotive Industry: A Comprehensive Market Report (2019-2033)
This in-depth report provides a comprehensive analysis of the Logistics Automotive Industry, offering invaluable insights for industry professionals, investors, and strategic decision-makers. Covering the period 2019-2033, with a base year of 2025, this report unveils the market's structure, dynamics, and future outlook. We analyze key segments, dominant players, and emerging trends, providing actionable data to navigate this rapidly evolving landscape. The report leverages a wealth of data, including M&A deal values exceeding USD xx Million, to provide a robust and insightful view of the market.
Logistics Automotive Industry Market Structure & Innovation Trends
This section analyzes the market concentration, innovation drivers, regulatory landscape, and competitive dynamics within the automotive logistics sector. We explore the market share held by key players such as DB Schenker, Tiba Group, Hellmann Worldwide Logistics, DHL Group, Penske Logistics, Kuehne + Nagel, BLG Logistics, CFR Rinkens, CEVA Logistics, Expeditors, APL Logistics, XPO Logistics, GEFCO, Panalpina, Bolloré Logistics, Kerry Logistics, Ryder System, and DSV Panalpina (list not exhaustive). The analysis includes a detailed examination of mergers and acquisitions (M&A) activities, including deal values totaling USD xx Million within the study period.
- Market Concentration: The automotive logistics market exhibits a moderately concentrated structure, with a few major players commanding significant market share. Further analysis will detail market share distribution.
- Innovation Drivers: Automation, digitalization, and sustainable practices are driving innovation, leading to increased efficiency and reduced environmental impact.
- Regulatory Frameworks: Government regulations concerning emissions, safety, and security significantly influence market dynamics.
- Product Substitutes: The emergence of alternative transportation modes and technological advancements is shaping the competitive landscape.
- End-User Demographics: Analysis of automotive manufacturers, suppliers, and distributors reveals key market segments and their specific logistics needs.
- M&A Activities: The report details significant M&A activities, including deal values, motivations, and their impact on the market.
Logistics Automotive Industry Market Dynamics & Trends
This section explores the key market dynamics and trends impacting the automotive logistics sector. We analyze the Compound Annual Growth Rate (CAGR) and market penetration rates for various segments, considering factors such as technological advancements, evolving consumer preferences, and shifting competitive landscapes. Analysis will also cover the impact of geopolitical events and economic fluctuations on market growth. The market is projected to reach USD xx Million by 2033, with a CAGR of xx% during the forecast period (2025-2033).
Dominant Regions & Segments in Logistics Automotive Industry
This section identifies the leading regions and segments within the automotive logistics industry. We analyze market dominance based on factors such as economic policies, infrastructure development, and industry concentration.
Leading Regions: (Analysis will determine and state the leading region/country here. For example: "North America currently holds the largest market share…")
- Key Drivers:
- Robust automotive manufacturing sector
- Well-developed transportation infrastructure
- Favorable government policies
- High consumer spending
Leading Segments: (Analysis will determine and state the leading service and type here. For Example: "The Finished Vehicle segment dominates…")
- Key Drivers:
- High value of finished vehicles
- Specialized transportation requirements
- Stringent delivery timelines
- Demand for secure and reliable logistics solutions.
Service: Transportation, warehousing, and other services analysis will highlight the dominant service type and its growth drivers.
Type: Finished Vehicle, Auto Components, and Other Types analysis will highlight the dominant type and its growth drivers.
Logistics Automotive Industry Product Innovations
Recent product innovations in automotive logistics focus on technology-driven solutions to enhance efficiency and transparency. This includes advanced tracking systems, automated warehousing, and optimized routing algorithms. These innovations provide significant competitive advantages by reducing costs, improving delivery times, and enhancing supply chain visibility.
Report Scope & Segmentation Analysis
This report segments the automotive logistics market based on service type (Transportation, Warehousing, Other Services) and cargo type (Finished Vehicle, Auto Components, Other Types). Each segment's growth projections, market size (USD xx Million for each segment in 2025), and competitive dynamics are analyzed. For example, the Finished Vehicle segment is projected to experience robust growth driven by increasing vehicle production, while the Auto Components segment will exhibit a different growth pattern based on supply chain dynamics.
Key Drivers of Logistics Automotive Industry Growth
The growth of the automotive logistics industry is propelled by several factors. Technological advancements in automation and digitalization are streamlining processes and reducing costs. Expanding global automotive production and rising consumer demand are driving up transportation and warehousing needs. Finally, supportive government policies and infrastructure investments contribute significantly to the industry's expansion.
Challenges in the Logistics Automotive Industry Sector
The automotive logistics industry faces several challenges. Supply chain disruptions, including material shortages and geopolitical instability, impact delivery times and increase costs. Stringent regulatory requirements for emissions and safety add complexity and expense. Furthermore, intense competition and fluctuating fuel prices create pressure on profit margins. These factors together lead to an estimated loss of USD xx Million annually.
Emerging Opportunities in Logistics Automotive Industry
The automotive logistics sector presents several compelling opportunities. The rise of electric vehicles (EVs) creates demand for specialized logistics solutions. The increasing adoption of automation and artificial intelligence (AI) offers avenues for cost optimization and efficiency gains. Expansion into emerging markets with growing automotive industries provides significant potential for growth.
Leading Players in the Logistics Automotive Industry Market
- DB Schenker
- Tiba Group
- Hellmann Worldwide Logistics
- DHL Group
- Penske Logistics
- Kuehne + Nagel
- BLG Logistics
- CFR Rinkens
- CEVA Logistics
- Expeditors
- APL Logistics
- XPO Logistics
- GEFCO
- Panalpina
- Bolloré Logistics
- Kerry Logistics
- Ryder System
- DSV Panalpina
Key Developments in Logistics Automotive Industry
- December 2022: Delhivery acquires Algorhythm Tech for USD 17.99 Million, expanding its integrated supply chain solutions.
- August 2022: Bolloré Logistics expands its Australian presence by acquiring Lynair Logistics.
Future Outlook for Logistics Automotive Industry Market
The future of the automotive logistics industry is bright, driven by technological advancements, globalization, and increasing demand for efficient and sustainable solutions. Strategic partnerships, investments in innovative technologies, and a focus on sustainability will be key to success in this dynamic market. The industry is projected to experience significant growth, reaching USD xx Million by 2033.
Logistics Automotive Industry Segmentation
-
1. Service
- 1.1. Transportation
- 1.2. Warehous
- 1.3. Other Services
-
2. Type
- 2.1. Finished Vehicle
- 2.2. Auto Components
- 2.3. Other Types
Logistics Automotive Industry Segmentation By Geography
-
1. Asia Pacific
- 1.1. China
- 1.2. Japan
- 1.3. India
- 1.4. South Korea
- 1.5. Rest of Asia Pacific
-
2. North America
- 2.1. United States
- 2.2. Canada
- 2.3. Mexico
-
3. Europe
- 3.1. United Kingdom
- 3.2. Germany
- 3.3. Italy
- 3.4. Russia
- 3.5. France
- 3.6. Rest of Europe
-
4. Latin America
- 4.1. Brazil
- 4.2. Argentina
- 4.3. Rest of Latin America
- 5. Middle East
-
6. South Africa
- 6.1. United Arab Emirates
- 6.2. Saudi Arabia
- 6.3. Rest of Middle East
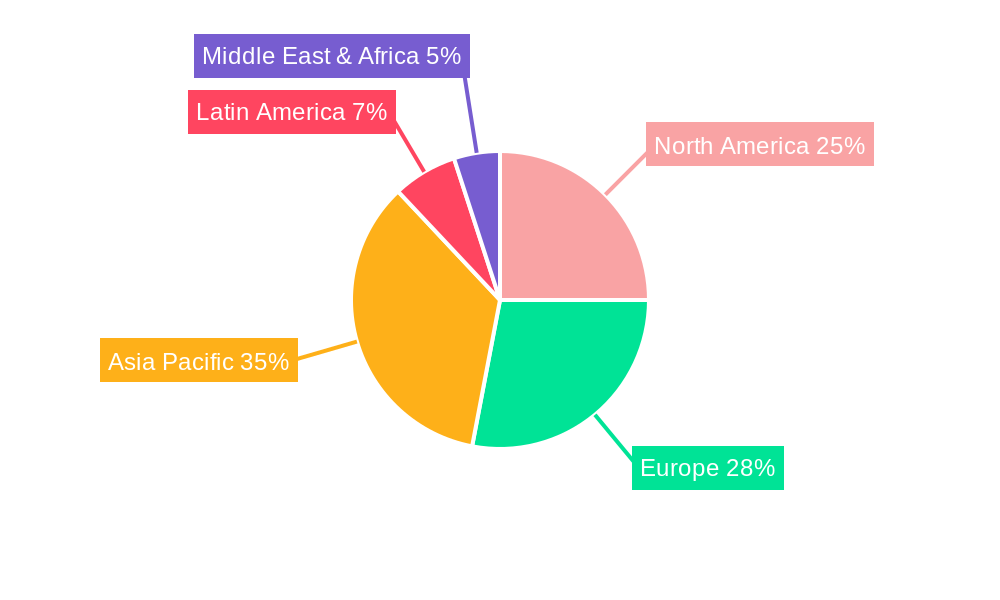
Logistics Automotive Industry Regional Market Share
Geographic Coverage of Logistics Automotive Industry
Logistics Automotive Industry REPORT HIGHLIGHTS
| Aspects | Details |
|---|---|
| Study Period | 2020-2034 |
| Base Year | 2025 |
| Estimated Year | 2026 |
| Forecast Period | 2026-2034 |
| Historical Period | 2020-2025 |
| Growth Rate | CAGR of 6.65% from 2020-2034 |
| Segmentation |
|
Table of Contents
- 1. Introduction
- 1.1. Research Scope
- 1.2. Market Segmentation
- 1.3. Research Objective
- 1.4. Definitions and Assumptions
- 2. Executive Summary
- 2.1. Market Snapshot
- 3. Market Dynamics
- 3.1. Market Drivers
- 3.2. Market Restrains
- 3.3. Market Trends
- 3.4. Market Opportunities
- 4. Market Factor Analysis
- 4.1. Porters Five Forces
- 4.1.1. Bargaining Power of Suppliers
- 4.1.2. Bargaining Power of Buyers
- 4.1.3. Threat of New Entrants
- 4.1.4. Threat of Substitutes
- 4.1.5. Competitive Rivalry
- 4.2. PESTEL analysis
- 4.3. BCG Analysis
- 4.3.1. Stars (High Growth, High Market Share)
- 4.3.2. Cash Cows (Low Growth, High Market Share)
- 4.3.3. Question Mark (High Growth, Low Market Share)
- 4.3.4. Dogs (Low Growth, Low Market Share)
- 4.4. Ansoff Matrix Analysis
- 4.5. Supply Chain Analysis
- 4.6. Regulatory Landscape
- 4.7. Current Market Potential and Opportunity Assessment (TAM–SAM–SOM Framework)
- 4.8. PRI Analyst Note
- 4.1. Porters Five Forces
- 5. Market Analysis, Insights and Forecast 2021-2033
- 5.1. Market Analysis, Insights and Forecast - by Service
- 5.1.1. Transportation
- 5.1.2. Warehous
- 5.1.3. Other Services
- 5.2. Market Analysis, Insights and Forecast - by Type
- 5.2.1. Finished Vehicle
- 5.2.2. Auto Components
- 5.2.3. Other Types
- 5.3. Market Analysis, Insights and Forecast - by Region
- 5.3.1. Asia Pacific
- 5.3.2. North America
- 5.3.3. Europe
- 5.3.4. Latin America
- 5.3.5. Middle East
- 5.3.6. South Africa
- 5.1. Market Analysis, Insights and Forecast - by Service
- 6. Global Logistics Automotive Industry Analysis, Insights and Forecast, 2021-2033
- 6.1. Market Analysis, Insights and Forecast - by Service
- 6.1.1. Transportation
- 6.1.2. Warehous
- 6.1.3. Other Services
- 6.2. Market Analysis, Insights and Forecast - by Type
- 6.2.1. Finished Vehicle
- 6.2.2. Auto Components
- 6.2.3. Other Types
- 6.1. Market Analysis, Insights and Forecast - by Service
- 7. Asia Pacific Logistics Automotive Industry Analysis, Insights and Forecast, 2020-2032
- 7.1. Market Analysis, Insights and Forecast - by Service
- 7.1.1. Transportation
- 7.1.2. Warehous
- 7.1.3. Other Services
- 7.2. Market Analysis, Insights and Forecast - by Type
- 7.2.1. Finished Vehicle
- 7.2.2. Auto Components
- 7.2.3. Other Types
- 7.1. Market Analysis, Insights and Forecast - by Service
- 8. North America Logistics Automotive Industry Analysis, Insights and Forecast, 2020-2032
- 8.1. Market Analysis, Insights and Forecast - by Service
- 8.1.1. Transportation
- 8.1.2. Warehous
- 8.1.3. Other Services
- 8.2. Market Analysis, Insights and Forecast - by Type
- 8.2.1. Finished Vehicle
- 8.2.2. Auto Components
- 8.2.3. Other Types
- 8.1. Market Analysis, Insights and Forecast - by Service
- 9. Europe Logistics Automotive Industry Analysis, Insights and Forecast, 2020-2032
- 9.1. Market Analysis, Insights and Forecast - by Service
- 9.1.1. Transportation
- 9.1.2. Warehous
- 9.1.3. Other Services
- 9.2. Market Analysis, Insights and Forecast - by Type
- 9.2.1. Finished Vehicle
- 9.2.2. Auto Components
- 9.2.3. Other Types
- 9.1. Market Analysis, Insights and Forecast - by Service
- 10. Latin America Logistics Automotive Industry Analysis, Insights and Forecast, 2020-2032
- 10.1. Market Analysis, Insights and Forecast - by Service
- 10.1.1. Transportation
- 10.1.2. Warehous
- 10.1.3. Other Services
- 10.2. Market Analysis, Insights and Forecast - by Type
- 10.2.1. Finished Vehicle
- 10.2.2. Auto Components
- 10.2.3. Other Types
- 10.1. Market Analysis, Insights and Forecast - by Service
- 11. Middle East Logistics Automotive Industry Analysis, Insights and Forecast, 2020-2032
- 11.1. Market Analysis, Insights and Forecast - by Service
- 11.1.1. Transportation
- 11.1.2. Warehous
- 11.1.3. Other Services
- 11.2. Market Analysis, Insights and Forecast - by Type
- 11.2.1. Finished Vehicle
- 11.2.2. Auto Components
- 11.2.3. Other Types
- 11.1. Market Analysis, Insights and Forecast - by Service
- 12. South Africa Logistics Automotive Industry Analysis, Insights and Forecast, 2020-2032
- 12.1. Market Analysis, Insights and Forecast - by Service
- 12.1.1. Transportation
- 12.1.2. Warehous
- 12.1.3. Other Services
- 12.2. Market Analysis, Insights and Forecast - by Type
- 12.2.1. Finished Vehicle
- 12.2.2. Auto Components
- 12.2.3. Other Types
- 12.1. Market Analysis, Insights and Forecast - by Service
- 13. Competitive Analysis
- 13.1. Company Profiles
- 13.1.1 DB Schenker
- 13.1.1.1. Company Overview
- 13.1.1.2. Products
- 13.1.1.3. Company Financials
- 13.1.1.4. SWOT Analysis
- 13.1.2 Tiba Group
- 13.1.2.1. Company Overview
- 13.1.2.2. Products
- 13.1.2.3. Company Financials
- 13.1.2.4. SWOT Analysis
- 13.1.3 Hellmann Worldwide Logistics SE & Co KG
- 13.1.3.1. Company Overview
- 13.1.3.2. Products
- 13.1.3.3. Company Financials
- 13.1.3.4. SWOT Analysis
- 13.1.4 DHL Group
- 13.1.4.1. Company Overview
- 13.1.4.2. Products
- 13.1.4.3. Company Financials
- 13.1.4.4. SWOT Analysis
- 13.1.5 Penske Logistics Inc
- 13.1.5.1. Company Overview
- 13.1.5.2. Products
- 13.1.5.3. Company Financials
- 13.1.5.4. SWOT Analysis
- 13.1.6 Kuehne + Nagel International AG
- 13.1.6.1. Company Overview
- 13.1.6.2. Products
- 13.1.6.3. Company Financials
- 13.1.6.4. SWOT Analysis
- 13.1.7 BLG Logistics Group AG & Co KG
- 13.1.7.1. Company Overview
- 13.1.7.2. Products
- 13.1.7.3. Company Financials
- 13.1.7.4. SWOT Analysis
- 13.1.8 CFR Rinkens**List Not Exhaustive
- 13.1.8.1. Company Overview
- 13.1.8.2. Products
- 13.1.8.3. Company Financials
- 13.1.8.4. SWOT Analysis
- 13.1.9 CEVA Logistics
- 13.1.9.1. Company Overview
- 13.1.9.2. Products
- 13.1.9.3. Company Financials
- 13.1.9.4. SWOT Analysis
- 13.1.10 Expeditors
- 13.1.10.1. Company Overview
- 13.1.10.2. Products
- 13.1.10.3. Company Financials
- 13.1.10.4. SWOT Analysis
- 13.1.11 APL Logistics Ltd
- 13.1.11.1. Company Overview
- 13.1.11.2. Products
- 13.1.11.3. Company Financials
- 13.1.11.4. SWOT Analysis
- 13.1.12 XPO Logistics Inc
- 13.1.12.1. Company Overview
- 13.1.12.2. Products
- 13.1.12.3. Company Financials
- 13.1.12.4. SWOT Analysis
- 13.1.13 GEFCO SA
- 13.1.13.1. Company Overview
- 13.1.13.2. Products
- 13.1.13.3. Company Financials
- 13.1.13.4. SWOT Analysis
- 13.1.14 Panalpina
- 13.1.14.1. Company Overview
- 13.1.14.2. Products
- 13.1.14.3. Company Financials
- 13.1.14.4. SWOT Analysis
- 13.1.15 Bollore Logistics
- 13.1.15.1. Company Overview
- 13.1.15.2. Products
- 13.1.15.3. Company Financials
- 13.1.15.4. SWOT Analysis
- 13.1.16 Kerry Logistics Network Ltd
- 13.1.16.1. Company Overview
- 13.1.16.2. Products
- 13.1.16.3. Company Financials
- 13.1.16.4. SWOT Analysis
- 13.1.17 Ryder System Inc
- 13.1.17.1. Company Overview
- 13.1.17.2. Products
- 13.1.17.3. Company Financials
- 13.1.17.4. SWOT Analysis
- 13.1.18 DSV Panalpina AS
- 13.1.18.1. Company Overview
- 13.1.18.2. Products
- 13.1.18.3. Company Financials
- 13.1.18.4. SWOT Analysis
- 13.1.1 DB Schenker
- 13.2. Market Entropy
- 13.2.1 Company's Key Areas Served
- 13.2.2 Recent Developments
- 13.3. Company Market Share Analysis 2025
- 13.3.1 Top 5 Companies Market Share Analysis
- 13.3.2 Top 3 Companies Market Share Analysis
- 13.4. List of Potential Customers
- 14. Research Methodology
List of Figures
- Figure 1: Global Logistics Automotive Industry Revenue Breakdown (Million, %) by Region 2025 & 2033
- Figure 2: Asia Pacific Logistics Automotive Industry Revenue (Million), by Service 2025 & 2033
- Figure 3: Asia Pacific Logistics Automotive Industry Revenue Share (%), by Service 2025 & 2033
- Figure 4: Asia Pacific Logistics Automotive Industry Revenue (Million), by Type 2025 & 2033
- Figure 5: Asia Pacific Logistics Automotive Industry Revenue Share (%), by Type 2025 & 2033
- Figure 6: Asia Pacific Logistics Automotive Industry Revenue (Million), by Country 2025 & 2033
- Figure 7: Asia Pacific Logistics Automotive Industry Revenue Share (%), by Country 2025 & 2033
- Figure 8: North America Logistics Automotive Industry Revenue (Million), by Service 2025 & 2033
- Figure 9: North America Logistics Automotive Industry Revenue Share (%), by Service 2025 & 2033
- Figure 10: North America Logistics Automotive Industry Revenue (Million), by Type 2025 & 2033
- Figure 11: North America Logistics Automotive Industry Revenue Share (%), by Type 2025 & 2033
- Figure 12: North America Logistics Automotive Industry Revenue (Million), by Country 2025 & 2033
- Figure 13: North America Logistics Automotive Industry Revenue Share (%), by Country 2025 & 2033
- Figure 14: Europe Logistics Automotive Industry Revenue (Million), by Service 2025 & 2033
- Figure 15: Europe Logistics Automotive Industry Revenue Share (%), by Service 2025 & 2033
- Figure 16: Europe Logistics Automotive Industry Revenue (Million), by Type 2025 & 2033
- Figure 17: Europe Logistics Automotive Industry Revenue Share (%), by Type 2025 & 2033
- Figure 18: Europe Logistics Automotive Industry Revenue (Million), by Country 2025 & 2033
- Figure 19: Europe Logistics Automotive Industry Revenue Share (%), by Country 2025 & 2033
- Figure 20: Latin America Logistics Automotive Industry Revenue (Million), by Service 2025 & 2033
- Figure 21: Latin America Logistics Automotive Industry Revenue Share (%), by Service 2025 & 2033
- Figure 22: Latin America Logistics Automotive Industry Revenue (Million), by Type 2025 & 2033
- Figure 23: Latin America Logistics Automotive Industry Revenue Share (%), by Type 2025 & 2033
- Figure 24: Latin America Logistics Automotive Industry Revenue (Million), by Country 2025 & 2033
- Figure 25: Latin America Logistics Automotive Industry Revenue Share (%), by Country 2025 & 2033
- Figure 26: Middle East Logistics Automotive Industry Revenue (Million), by Service 2025 & 2033
- Figure 27: Middle East Logistics Automotive Industry Revenue Share (%), by Service 2025 & 2033
- Figure 28: Middle East Logistics Automotive Industry Revenue (Million), by Type 2025 & 2033
- Figure 29: Middle East Logistics Automotive Industry Revenue Share (%), by Type 2025 & 2033
- Figure 30: Middle East Logistics Automotive Industry Revenue (Million), by Country 2025 & 2033
- Figure 31: Middle East Logistics Automotive Industry Revenue Share (%), by Country 2025 & 2033
- Figure 32: South Africa Logistics Automotive Industry Revenue (Million), by Service 2025 & 2033
- Figure 33: South Africa Logistics Automotive Industry Revenue Share (%), by Service 2025 & 2033
- Figure 34: South Africa Logistics Automotive Industry Revenue (Million), by Type 2025 & 2033
- Figure 35: South Africa Logistics Automotive Industry Revenue Share (%), by Type 2025 & 2033
- Figure 36: South Africa Logistics Automotive Industry Revenue (Million), by Country 2025 & 2033
- Figure 37: South Africa Logistics Automotive Industry Revenue Share (%), by Country 2025 & 2033
List of Tables
- Table 1: Global Logistics Automotive Industry Revenue Million Forecast, by Service 2020 & 2033
- Table 2: Global Logistics Automotive Industry Revenue Million Forecast, by Type 2020 & 2033
- Table 3: Global Logistics Automotive Industry Revenue Million Forecast, by Region 2020 & 2033
- Table 4: Global Logistics Automotive Industry Revenue Million Forecast, by Service 2020 & 2033
- Table 5: Global Logistics Automotive Industry Revenue Million Forecast, by Type 2020 & 2033
- Table 6: Global Logistics Automotive Industry Revenue Million Forecast, by Country 2020 & 2033
- Table 7: China Logistics Automotive Industry Revenue (Million) Forecast, by Application 2020 & 2033
- Table 8: Japan Logistics Automotive Industry Revenue (Million) Forecast, by Application 2020 & 2033
- Table 9: India Logistics Automotive Industry Revenue (Million) Forecast, by Application 2020 & 2033
- Table 10: South Korea Logistics Automotive Industry Revenue (Million) Forecast, by Application 2020 & 2033
- Table 11: Rest of Asia Pacific Logistics Automotive Industry Revenue (Million) Forecast, by Application 2020 & 2033
- Table 12: Global Logistics Automotive Industry Revenue Million Forecast, by Service 2020 & 2033
- Table 13: Global Logistics Automotive Industry Revenue Million Forecast, by Type 2020 & 2033
- Table 14: Global Logistics Automotive Industry Revenue Million Forecast, by Country 2020 & 2033
- Table 15: United States Logistics Automotive Industry Revenue (Million) Forecast, by Application 2020 & 2033
- Table 16: Canada Logistics Automotive Industry Revenue (Million) Forecast, by Application 2020 & 2033
- Table 17: Mexico Logistics Automotive Industry Revenue (Million) Forecast, by Application 2020 & 2033
- Table 18: Global Logistics Automotive Industry Revenue Million Forecast, by Service 2020 & 2033
- Table 19: Global Logistics Automotive Industry Revenue Million Forecast, by Type 2020 & 2033
- Table 20: Global Logistics Automotive Industry Revenue Million Forecast, by Country 2020 & 2033
- Table 21: United Kingdom Logistics Automotive Industry Revenue (Million) Forecast, by Application 2020 & 2033
- Table 22: Germany Logistics Automotive Industry Revenue (Million) Forecast, by Application 2020 & 2033
- Table 23: Italy Logistics Automotive Industry Revenue (Million) Forecast, by Application 2020 & 2033
- Table 24: Russia Logistics Automotive Industry Revenue (Million) Forecast, by Application 2020 & 2033
- Table 25: France Logistics Automotive Industry Revenue (Million) Forecast, by Application 2020 & 2033
- Table 26: Rest of Europe Logistics Automotive Industry Revenue (Million) Forecast, by Application 2020 & 2033
- Table 27: Global Logistics Automotive Industry Revenue Million Forecast, by Service 2020 & 2033
- Table 28: Global Logistics Automotive Industry Revenue Million Forecast, by Type 2020 & 2033
- Table 29: Global Logistics Automotive Industry Revenue Million Forecast, by Country 2020 & 2033
- Table 30: Brazil Logistics Automotive Industry Revenue (Million) Forecast, by Application 2020 & 2033
- Table 31: Argentina Logistics Automotive Industry Revenue (Million) Forecast, by Application 2020 & 2033
- Table 32: Rest of Latin America Logistics Automotive Industry Revenue (Million) Forecast, by Application 2020 & 2033
- Table 33: Global Logistics Automotive Industry Revenue Million Forecast, by Service 2020 & 2033
- Table 34: Global Logistics Automotive Industry Revenue Million Forecast, by Type 2020 & 2033
- Table 35: Global Logistics Automotive Industry Revenue Million Forecast, by Country 2020 & 2033
- Table 36: Global Logistics Automotive Industry Revenue Million Forecast, by Service 2020 & 2033
- Table 37: Global Logistics Automotive Industry Revenue Million Forecast, by Type 2020 & 2033
- Table 38: Global Logistics Automotive Industry Revenue Million Forecast, by Country 2020 & 2033
- Table 39: United Arab Emirates Logistics Automotive Industry Revenue (Million) Forecast, by Application 2020 & 2033
- Table 40: Saudi Arabia Logistics Automotive Industry Revenue (Million) Forecast, by Application 2020 & 2033
- Table 41: Rest of Middle East Logistics Automotive Industry Revenue (Million) Forecast, by Application 2020 & 2033
Frequently Asked Questions
1. What is the projected Compound Annual Growth Rate (CAGR) of the Logistics Automotive Industry?
The projected CAGR is approximately 6.65%.
2. Which companies are prominent players in the Logistics Automotive Industry?
Key companies in the market include DB Schenker, Tiba Group, Hellmann Worldwide Logistics SE & Co KG, DHL Group, Penske Logistics Inc, Kuehne + Nagel International AG, BLG Logistics Group AG & Co KG, CFR Rinkens**List Not Exhaustive, CEVA Logistics, Expeditors, APL Logistics Ltd, XPO Logistics Inc, GEFCO SA, Panalpina, Bollore Logistics, Kerry Logistics Network Ltd, Ryder System Inc, DSV Panalpina AS.
3. What are the main segments of the Logistics Automotive Industry?
The market segments include Service, Type.
4. Can you provide details about the market size?
The market size is estimated to be USD 317.29 Million as of 2022.
5. What are some drivers contributing to market growth?
4.; Rise In Agriculture Sector and Food Industry4.; Rise In Pharmaceutical Industry.
6. What are the notable trends driving market growth?
Positive Outlook for the Automotive Sales and Production Demands Efficient Logistics Services.
7. Are there any restraints impacting market growth?
4.; Cost Constraints4.; Infrastructure Accessibility.
8. Can you provide examples of recent developments in the market?
December 2022: Delhivery, a provider of logistics services, announced the acquisition of Algorhythm Tech Pvt Ltd of Pune for INR 14.9 crores (USD 17.99 Million) in an all-cash purchase to expand its integrated supply chain solutions portfolio. By the end of January 2023, Delhivery anticipates the acquisition to be completed. At this point, Algorhythm Tech will function as a fully-owned subsidiary of the logistics company based in Gurugram.
9. What pricing options are available for accessing the report?
Pricing options include single-user, multi-user, and enterprise licenses priced at USD 4750, USD 5250, and USD 8750 respectively.
10. Is the market size provided in terms of value or volume?
The market size is provided in terms of value, measured in Million.
11. Are there any specific market keywords associated with the report?
Yes, the market keyword associated with the report is "Logistics Automotive Industry," which aids in identifying and referencing the specific market segment covered.
12. How do I determine which pricing option suits my needs best?
The pricing options vary based on user requirements and access needs. Individual users may opt for single-user licenses, while businesses requiring broader access may choose multi-user or enterprise licenses for cost-effective access to the report.
13. Are there any additional resources or data provided in the Logistics Automotive Industry report?
While the report offers comprehensive insights, it's advisable to review the specific contents or supplementary materials provided to ascertain if additional resources or data are available.
14. How can I stay updated on further developments or reports in the Logistics Automotive Industry?
To stay informed about further developments, trends, and reports in the Logistics Automotive Industry, consider subscribing to industry newsletters, following relevant companies and organizations, or regularly checking reputable industry news sources and publications.
Methodology
Step 1 - Identification of Relevant Samples Size from Population Database


Step 2 - Approaches for Defining Global Market Size (Value, Volume* & Price*)

Note*: In applicable scenarios
Step 3 - Data Sources
Primary Research
- Web Analytics
- Survey Reports
- Research Institute
- Latest Research Reports
- Opinion Leaders
Secondary Research
- Annual Reports
- White Paper
- Latest Press Release
- Industry Association
- Paid Database
- Investor Presentations

Step 4 - Data Triangulation
Involves using different sources of information in order to increase the validity of a study
These sources are likely to be stakeholders in a program - participants, other researchers, program staff, other community members, and so on.
Then we put all data in single framework & apply various statistical tools to find out the dynamic on the market.
During the analysis stage, feedback from the stakeholder groups would be compared to determine areas of agreement as well as areas of divergence