Key Insights
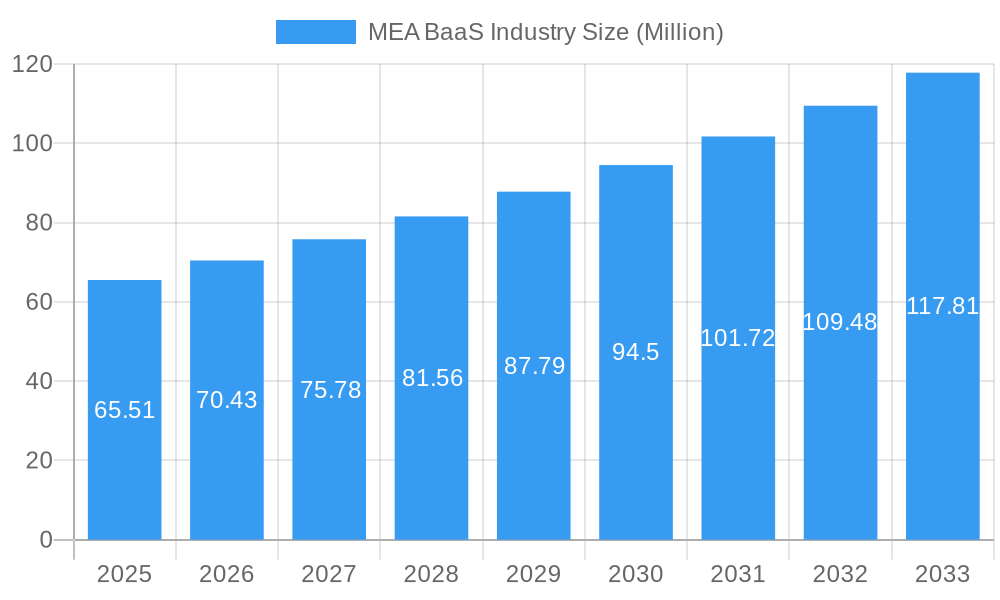
The Middle East and Africa (MEA) Banking-as-a-Service (BaaS) market is experiencing robust growth, projected to reach \$65.51 million in 2025, expanding at a Compound Annual Growth Rate (CAGR) of 7.40% from 2025 to 2033. This surge is driven by several factors. Firstly, the increasing adoption of digital financial services across the region, particularly among the burgeoning youth population and underserved communities, fuels demand for flexible and cost-effective banking solutions. Secondly, the rise of fintech companies and their collaborative partnerships with established banks are accelerating BaaS adoption. Fintechs leverage BaaS to offer innovative financial products and services without the high costs of establishing full-fledged banking infrastructure. Thirdly, regulatory support and initiatives aimed at fostering financial inclusion are creating a conducive environment for BaaS growth. This includes streamlining licensing processes and encouraging the development of open banking frameworks. Finally, the growing need for personalized banking experiences and enhanced customer service is driving the demand for BaaS solutions that offer tailored features and seamless integration with existing platforms.
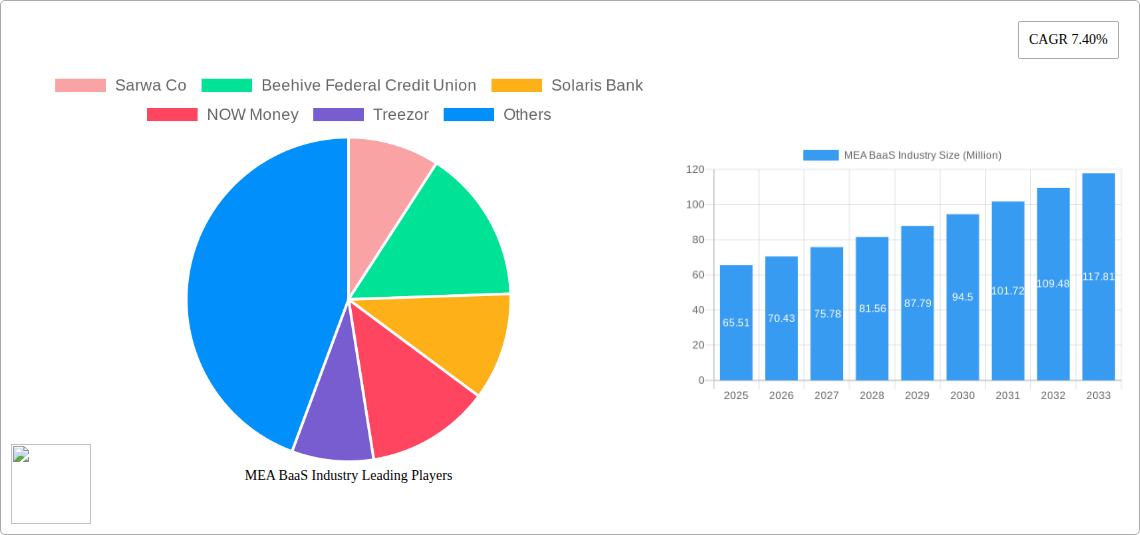
MEA BaaS Industry Market Size (In Million)
However, challenges remain. Data security and privacy concerns surrounding the handling of sensitive customer information pose a significant hurdle. Furthermore, the varying levels of digital literacy and infrastructure across the MEA region can limit adoption rates in certain areas. Competition from traditional banks offering similar services is also a factor. Despite these challenges, the long-term outlook for the MEA BaaS market remains positive. The continued expansion of digital financial services, increasing fintech activity, and supportive regulatory frameworks will drive sustained growth, with key players like Sarwa Co, Beehive Federal Credit Union, Solaris Bank, NOW Money, Treezor, Telr, Mamo Pay, Felix, Jingle Pay, and Al Baraka Bank (among others) vying for market share. The market will witness increased focus on innovation, particularly in areas like embedded finance and AI-powered solutions.
MEA BaaS Industry Company Market Share
MEA BaaS Industry Market Report: 2019-2033
This comprehensive report provides an in-depth analysis of the Middle East and Africa (MEA) Banking-as-a-Service (BaaS) industry, covering market structure, dynamics, key players, and future outlook. With a study period spanning 2019-2033, a base year of 2025, and a forecast period of 2025-2033, this report offers invaluable insights for industry professionals, investors, and strategic decision-makers. The report's findings are based on rigorous research and analysis, providing actionable intelligence for navigating the rapidly evolving MEA BaaS landscape. The total market value is predicted to reach xx Million by 2033.
MEA BaaS Industry Market Structure & Innovation Trends
This section analyzes the MEA BaaS market's competitive landscape, focusing on market concentration, innovation drivers, regulatory frameworks, and M&A activities. The report examines the market share of key players, including but not limited to Sarwa Co, Beehive Federal Credit Union, Solaris Bank, NOW Money, Treezor, Telr, Mamo Pay, Felix, Jingle Pay, and Al Baraka Bank. The analysis includes a detailed examination of M&A deal values and their impact on market consolidation. Specific metrics like market concentration ratios and average deal sizes are presented. The role of regulatory frameworks in shaping innovation and competition is also explored. Finally, the report considers the impact of product substitutes and end-user demographics on market structure.
- Market Concentration: xx% of the market is held by the top 5 players in 2025.
- Innovation Drivers: Increasing demand for digital financial services and government initiatives promoting fintech.
- Regulatory Frameworks: Varying regulations across different MEA countries impact market entry and competition.
- M&A Activity: Analysis of M&A deal values and their impact on market consolidation (xx Million in total deal value in 2024).
MEA BaaS Industry Market Dynamics & Trends
This section delves into the key factors driving the growth of the MEA BaaS market. It explores market growth drivers, technological disruptions, consumer preferences, competitive dynamics, and market penetration rates. The report quantifies these dynamics using metrics such as Compound Annual Growth Rate (CAGR) and market penetration rates. The impact of emerging technologies like AI and blockchain on the BaaS industry is analyzed, along with their influence on market growth and consumer behavior. The competitive landscape, including strategies employed by key players, is also thoroughly examined. The CAGR for the forecast period (2025-2033) is estimated at xx%.
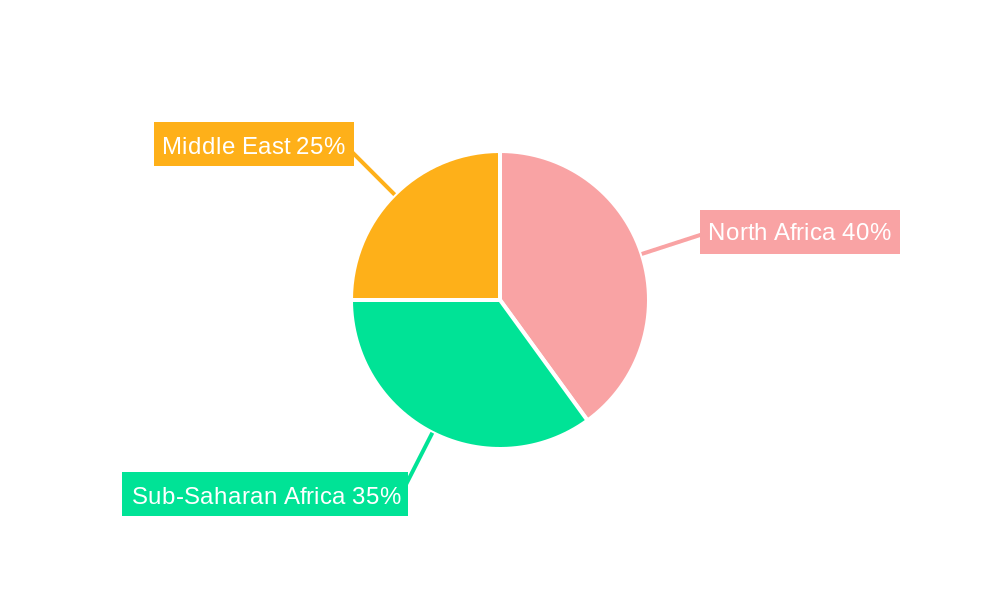
Dominant Regions & Segments in MEA BaaS Industry
This section identifies the leading regions and segments within the MEA BaaS market. A detailed analysis of the dominant region/country highlights key drivers such as favorable economic policies, robust digital infrastructure, and supportive regulatory environments. The dominance analysis will include quantitative and qualitative factors contributing to the region's leadership position.
- Key Drivers of Dominance (e.g., for the UAE):
- Government initiatives promoting digital transformation
- Strong fintech ecosystem
- High smartphone penetration
- Supportive regulatory environment
- Segment Analysis: A detailed breakdown of the performance and growth trajectory of different segments (e.g., by customer type, service offering).
MEA BaaS Industry Product Innovations
This section summarizes recent product developments, applications, and competitive advantages in the MEA BaaS market. It will focus on technological trends, market fit, and the competitive landscape shaped by these innovations. The analysis will cover new features, functionalities, and services offered by BaaS providers and their impact on the market.
Report Scope & Segmentation Analysis
This section details all market segmentations considered in the report. Each segment (e.g., by service type, customer segment, geographic location) will be examined individually, including its projected growth, market size, and competitive dynamics. The report will provide insights into the varying growth prospects of each segment.
Key Drivers of MEA BaaS Industry Growth
This section outlines the key factors driving the growth of the MEA BaaS industry. These drivers include technological advancements, economic factors, and favorable regulatory environments. Specific examples are provided to illustrate each driver's impact.
Challenges in the MEA BaaS Industry Sector
This section identifies and analyzes the challenges facing the MEA BaaS industry. These challenges may include regulatory hurdles, supply chain issues, and competitive pressures. Quantifiable impacts of these challenges on market growth are presented.
Emerging Opportunities in MEA BaaS Industry
This section highlights emerging trends and opportunities within the MEA BaaS industry. These may include new markets, technological advancements, or shifts in consumer preferences.
Leading Players in the MEA BaaS Industry Market
- Sarwa Co
- Beehive Federal Credit Union
- Solaris Bank
- NOW Money
- Treezor
- Telr
- Mamo Pay
- Felix
- Jingle Pay
- Al Baraka Bank
Key Developments in MEA BaaS Industry
- March 2022: Aazzur partnered with Treezor, expanding its BaaS offerings in the MEA region.
- September 2022: Wio Bank launched its "platform bank" in the UAE, boosting the embedded finance and BaaS sector.
Future Outlook for MEA BaaS Industry Market
This section summarizes the growth accelerators and future market potential of the MEA BaaS industry. It identifies strategic opportunities for players in the market to capitalize on future growth. The report projects continued strong growth driven by increasing digital adoption and favorable government policies.
MEA BaaS Industry Segmentation
-
1. Type
- 1.1. API-based BaaS
- 1.2. Cloud based baaS
-
2. Service Type
- 2.1. Payment Process Services
- 2.2. Digital Banking Services
- 2.3. KYC Services
- 2.4. Customer Support Services
- 2.5. Others
-
3. Enterprises Size
- 3.1. Large Enterprises
- 3.2. Small & Medium Enterprises
MEA BaaS Industry Segmentation By Geography
-
1. North America
- 1.1. United States
- 1.2. Canada
- 1.3. Mexico
-
2. South America
- 2.1. Brazil
- 2.2. Argentina
- 2.3. Rest of South America
-
3. Europe
- 3.1. United Kingdom
- 3.2. Germany
- 3.3. France
- 3.4. Italy
- 3.5. Spain
- 3.6. Russia
- 3.7. Benelux
- 3.8. Nordics
- 3.9. Rest of Europe
-
4. Middle East & Africa
- 4.1. Turkey
- 4.2. Israel
- 4.3. GCC
- 4.4. North Africa
- 4.5. South Africa
- 4.6. Rest of Middle East & Africa
-
5. Asia Pacific
- 5.1. China
- 5.2. India
- 5.3. Japan
- 5.4. South Korea
- 5.5. ASEAN
- 5.6. Oceania
- 5.7. Rest of Asia Pacific
MEA BaaS Industry Regional Market Share
Geographic Coverage of MEA BaaS Industry
MEA BaaS Industry REPORT HIGHLIGHTS
| Aspects | Details |
|---|---|
| Study Period | 2020-2034 |
| Base Year | 2025 |
| Estimated Year | 2026 |
| Forecast Period | 2026-2034 |
| Historical Period | 2020-2025 |
| Growth Rate | CAGR of 7.40% from 2020-2034 |
| Segmentation |
|
Table of Contents
- 1. Introduction
- 1.1. Research Scope
- 1.2. Market Segmentation
- 1.3. Research Objective
- 1.4. Definitions and Assumptions
- 2. Executive Summary
- 2.1. Market Snapshot
- 3. Market Dynamics
- 3.1. Market Drivers
- 3.2. Market Restrains
- 3.3. Market Trends
- 3.4. Market Opportunities
- 4. Market Factor Analysis
- 4.1. Porters Five Forces
- 4.1.1. Bargaining Power of Suppliers
- 4.1.2. Bargaining Power of Buyers
- 4.1.3. Threat of New Entrants
- 4.1.4. Threat of Substitutes
- 4.1.5. Competitive Rivalry
- 4.2. PESTEL analysis
- 4.3. BCG Analysis
- 4.3.1. Stars (High Growth, High Market Share)
- 4.3.2. Cash Cows (Low Growth, High Market Share)
- 4.3.3. Question Mark (High Growth, Low Market Share)
- 4.3.4. Dogs (Low Growth, Low Market Share)
- 4.4. Ansoff Matrix Analysis
- 4.5. Supply Chain Analysis
- 4.6. Regulatory Landscape
- 4.7. Current Market Potential and Opportunity Assessment (TAM–SAM–SOM Framework)
- 4.8. PRI Analyst Note
- 4.1. Porters Five Forces
- 5. Market Analysis, Insights and Forecast 2021-2033
- 5.1. Market Analysis, Insights and Forecast - by Type
- 5.1.1. API-based BaaS
- 5.1.2. Cloud based baaS
- 5.2. Market Analysis, Insights and Forecast - by Service Type
- 5.2.1. Payment Process Services
- 5.2.2. Digital Banking Services
- 5.2.3. KYC Services
- 5.2.4. Customer Support Services
- 5.2.5. Others
- 5.3. Market Analysis, Insights and Forecast - by Enterprises Size
- 5.3.1. Large Enterprises
- 5.3.2. Small & Medium Enterprises
- 5.4. Market Analysis, Insights and Forecast - by Region
- 5.4.1. North America
- 5.4.2. South America
- 5.4.3. Europe
- 5.4.4. Middle East & Africa
- 5.4.5. Asia Pacific
- 5.1. Market Analysis, Insights and Forecast - by Type
- 6. Global MEA BaaS Industry Analysis, Insights and Forecast, 2021-2033
- 6.1. Market Analysis, Insights and Forecast - by Type
- 6.1.1. API-based BaaS
- 6.1.2. Cloud based baaS
- 6.2. Market Analysis, Insights and Forecast - by Service Type
- 6.2.1. Payment Process Services
- 6.2.2. Digital Banking Services
- 6.2.3. KYC Services
- 6.2.4. Customer Support Services
- 6.2.5. Others
- 6.3. Market Analysis, Insights and Forecast - by Enterprises Size
- 6.3.1. Large Enterprises
- 6.3.2. Small & Medium Enterprises
- 6.1. Market Analysis, Insights and Forecast - by Type
- 7. North America MEA BaaS Industry Analysis, Insights and Forecast, 2020-2032
- 7.1. Market Analysis, Insights and Forecast - by Type
- 7.1.1. API-based BaaS
- 7.1.2. Cloud based baaS
- 7.2. Market Analysis, Insights and Forecast - by Service Type
- 7.2.1. Payment Process Services
- 7.2.2. Digital Banking Services
- 7.2.3. KYC Services
- 7.2.4. Customer Support Services
- 7.2.5. Others
- 7.3. Market Analysis, Insights and Forecast - by Enterprises Size
- 7.3.1. Large Enterprises
- 7.3.2. Small & Medium Enterprises
- 7.1. Market Analysis, Insights and Forecast - by Type
- 8. South America MEA BaaS Industry Analysis, Insights and Forecast, 2020-2032
- 8.1. Market Analysis, Insights and Forecast - by Type
- 8.1.1. API-based BaaS
- 8.1.2. Cloud based baaS
- 8.2. Market Analysis, Insights and Forecast - by Service Type
- 8.2.1. Payment Process Services
- 8.2.2. Digital Banking Services
- 8.2.3. KYC Services
- 8.2.4. Customer Support Services
- 8.2.5. Others
- 8.3. Market Analysis, Insights and Forecast - by Enterprises Size
- 8.3.1. Large Enterprises
- 8.3.2. Small & Medium Enterprises
- 8.1. Market Analysis, Insights and Forecast - by Type
- 9. Europe MEA BaaS Industry Analysis, Insights and Forecast, 2020-2032
- 9.1. Market Analysis, Insights and Forecast - by Type
- 9.1.1. API-based BaaS
- 9.1.2. Cloud based baaS
- 9.2. Market Analysis, Insights and Forecast - by Service Type
- 9.2.1. Payment Process Services
- 9.2.2. Digital Banking Services
- 9.2.3. KYC Services
- 9.2.4. Customer Support Services
- 9.2.5. Others
- 9.3. Market Analysis, Insights and Forecast - by Enterprises Size
- 9.3.1. Large Enterprises
- 9.3.2. Small & Medium Enterprises
- 9.1. Market Analysis, Insights and Forecast - by Type
- 10. Middle East & Africa MEA BaaS Industry Analysis, Insights and Forecast, 2020-2032
- 10.1. Market Analysis, Insights and Forecast - by Type
- 10.1.1. API-based BaaS
- 10.1.2. Cloud based baaS
- 10.2. Market Analysis, Insights and Forecast - by Service Type
- 10.2.1. Payment Process Services
- 10.2.2. Digital Banking Services
- 10.2.3. KYC Services
- 10.2.4. Customer Support Services
- 10.2.5. Others
- 10.3. Market Analysis, Insights and Forecast - by Enterprises Size
- 10.3.1. Large Enterprises
- 10.3.2. Small & Medium Enterprises
- 10.1. Market Analysis, Insights and Forecast - by Type
- 11. Asia Pacific MEA BaaS Industry Analysis, Insights and Forecast, 2020-2032
- 11.1. Market Analysis, Insights and Forecast - by Type
- 11.1.1. API-based BaaS
- 11.1.2. Cloud based baaS
- 11.2. Market Analysis, Insights and Forecast - by Service Type
- 11.2.1. Payment Process Services
- 11.2.2. Digital Banking Services
- 11.2.3. KYC Services
- 11.2.4. Customer Support Services
- 11.2.5. Others
- 11.3. Market Analysis, Insights and Forecast - by Enterprises Size
- 11.3.1. Large Enterprises
- 11.3.2. Small & Medium Enterprises
- 11.1. Market Analysis, Insights and Forecast - by Type
- 12. Competitive Analysis
- 12.1. Company Profiles
- 12.1.1 Sarwa Co
- 12.1.1.1. Company Overview
- 12.1.1.2. Products
- 12.1.1.3. Company Financials
- 12.1.1.4. SWOT Analysis
- 12.1.2 Beehive Federal Credit Union
- 12.1.2.1. Company Overview
- 12.1.2.2. Products
- 12.1.2.3. Company Financials
- 12.1.2.4. SWOT Analysis
- 12.1.3 Solaris Bank
- 12.1.3.1. Company Overview
- 12.1.3.2. Products
- 12.1.3.3. Company Financials
- 12.1.3.4. SWOT Analysis
- 12.1.4 NOW Money
- 12.1.4.1. Company Overview
- 12.1.4.2. Products
- 12.1.4.3. Company Financials
- 12.1.4.4. SWOT Analysis
- 12.1.5 Treezor
- 12.1.5.1. Company Overview
- 12.1.5.2. Products
- 12.1.5.3. Company Financials
- 12.1.5.4. SWOT Analysis
- 12.1.6 Telr
- 12.1.6.1. Company Overview
- 12.1.6.2. Products
- 12.1.6.3. Company Financials
- 12.1.6.4. SWOT Analysis
- 12.1.7 Mamo Pay
- 12.1.7.1. Company Overview
- 12.1.7.2. Products
- 12.1.7.3. Company Financials
- 12.1.7.4. SWOT Analysis
- 12.1.8 Felix
- 12.1.8.1. Company Overview
- 12.1.8.2. Products
- 12.1.8.3. Company Financials
- 12.1.8.4. SWOT Analysis
- 12.1.9 Jingle Pay
- 12.1.9.1. Company Overview
- 12.1.9.2. Products
- 12.1.9.3. Company Financials
- 12.1.9.4. SWOT Analysis
- 12.1.10 Al Baraka Bank**List Not Exhaustive
- 12.1.10.1. Company Overview
- 12.1.10.2. Products
- 12.1.10.3. Company Financials
- 12.1.10.4. SWOT Analysis
- 12.1.1 Sarwa Co
- 12.2. Market Entropy
- 12.2.1 Company's Key Areas Served
- 12.2.2 Recent Developments
- 12.3. Company Market Share Analysis 2025
- 12.3.1 Top 5 Companies Market Share Analysis
- 12.3.2 Top 3 Companies Market Share Analysis
- 12.4. List of Potential Customers
- 13. Research Methodology
List of Figures
- Figure 1: Global MEA BaaS Industry Revenue Breakdown (Million, %) by Region 2025 & 2033
- Figure 2: Global MEA BaaS Industry Volume Breakdown (Billion, %) by Region 2025 & 2033
- Figure 3: North America MEA BaaS Industry Revenue (Million), by Type 2025 & 2033
- Figure 4: North America MEA BaaS Industry Volume (Billion), by Type 2025 & 2033
- Figure 5: North America MEA BaaS Industry Revenue Share (%), by Type 2025 & 2033
- Figure 6: North America MEA BaaS Industry Volume Share (%), by Type 2025 & 2033
- Figure 7: North America MEA BaaS Industry Revenue (Million), by Service Type 2025 & 2033
- Figure 8: North America MEA BaaS Industry Volume (Billion), by Service Type 2025 & 2033
- Figure 9: North America MEA BaaS Industry Revenue Share (%), by Service Type 2025 & 2033
- Figure 10: North America MEA BaaS Industry Volume Share (%), by Service Type 2025 & 2033
- Figure 11: North America MEA BaaS Industry Revenue (Million), by Enterprises Size 2025 & 2033
- Figure 12: North America MEA BaaS Industry Volume (Billion), by Enterprises Size 2025 & 2033
- Figure 13: North America MEA BaaS Industry Revenue Share (%), by Enterprises Size 2025 & 2033
- Figure 14: North America MEA BaaS Industry Volume Share (%), by Enterprises Size 2025 & 2033
- Figure 15: North America MEA BaaS Industry Revenue (Million), by Country 2025 & 2033
- Figure 16: North America MEA BaaS Industry Volume (Billion), by Country 2025 & 2033
- Figure 17: North America MEA BaaS Industry Revenue Share (%), by Country 2025 & 2033
- Figure 18: North America MEA BaaS Industry Volume Share (%), by Country 2025 & 2033
- Figure 19: South America MEA BaaS Industry Revenue (Million), by Type 2025 & 2033
- Figure 20: South America MEA BaaS Industry Volume (Billion), by Type 2025 & 2033
- Figure 21: South America MEA BaaS Industry Revenue Share (%), by Type 2025 & 2033
- Figure 22: South America MEA BaaS Industry Volume Share (%), by Type 2025 & 2033
- Figure 23: South America MEA BaaS Industry Revenue (Million), by Service Type 2025 & 2033
- Figure 24: South America MEA BaaS Industry Volume (Billion), by Service Type 2025 & 2033
- Figure 25: South America MEA BaaS Industry Revenue Share (%), by Service Type 2025 & 2033
- Figure 26: South America MEA BaaS Industry Volume Share (%), by Service Type 2025 & 2033
- Figure 27: South America MEA BaaS Industry Revenue (Million), by Enterprises Size 2025 & 2033
- Figure 28: South America MEA BaaS Industry Volume (Billion), by Enterprises Size 2025 & 2033
- Figure 29: South America MEA BaaS Industry Revenue Share (%), by Enterprises Size 2025 & 2033
- Figure 30: South America MEA BaaS Industry Volume Share (%), by Enterprises Size 2025 & 2033
- Figure 31: South America MEA BaaS Industry Revenue (Million), by Country 2025 & 2033
- Figure 32: South America MEA BaaS Industry Volume (Billion), by Country 2025 & 2033
- Figure 33: South America MEA BaaS Industry Revenue Share (%), by Country 2025 & 2033
- Figure 34: South America MEA BaaS Industry Volume Share (%), by Country 2025 & 2033
- Figure 35: Europe MEA BaaS Industry Revenue (Million), by Type 2025 & 2033
- Figure 36: Europe MEA BaaS Industry Volume (Billion), by Type 2025 & 2033
- Figure 37: Europe MEA BaaS Industry Revenue Share (%), by Type 2025 & 2033
- Figure 38: Europe MEA BaaS Industry Volume Share (%), by Type 2025 & 2033
- Figure 39: Europe MEA BaaS Industry Revenue (Million), by Service Type 2025 & 2033
- Figure 40: Europe MEA BaaS Industry Volume (Billion), by Service Type 2025 & 2033
- Figure 41: Europe MEA BaaS Industry Revenue Share (%), by Service Type 2025 & 2033
- Figure 42: Europe MEA BaaS Industry Volume Share (%), by Service Type 2025 & 2033
- Figure 43: Europe MEA BaaS Industry Revenue (Million), by Enterprises Size 2025 & 2033
- Figure 44: Europe MEA BaaS Industry Volume (Billion), by Enterprises Size 2025 & 2033
- Figure 45: Europe MEA BaaS Industry Revenue Share (%), by Enterprises Size 2025 & 2033
- Figure 46: Europe MEA BaaS Industry Volume Share (%), by Enterprises Size 2025 & 2033
- Figure 47: Europe MEA BaaS Industry Revenue (Million), by Country 2025 & 2033
- Figure 48: Europe MEA BaaS Industry Volume (Billion), by Country 2025 & 2033
- Figure 49: Europe MEA BaaS Industry Revenue Share (%), by Country 2025 & 2033
- Figure 50: Europe MEA BaaS Industry Volume Share (%), by Country 2025 & 2033
- Figure 51: Middle East & Africa MEA BaaS Industry Revenue (Million), by Type 2025 & 2033
- Figure 52: Middle East & Africa MEA BaaS Industry Volume (Billion), by Type 2025 & 2033
- Figure 53: Middle East & Africa MEA BaaS Industry Revenue Share (%), by Type 2025 & 2033
- Figure 54: Middle East & Africa MEA BaaS Industry Volume Share (%), by Type 2025 & 2033
- Figure 55: Middle East & Africa MEA BaaS Industry Revenue (Million), by Service Type 2025 & 2033
- Figure 56: Middle East & Africa MEA BaaS Industry Volume (Billion), by Service Type 2025 & 2033
- Figure 57: Middle East & Africa MEA BaaS Industry Revenue Share (%), by Service Type 2025 & 2033
- Figure 58: Middle East & Africa MEA BaaS Industry Volume Share (%), by Service Type 2025 & 2033
- Figure 59: Middle East & Africa MEA BaaS Industry Revenue (Million), by Enterprises Size 2025 & 2033
- Figure 60: Middle East & Africa MEA BaaS Industry Volume (Billion), by Enterprises Size 2025 & 2033
- Figure 61: Middle East & Africa MEA BaaS Industry Revenue Share (%), by Enterprises Size 2025 & 2033
- Figure 62: Middle East & Africa MEA BaaS Industry Volume Share (%), by Enterprises Size 2025 & 2033
- Figure 63: Middle East & Africa MEA BaaS Industry Revenue (Million), by Country 2025 & 2033
- Figure 64: Middle East & Africa MEA BaaS Industry Volume (Billion), by Country 2025 & 2033
- Figure 65: Middle East & Africa MEA BaaS Industry Revenue Share (%), by Country 2025 & 2033
- Figure 66: Middle East & Africa MEA BaaS Industry Volume Share (%), by Country 2025 & 2033
- Figure 67: Asia Pacific MEA BaaS Industry Revenue (Million), by Type 2025 & 2033
- Figure 68: Asia Pacific MEA BaaS Industry Volume (Billion), by Type 2025 & 2033
- Figure 69: Asia Pacific MEA BaaS Industry Revenue Share (%), by Type 2025 & 2033
- Figure 70: Asia Pacific MEA BaaS Industry Volume Share (%), by Type 2025 & 2033
- Figure 71: Asia Pacific MEA BaaS Industry Revenue (Million), by Service Type 2025 & 2033
- Figure 72: Asia Pacific MEA BaaS Industry Volume (Billion), by Service Type 2025 & 2033
- Figure 73: Asia Pacific MEA BaaS Industry Revenue Share (%), by Service Type 2025 & 2033
- Figure 74: Asia Pacific MEA BaaS Industry Volume Share (%), by Service Type 2025 & 2033
- Figure 75: Asia Pacific MEA BaaS Industry Revenue (Million), by Enterprises Size 2025 & 2033
- Figure 76: Asia Pacific MEA BaaS Industry Volume (Billion), by Enterprises Size 2025 & 2033
- Figure 77: Asia Pacific MEA BaaS Industry Revenue Share (%), by Enterprises Size 2025 & 2033
- Figure 78: Asia Pacific MEA BaaS Industry Volume Share (%), by Enterprises Size 2025 & 2033
- Figure 79: Asia Pacific MEA BaaS Industry Revenue (Million), by Country 2025 & 2033
- Figure 80: Asia Pacific MEA BaaS Industry Volume (Billion), by Country 2025 & 2033
- Figure 81: Asia Pacific MEA BaaS Industry Revenue Share (%), by Country 2025 & 2033
- Figure 82: Asia Pacific MEA BaaS Industry Volume Share (%), by Country 2025 & 2033
List of Tables
- Table 1: Global MEA BaaS Industry Revenue Million Forecast, by Type 2020 & 2033
- Table 2: Global MEA BaaS Industry Volume Billion Forecast, by Type 2020 & 2033
- Table 3: Global MEA BaaS Industry Revenue Million Forecast, by Service Type 2020 & 2033
- Table 4: Global MEA BaaS Industry Volume Billion Forecast, by Service Type 2020 & 2033
- Table 5: Global MEA BaaS Industry Revenue Million Forecast, by Enterprises Size 2020 & 2033
- Table 6: Global MEA BaaS Industry Volume Billion Forecast, by Enterprises Size 2020 & 2033
- Table 7: Global MEA BaaS Industry Revenue Million Forecast, by Region 2020 & 2033
- Table 8: Global MEA BaaS Industry Volume Billion Forecast, by Region 2020 & 2033
- Table 9: Global MEA BaaS Industry Revenue Million Forecast, by Type 2020 & 2033
- Table 10: Global MEA BaaS Industry Volume Billion Forecast, by Type 2020 & 2033
- Table 11: Global MEA BaaS Industry Revenue Million Forecast, by Service Type 2020 & 2033
- Table 12: Global MEA BaaS Industry Volume Billion Forecast, by Service Type 2020 & 2033
- Table 13: Global MEA BaaS Industry Revenue Million Forecast, by Enterprises Size 2020 & 2033
- Table 14: Global MEA BaaS Industry Volume Billion Forecast, by Enterprises Size 2020 & 2033
- Table 15: Global MEA BaaS Industry Revenue Million Forecast, by Country 2020 & 2033
- Table 16: Global MEA BaaS Industry Volume Billion Forecast, by Country 2020 & 2033
- Table 17: United States MEA BaaS Industry Revenue (Million) Forecast, by Application 2020 & 2033
- Table 18: United States MEA BaaS Industry Volume (Billion) Forecast, by Application 2020 & 2033
- Table 19: Canada MEA BaaS Industry Revenue (Million) Forecast, by Application 2020 & 2033
- Table 20: Canada MEA BaaS Industry Volume (Billion) Forecast, by Application 2020 & 2033
- Table 21: Mexico MEA BaaS Industry Revenue (Million) Forecast, by Application 2020 & 2033
- Table 22: Mexico MEA BaaS Industry Volume (Billion) Forecast, by Application 2020 & 2033
- Table 23: Global MEA BaaS Industry Revenue Million Forecast, by Type 2020 & 2033
- Table 24: Global MEA BaaS Industry Volume Billion Forecast, by Type 2020 & 2033
- Table 25: Global MEA BaaS Industry Revenue Million Forecast, by Service Type 2020 & 2033
- Table 26: Global MEA BaaS Industry Volume Billion Forecast, by Service Type 2020 & 2033
- Table 27: Global MEA BaaS Industry Revenue Million Forecast, by Enterprises Size 2020 & 2033
- Table 28: Global MEA BaaS Industry Volume Billion Forecast, by Enterprises Size 2020 & 2033
- Table 29: Global MEA BaaS Industry Revenue Million Forecast, by Country 2020 & 2033
- Table 30: Global MEA BaaS Industry Volume Billion Forecast, by Country 2020 & 2033
- Table 31: Brazil MEA BaaS Industry Revenue (Million) Forecast, by Application 2020 & 2033
- Table 32: Brazil MEA BaaS Industry Volume (Billion) Forecast, by Application 2020 & 2033
- Table 33: Argentina MEA BaaS Industry Revenue (Million) Forecast, by Application 2020 & 2033
- Table 34: Argentina MEA BaaS Industry Volume (Billion) Forecast, by Application 2020 & 2033
- Table 35: Rest of South America MEA BaaS Industry Revenue (Million) Forecast, by Application 2020 & 2033
- Table 36: Rest of South America MEA BaaS Industry Volume (Billion) Forecast, by Application 2020 & 2033
- Table 37: Global MEA BaaS Industry Revenue Million Forecast, by Type 2020 & 2033
- Table 38: Global MEA BaaS Industry Volume Billion Forecast, by Type 2020 & 2033
- Table 39: Global MEA BaaS Industry Revenue Million Forecast, by Service Type 2020 & 2033
- Table 40: Global MEA BaaS Industry Volume Billion Forecast, by Service Type 2020 & 2033
- Table 41: Global MEA BaaS Industry Revenue Million Forecast, by Enterprises Size 2020 & 2033
- Table 42: Global MEA BaaS Industry Volume Billion Forecast, by Enterprises Size 2020 & 2033
- Table 43: Global MEA BaaS Industry Revenue Million Forecast, by Country 2020 & 2033
- Table 44: Global MEA BaaS Industry Volume Billion Forecast, by Country 2020 & 2033
- Table 45: United Kingdom MEA BaaS Industry Revenue (Million) Forecast, by Application 2020 & 2033
- Table 46: United Kingdom MEA BaaS Industry Volume (Billion) Forecast, by Application 2020 & 2033
- Table 47: Germany MEA BaaS Industry Revenue (Million) Forecast, by Application 2020 & 2033
- Table 48: Germany MEA BaaS Industry Volume (Billion) Forecast, by Application 2020 & 2033
- Table 49: France MEA BaaS Industry Revenue (Million) Forecast, by Application 2020 & 2033
- Table 50: France MEA BaaS Industry Volume (Billion) Forecast, by Application 2020 & 2033
- Table 51: Italy MEA BaaS Industry Revenue (Million) Forecast, by Application 2020 & 2033
- Table 52: Italy MEA BaaS Industry Volume (Billion) Forecast, by Application 2020 & 2033
- Table 53: Spain MEA BaaS Industry Revenue (Million) Forecast, by Application 2020 & 2033
- Table 54: Spain MEA BaaS Industry Volume (Billion) Forecast, by Application 2020 & 2033
- Table 55: Russia MEA BaaS Industry Revenue (Million) Forecast, by Application 2020 & 2033
- Table 56: Russia MEA BaaS Industry Volume (Billion) Forecast, by Application 2020 & 2033
- Table 57: Benelux MEA BaaS Industry Revenue (Million) Forecast, by Application 2020 & 2033
- Table 58: Benelux MEA BaaS Industry Volume (Billion) Forecast, by Application 2020 & 2033
- Table 59: Nordics MEA BaaS Industry Revenue (Million) Forecast, by Application 2020 & 2033
- Table 60: Nordics MEA BaaS Industry Volume (Billion) Forecast, by Application 2020 & 2033
- Table 61: Rest of Europe MEA BaaS Industry Revenue (Million) Forecast, by Application 2020 & 2033
- Table 62: Rest of Europe MEA BaaS Industry Volume (Billion) Forecast, by Application 2020 & 2033
- Table 63: Global MEA BaaS Industry Revenue Million Forecast, by Type 2020 & 2033
- Table 64: Global MEA BaaS Industry Volume Billion Forecast, by Type 2020 & 2033
- Table 65: Global MEA BaaS Industry Revenue Million Forecast, by Service Type 2020 & 2033
- Table 66: Global MEA BaaS Industry Volume Billion Forecast, by Service Type 2020 & 2033
- Table 67: Global MEA BaaS Industry Revenue Million Forecast, by Enterprises Size 2020 & 2033
- Table 68: Global MEA BaaS Industry Volume Billion Forecast, by Enterprises Size 2020 & 2033
- Table 69: Global MEA BaaS Industry Revenue Million Forecast, by Country 2020 & 2033
- Table 70: Global MEA BaaS Industry Volume Billion Forecast, by Country 2020 & 2033
- Table 71: Turkey MEA BaaS Industry Revenue (Million) Forecast, by Application 2020 & 2033
- Table 72: Turkey MEA BaaS Industry Volume (Billion) Forecast, by Application 2020 & 2033
- Table 73: Israel MEA BaaS Industry Revenue (Million) Forecast, by Application 2020 & 2033
- Table 74: Israel MEA BaaS Industry Volume (Billion) Forecast, by Application 2020 & 2033
- Table 75: GCC MEA BaaS Industry Revenue (Million) Forecast, by Application 2020 & 2033
- Table 76: GCC MEA BaaS Industry Volume (Billion) Forecast, by Application 2020 & 2033
- Table 77: North Africa MEA BaaS Industry Revenue (Million) Forecast, by Application 2020 & 2033
- Table 78: North Africa MEA BaaS Industry Volume (Billion) Forecast, by Application 2020 & 2033
- Table 79: South Africa MEA BaaS Industry Revenue (Million) Forecast, by Application 2020 & 2033
- Table 80: South Africa MEA BaaS Industry Volume (Billion) Forecast, by Application 2020 & 2033
- Table 81: Rest of Middle East & Africa MEA BaaS Industry Revenue (Million) Forecast, by Application 2020 & 2033
- Table 82: Rest of Middle East & Africa MEA BaaS Industry Volume (Billion) Forecast, by Application 2020 & 2033
- Table 83: Global MEA BaaS Industry Revenue Million Forecast, by Type 2020 & 2033
- Table 84: Global MEA BaaS Industry Volume Billion Forecast, by Type 2020 & 2033
- Table 85: Global MEA BaaS Industry Revenue Million Forecast, by Service Type 2020 & 2033
- Table 86: Global MEA BaaS Industry Volume Billion Forecast, by Service Type 2020 & 2033
- Table 87: Global MEA BaaS Industry Revenue Million Forecast, by Enterprises Size 2020 & 2033
- Table 88: Global MEA BaaS Industry Volume Billion Forecast, by Enterprises Size 2020 & 2033
- Table 89: Global MEA BaaS Industry Revenue Million Forecast, by Country 2020 & 2033
- Table 90: Global MEA BaaS Industry Volume Billion Forecast, by Country 2020 & 2033
- Table 91: China MEA BaaS Industry Revenue (Million) Forecast, by Application 2020 & 2033
- Table 92: China MEA BaaS Industry Volume (Billion) Forecast, by Application 2020 & 2033
- Table 93: India MEA BaaS Industry Revenue (Million) Forecast, by Application 2020 & 2033
- Table 94: India MEA BaaS Industry Volume (Billion) Forecast, by Application 2020 & 2033
- Table 95: Japan MEA BaaS Industry Revenue (Million) Forecast, by Application 2020 & 2033
- Table 96: Japan MEA BaaS Industry Volume (Billion) Forecast, by Application 2020 & 2033
- Table 97: South Korea MEA BaaS Industry Revenue (Million) Forecast, by Application 2020 & 2033
- Table 98: South Korea MEA BaaS Industry Volume (Billion) Forecast, by Application 2020 & 2033
- Table 99: ASEAN MEA BaaS Industry Revenue (Million) Forecast, by Application 2020 & 2033
- Table 100: ASEAN MEA BaaS Industry Volume (Billion) Forecast, by Application 2020 & 2033
- Table 101: Oceania MEA BaaS Industry Revenue (Million) Forecast, by Application 2020 & 2033
- Table 102: Oceania MEA BaaS Industry Volume (Billion) Forecast, by Application 2020 & 2033
- Table 103: Rest of Asia Pacific MEA BaaS Industry Revenue (Million) Forecast, by Application 2020 & 2033
- Table 104: Rest of Asia Pacific MEA BaaS Industry Volume (Billion) Forecast, by Application 2020 & 2033
Frequently Asked Questions
1. What is the projected Compound Annual Growth Rate (CAGR) of the MEA BaaS Industry?
The projected CAGR is approximately 7.40%.
2. Which companies are prominent players in the MEA BaaS Industry?
Key companies in the market include Sarwa Co, Beehive Federal Credit Union, Solaris Bank, NOW Money, Treezor, Telr, Mamo Pay, Felix, Jingle Pay, Al Baraka Bank**List Not Exhaustive.
3. What are the main segments of the MEA BaaS Industry?
The market segments include Type, Service Type, Enterprises Size.
4. Can you provide details about the market size?
The market size is estimated to be USD 65.51 Million as of 2022.
5. What are some drivers contributing to market growth?
Rise in Digital Banking the Region; Rise in Volume of Financial Transaction in the Region.
6. What are the notable trends driving market growth?
Rising Volume of Transaction in the Region.
7. Are there any restraints impacting market growth?
Rise in Digital Banking the Region; Rise in Volume of Financial Transaction in the Region.
8. Can you provide examples of recent developments in the market?
In March 2022. Aazzur partnered with Treezor which exists as a European firm in Banking-as-a-Service (BaaS). The partnership will increase Aazzur's client base and develop its BaaS offering in the region by supplying its payment infrastructure for account and card management, while Aazur will provide front-end layers, integration, and value-added products for front-end and wealth services.
9. What pricing options are available for accessing the report?
Pricing options include single-user, multi-user, and enterprise licenses priced at USD 3800, USD 4500, and USD 5800 respectively.
10. Is the market size provided in terms of value or volume?
The market size is provided in terms of value, measured in Million and volume, measured in Billion.
11. Are there any specific market keywords associated with the report?
Yes, the market keyword associated with the report is "MEA BaaS Industry," which aids in identifying and referencing the specific market segment covered.
12. How do I determine which pricing option suits my needs best?
The pricing options vary based on user requirements and access needs. Individual users may opt for single-user licenses, while businesses requiring broader access may choose multi-user or enterprise licenses for cost-effective access to the report.
13. Are there any additional resources or data provided in the MEA BaaS Industry report?
While the report offers comprehensive insights, it's advisable to review the specific contents or supplementary materials provided to ascertain if additional resources or data are available.
14. How can I stay updated on further developments or reports in the MEA BaaS Industry?
To stay informed about further developments, trends, and reports in the MEA BaaS Industry, consider subscribing to industry newsletters, following relevant companies and organizations, or regularly checking reputable industry news sources and publications.
Methodology
Step 1 - Identification of Relevant Samples Size from Population Database


Step 2 - Approaches for Defining Global Market Size (Value, Volume* & Price*)

Note*: In applicable scenarios
Step 3 - Data Sources
Primary Research
- Web Analytics
- Survey Reports
- Research Institute
- Latest Research Reports
- Opinion Leaders
Secondary Research
- Annual Reports
- White Paper
- Latest Press Release
- Industry Association
- Paid Database
- Investor Presentations

Step 4 - Data Triangulation
Involves using different sources of information in order to increase the validity of a study
These sources are likely to be stakeholders in a program - participants, other researchers, program staff, other community members, and so on.
Then we put all data in single framework & apply various statistical tools to find out the dynamic on the market.
During the analysis stage, feedback from the stakeholder groups would be compared to determine areas of agreement as well as areas of divergence

