Key Insights
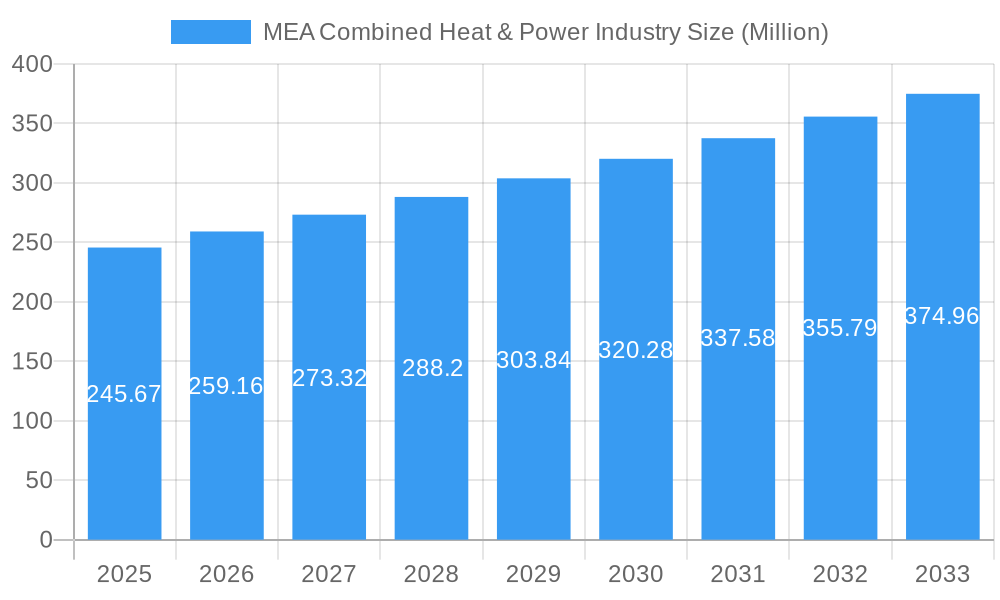
The MEA Combined Heat & Power (CHP) industry is poised for significant growth, driven by increasing energy demands, industrialization, and government initiatives promoting energy efficiency. The region's substantial reliance on fossil fuels presents a compelling case for CHP adoption, offering a pathway to reduce carbon emissions and enhance energy security. While the market size in 2025 is estimated at $245.67 million, we project robust expansion, fueled by a Compound Annual Growth Rate (CAGR) exceeding 5.1%. Key drivers include the burgeoning industrial sector in countries like Saudi Arabia and the UAE, where CHP systems offer cost-effective and reliable energy solutions. Furthermore, supportive government policies aimed at diversifying energy sources and promoting sustainable practices are further bolstering market growth. The automotive sector's expansion in the region, combined with growing adoption of CHP in the portable power segment, will contribute substantially to this growth trajectory. However, challenges such as high initial investment costs, technological complexities, and regulatory hurdles in certain countries might temper the growth rate.
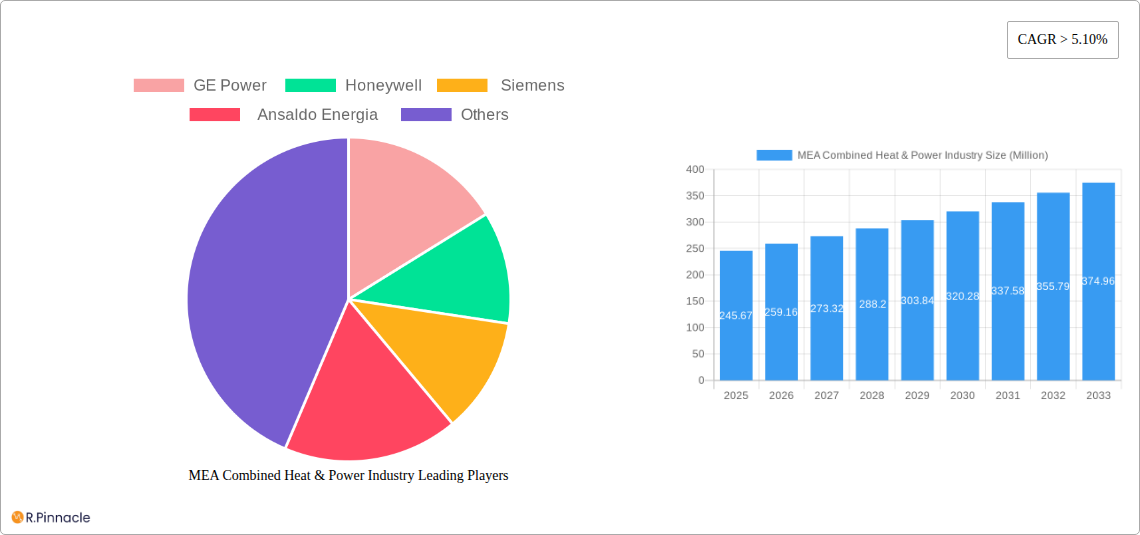
MEA Combined Heat & Power Industry Market Size (In Million)
Despite these restraints, the long-term outlook for the MEA CHP market remains positive. The increasing emphasis on sustainable development and the need for reliable power infrastructure will stimulate demand for efficient and environmentally friendly CHP systems. Significant growth opportunities exist in sectors such as data centers, hospitals, and commercial buildings, where reliable and efficient power is crucial. Leading players like GE Power, Honeywell, Siemens, and Ansaldo Energia are actively shaping the market through technological advancements, strategic partnerships, and market expansion strategies. The focus on optimizing existing infrastructure and integrating renewable energy sources into CHP systems is further enhancing their appeal to potential customers. This market is segmented based on application, primarily encompassing automotive, industrial, portable, and other applications, with the industrial sector expected to hold the largest share due to its energy-intensive processes.
MEA Combined Heat & Power Industry Company Market Share
MEA Combined Heat & Power Industry: Market Report 2019-2033
This comprehensive report provides an in-depth analysis of the Middle East and Africa (MEA) Combined Heat & Power (CHP) industry, offering invaluable insights for industry professionals, investors, and strategic decision-makers. The report covers the period from 2019 to 2033, with a focus on the forecast period of 2025-2033 and a base year of 2025. Key players analyzed include GE Power, Honeywell, Siemens, and Ansaldo Energia. The total market size is projected to reach xx Million by 2033.
MEA Combined Heat & Power Industry Market Structure & Innovation Trends
The MEA CHP market exhibits a moderately concentrated structure, with key players like GE Power, Honeywell, Siemens, and Ansaldo Energia holding significant market share. However, the presence of several smaller, regional players contributes to a dynamic competitive landscape. Innovation is driven by the need for efficient energy solutions, stringent environmental regulations, and increasing demand from diverse sectors.
- Market Concentration: GE Power and Siemens hold an estimated combined market share of 45%, while Honeywell and Ansaldo Energia together account for approximately 30%. Remaining share is divided among smaller players and regional operators.
- Innovation Drivers: Government incentives for renewable energy integration, advancements in CHP technology (e.g., micro-CHP systems), and increasing energy security concerns are key drivers.
- Regulatory Frameworks: Varying national policies regarding energy efficiency and emissions standards significantly influence market growth and technological adoption.
- Product Substitutes: Conventional power generation methods pose a competitive challenge, but the increasing cost of electricity and environmental regulations provide advantages for CHP solutions.
- End-User Demographics: The industrial sector, particularly manufacturing and process industries, are primary end-users, followed by commercial and institutional buildings.
- M&A Activities: The past five years have witnessed xx Million worth of M&A deals, primarily focused on consolidation and technology acquisition. The average deal size was approximately xx Million.
MEA Combined Heat & Power Industry Market Dynamics & Trends
The MEA CHP market is experiencing robust growth, driven by factors such as increasing industrialization, urbanization, and rising energy demand across diverse sectors. Technological advancements, including the integration of renewable energy sources and digital technologies, are reshaping the industry. Consumer preference is shifting towards sustainable and efficient energy solutions, creating new opportunities for CHP providers.
The market is estimated to achieve a CAGR of xx% during the forecast period (2025-2033). Market penetration of CHP systems within the industrial sector is expected to reach xx% by 2033, driven by increased awareness of the economic and environmental benefits. Competitive dynamics are characterized by intense rivalry among major players focusing on technology differentiation, service offerings, and geographical expansion. Technological disruptions, such as advancements in fuel cell technology and improved energy storage solutions, will continue to impact market dynamics.
Dominant Regions & Segments in MEA Combined Heat & Power Industry
The Industrial segment dominates the MEA CHP market, driven by the region’s robust industrial growth and the high energy consumption of manufacturing facilities. The UAE and Saudi Arabia are leading regional markets, due to their substantial industrial bases and government support for energy efficiency initiatives.
- Key Drivers in the Industrial Segment:
- Strong industrial growth across multiple sectors.
- Government policies promoting energy efficiency and industrial development.
- High energy costs and the need for reliable power supply.
- Dominance Analysis: The Industrial segment's dominance is attributed to its large-scale energy requirements and the significant cost savings achieved through CHP technologies, compared to separate heat and power generation. This segment is expected to witness consistent growth during the forecast period.
MEA Combined Heat & Power Industry Product Innovations
Recent innovations focus on improving efficiency, reducing emissions, and integrating renewable energy sources. Advancements include the development of high-efficiency gas turbines, biomass-fueled CHP systems, and hybrid solutions integrating solar or wind power. These innovations aim to enhance the competitiveness and market appeal of CHP technologies, while addressing environmental concerns. The market is witnessing a growing trend toward smaller, decentralized CHP systems, particularly in the industrial and commercial sectors.
Report Scope & Segmentation Analysis
This report segments the MEA CHP market by application: Automotive, Industrial, Portable, and Other Applications.
- Automotive: This segment is relatively small, focusing primarily on auxiliary power units (APUs) in heavy-duty vehicles. Growth is limited due to the specific application, with expected market size reaching xx Million by 2033.
- Industrial: This is the largest segment, characterized by high energy demand from manufacturing and process industries. Growth is driven by increasing industrial output and government support. The market size is projected at xx Million by 2033.
- Portable: This segment comprises smaller, mobile CHP units for remote or off-grid applications. The market size remains relatively small, with potential for growth in specific niches. Expected market size to be xx Million by 2033.
- Other Applications: This segment encompasses diverse applications, including commercial and institutional buildings, data centers, and district heating systems. The market size is projected at xx Million by 2033.
Key Drivers of MEA Combined Heat & Power Industry Growth
The MEA CHP market is propelled by several key factors: the rising energy demand across various sectors, increasing focus on energy efficiency and sustainability, government initiatives promoting renewable energy integration, and the economic advantages of CHP technology in reducing operational costs. These factors collectively create a favorable environment for the expansion of the CHP market in the MEA region.
Challenges in the MEA Combined Heat & Power Industry Sector
The MEA CHP industry faces challenges including high initial investment costs for CHP systems, complex regulatory approvals, and the fluctuating prices of fuel. Supply chain disruptions related to equipment and components also pose significant challenges, affecting the timely completion of projects. The competitive pressure from established power generation technologies adds another layer of complexity to market penetration. These challenges result in an estimated xx% reduction in market growth annually.
Emerging Opportunities in MEA Combined Heat & Power Industry
Significant opportunities lie in integrating renewable energy sources (solar, wind) with CHP systems to improve sustainability and reduce reliance on fossil fuels. Expanding into new markets, particularly in rural and remote areas, offers further potential. Growing adoption of smart grid technologies and digital solutions for optimizing CHP operations will also present substantial opportunities.
Key Developments in MEA Combined Heat & Power Industry
- Mar 2023: Qatar Water and Electricity Company awarded GE Power a nine-year contract for operations and maintenance services at the Ras Abu Fontas B2 Cogeneration Plant. This signifies increased reliance on established players for long-term operational support.
- Dec 2022: The African Development Bank supported project proposals for CHP bioenergy plants in Ghana and Sierra Leone, indicating growing interest in renewable energy-based CHP solutions in Africa and highlighting the potential for growth in smaller markets.
Future Outlook for MEA Combined Heat & Power Industry Market
The MEA CHP market is poised for continued growth, driven by a combination of factors, including increasing energy demand, government support for renewable energy, and technological advancements that enhance efficiency and reduce emissions. Strategic partnerships and investments in research and development will play a crucial role in shaping the future of the industry, unlocking new opportunities and contributing to a more sustainable energy landscape.
MEA Combined Heat & Power Industry Segmentation
-
1. Capacity
- 1.1. Small-scale (below 20 MW)
- 1.2. Medium-scale (20-50 MW)
- 1.3. Large-scale (above 50 MW)
-
2. Fuel
- 2.1. Natural gas
- 2.2. Diesel
- 2.3. Biomass
- 2.4. Others
-
3. Application
- 3.1. Industrial
- 3.2. Commercial
- 3.3. Residential
MEA Combined Heat & Power Industry Segmentation By Geography
- 1. Saudi Arabia
- 2. South Africa
- 3. United Arab Emirates
- 4. Rest of the Middle East and Africa
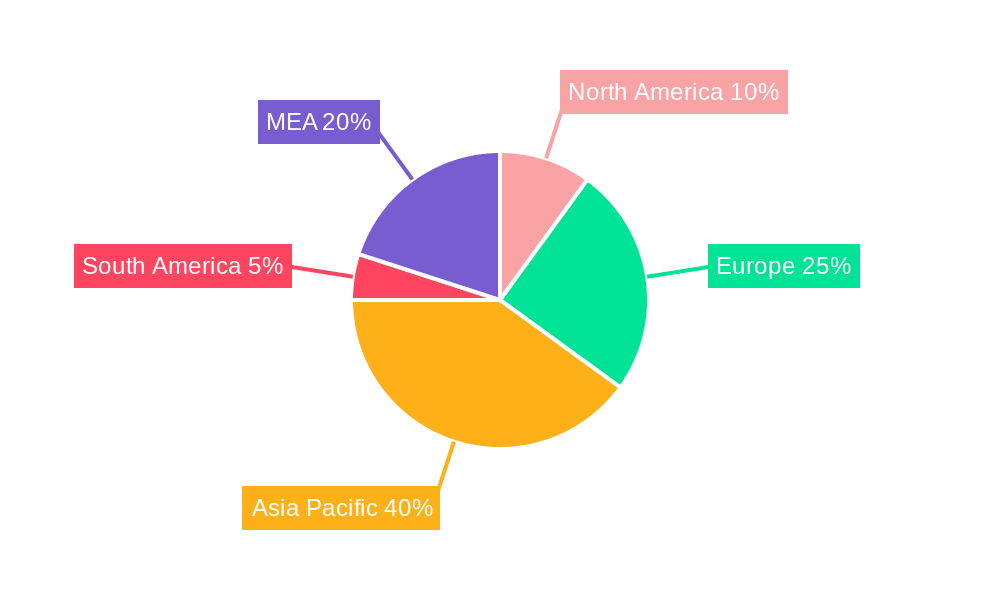
MEA Combined Heat & Power Industry Regional Market Share
Geographic Coverage of MEA Combined Heat & Power Industry
MEA Combined Heat & Power Industry REPORT HIGHLIGHTS
| Aspects | Details |
|---|---|
| Study Period | 2020-2034 |
| Base Year | 2025 |
| Estimated Year | 2026 |
| Forecast Period | 2026-2034 |
| Historical Period | 2020-2025 |
| Growth Rate | CAGR of > 5.10% from 2020-2034 |
| Segmentation |
|
Table of Contents
- 1. Introduction
- 1.1. Research Scope
- 1.2. Market Segmentation
- 1.3. Research Methodology
- 1.4. Definitions and Assumptions
- 2. Executive Summary
- 2.1. Introduction
- 3. Market Dynamics
- 3.1. Introduction
- 3.2. Market Drivers
- 3.2.1. 4.; Increasing Industrial Growth4.; Energy Efficiency
- 3.3. Market Restrains
- 3.3.1. 4.; Penetration of Alternative Energy Sources
- 3.4. Market Trends
- 3.4.1. Biomass Expected to See Significant Market Growth
- 4. Market Factor Analysis
- 4.1. Porters Five Forces
- 4.2. Supply/Value Chain
- 4.3. PESTEL analysis
- 4.4. Market Entropy
- 4.5. Patent/Trademark Analysis
- 5. Global MEA Combined Heat & Power Industry Analysis, Insights and Forecast, 2020-2032
- 5.1. Market Analysis, Insights and Forecast - by Capacity
- 5.1.1. Small-scale (below 20 MW)
- 5.1.2. Medium-scale (20-50 MW)
- 5.1.3. Large-scale (above 50 MW)
- 5.2. Market Analysis, Insights and Forecast - by Fuel
- 5.2.1. Natural gas
- 5.2.2. Diesel
- 5.2.3. Biomass
- 5.2.4. Others
- 5.3. Market Analysis, Insights and Forecast - by Application
- 5.3.1. Industrial
- 5.3.2. Commercial
- 5.3.3. Residential
- 5.4. Market Analysis, Insights and Forecast - by Region
- 5.4.1. Saudi Arabia
- 5.4.2. South Africa
- 5.4.3. United Arab Emirates
- 5.4.4. Rest of the Middle East and Africa
- 5.1. Market Analysis, Insights and Forecast - by Capacity
- 6. Saudi Arabia MEA Combined Heat & Power Industry Analysis, Insights and Forecast, 2020-2032
- 6.1. Market Analysis, Insights and Forecast - by Capacity
- 6.1.1. Small-scale (below 20 MW)
- 6.1.2. Medium-scale (20-50 MW)
- 6.1.3. Large-scale (above 50 MW)
- 6.2. Market Analysis, Insights and Forecast - by Fuel
- 6.2.1. Natural gas
- 6.2.2. Diesel
- 6.2.3. Biomass
- 6.2.4. Others
- 6.3. Market Analysis, Insights and Forecast - by Application
- 6.3.1. Industrial
- 6.3.2. Commercial
- 6.3.3. Residential
- 6.1. Market Analysis, Insights and Forecast - by Capacity
- 7. South Africa MEA Combined Heat & Power Industry Analysis, Insights and Forecast, 2020-2032
- 7.1. Market Analysis, Insights and Forecast - by Capacity
- 7.1.1. Small-scale (below 20 MW)
- 7.1.2. Medium-scale (20-50 MW)
- 7.1.3. Large-scale (above 50 MW)
- 7.2. Market Analysis, Insights and Forecast - by Fuel
- 7.2.1. Natural gas
- 7.2.2. Diesel
- 7.2.3. Biomass
- 7.2.4. Others
- 7.3. Market Analysis, Insights and Forecast - by Application
- 7.3.1. Industrial
- 7.3.2. Commercial
- 7.3.3. Residential
- 7.1. Market Analysis, Insights and Forecast - by Capacity
- 8. United Arab Emirates MEA Combined Heat & Power Industry Analysis, Insights and Forecast, 2020-2032
- 8.1. Market Analysis, Insights and Forecast - by Capacity
- 8.1.1. Small-scale (below 20 MW)
- 8.1.2. Medium-scale (20-50 MW)
- 8.1.3. Large-scale (above 50 MW)
- 8.2. Market Analysis, Insights and Forecast - by Fuel
- 8.2.1. Natural gas
- 8.2.2. Diesel
- 8.2.3. Biomass
- 8.2.4. Others
- 8.3. Market Analysis, Insights and Forecast - by Application
- 8.3.1. Industrial
- 8.3.2. Commercial
- 8.3.3. Residential
- 8.1. Market Analysis, Insights and Forecast - by Capacity
- 9. Rest of the Middle East and Africa MEA Combined Heat & Power Industry Analysis, Insights and Forecast, 2020-2032
- 9.1. Market Analysis, Insights and Forecast - by Capacity
- 9.1.1. Small-scale (below 20 MW)
- 9.1.2. Medium-scale (20-50 MW)
- 9.1.3. Large-scale (above 50 MW)
- 9.2. Market Analysis, Insights and Forecast - by Fuel
- 9.2.1. Natural gas
- 9.2.2. Diesel
- 9.2.3. Biomass
- 9.2.4. Others
- 9.3. Market Analysis, Insights and Forecast - by Application
- 9.3.1. Industrial
- 9.3.2. Commercial
- 9.3.3. Residential
- 9.1. Market Analysis, Insights and Forecast - by Capacity
- 10. Competitive Analysis
- 10.1. Global Market Share Analysis 2025
- 10.2. Company Profiles
- 10.2.1 GE Power
- 10.2.1.1. Overview
- 10.2.1.2. Products
- 10.2.1.3. SWOT Analysis
- 10.2.1.4. Recent Developments
- 10.2.1.5. Financials (Based on Availability)
- 10.2.2 Honeywell
- 10.2.2.1. Overview
- 10.2.2.2. Products
- 10.2.2.3. SWOT Analysis
- 10.2.2.4. Recent Developments
- 10.2.2.5. Financials (Based on Availability)
- 10.2.3 Siemens
- 10.2.3.1. Overview
- 10.2.3.2. Products
- 10.2.3.3. SWOT Analysis
- 10.2.3.4. Recent Developments
- 10.2.3.5. Financials (Based on Availability)
- 10.2.4 Ansaldo Energia
- 10.2.4.1. Overview
- 10.2.4.2. Products
- 10.2.4.3. SWOT Analysis
- 10.2.4.4. Recent Developments
- 10.2.4.5. Financials (Based on Availability)
- 10.2.1 GE Power
List of Figures
- Figure 1: Global MEA Combined Heat & Power Industry Revenue Breakdown (Million, %) by Region 2025 & 2033
- Figure 2: Saudi Arabia MEA Combined Heat & Power Industry Revenue (Million), by Capacity 2025 & 2033
- Figure 3: Saudi Arabia MEA Combined Heat & Power Industry Revenue Share (%), by Capacity 2025 & 2033
- Figure 4: Saudi Arabia MEA Combined Heat & Power Industry Revenue (Million), by Fuel 2025 & 2033
- Figure 5: Saudi Arabia MEA Combined Heat & Power Industry Revenue Share (%), by Fuel 2025 & 2033
- Figure 6: Saudi Arabia MEA Combined Heat & Power Industry Revenue (Million), by Application 2025 & 2033
- Figure 7: Saudi Arabia MEA Combined Heat & Power Industry Revenue Share (%), by Application 2025 & 2033
- Figure 8: Saudi Arabia MEA Combined Heat & Power Industry Revenue (Million), by Country 2025 & 2033
- Figure 9: Saudi Arabia MEA Combined Heat & Power Industry Revenue Share (%), by Country 2025 & 2033
- Figure 10: South Africa MEA Combined Heat & Power Industry Revenue (Million), by Capacity 2025 & 2033
- Figure 11: South Africa MEA Combined Heat & Power Industry Revenue Share (%), by Capacity 2025 & 2033
- Figure 12: South Africa MEA Combined Heat & Power Industry Revenue (Million), by Fuel 2025 & 2033
- Figure 13: South Africa MEA Combined Heat & Power Industry Revenue Share (%), by Fuel 2025 & 2033
- Figure 14: South Africa MEA Combined Heat & Power Industry Revenue (Million), by Application 2025 & 2033
- Figure 15: South Africa MEA Combined Heat & Power Industry Revenue Share (%), by Application 2025 & 2033
- Figure 16: South Africa MEA Combined Heat & Power Industry Revenue (Million), by Country 2025 & 2033
- Figure 17: South Africa MEA Combined Heat & Power Industry Revenue Share (%), by Country 2025 & 2033
- Figure 18: United Arab Emirates MEA Combined Heat & Power Industry Revenue (Million), by Capacity 2025 & 2033
- Figure 19: United Arab Emirates MEA Combined Heat & Power Industry Revenue Share (%), by Capacity 2025 & 2033
- Figure 20: United Arab Emirates MEA Combined Heat & Power Industry Revenue (Million), by Fuel 2025 & 2033
- Figure 21: United Arab Emirates MEA Combined Heat & Power Industry Revenue Share (%), by Fuel 2025 & 2033
- Figure 22: United Arab Emirates MEA Combined Heat & Power Industry Revenue (Million), by Application 2025 & 2033
- Figure 23: United Arab Emirates MEA Combined Heat & Power Industry Revenue Share (%), by Application 2025 & 2033
- Figure 24: United Arab Emirates MEA Combined Heat & Power Industry Revenue (Million), by Country 2025 & 2033
- Figure 25: United Arab Emirates MEA Combined Heat & Power Industry Revenue Share (%), by Country 2025 & 2033
- Figure 26: Rest of the Middle East and Africa MEA Combined Heat & Power Industry Revenue (Million), by Capacity 2025 & 2033
- Figure 27: Rest of the Middle East and Africa MEA Combined Heat & Power Industry Revenue Share (%), by Capacity 2025 & 2033
- Figure 28: Rest of the Middle East and Africa MEA Combined Heat & Power Industry Revenue (Million), by Fuel 2025 & 2033
- Figure 29: Rest of the Middle East and Africa MEA Combined Heat & Power Industry Revenue Share (%), by Fuel 2025 & 2033
- Figure 30: Rest of the Middle East and Africa MEA Combined Heat & Power Industry Revenue (Million), by Application 2025 & 2033
- Figure 31: Rest of the Middle East and Africa MEA Combined Heat & Power Industry Revenue Share (%), by Application 2025 & 2033
- Figure 32: Rest of the Middle East and Africa MEA Combined Heat & Power Industry Revenue (Million), by Country 2025 & 2033
- Figure 33: Rest of the Middle East and Africa MEA Combined Heat & Power Industry Revenue Share (%), by Country 2025 & 2033
List of Tables
- Table 1: Global MEA Combined Heat & Power Industry Revenue Million Forecast, by Capacity 2020 & 2033
- Table 2: Global MEA Combined Heat & Power Industry Revenue Million Forecast, by Fuel 2020 & 2033
- Table 3: Global MEA Combined Heat & Power Industry Revenue Million Forecast, by Application 2020 & 2033
- Table 4: Global MEA Combined Heat & Power Industry Revenue Million Forecast, by Region 2020 & 2033
- Table 5: Global MEA Combined Heat & Power Industry Revenue Million Forecast, by Capacity 2020 & 2033
- Table 6: Global MEA Combined Heat & Power Industry Revenue Million Forecast, by Fuel 2020 & 2033
- Table 7: Global MEA Combined Heat & Power Industry Revenue Million Forecast, by Application 2020 & 2033
- Table 8: Global MEA Combined Heat & Power Industry Revenue Million Forecast, by Country 2020 & 2033
- Table 9: Global MEA Combined Heat & Power Industry Revenue Million Forecast, by Capacity 2020 & 2033
- Table 10: Global MEA Combined Heat & Power Industry Revenue Million Forecast, by Fuel 2020 & 2033
- Table 11: Global MEA Combined Heat & Power Industry Revenue Million Forecast, by Application 2020 & 2033
- Table 12: Global MEA Combined Heat & Power Industry Revenue Million Forecast, by Country 2020 & 2033
- Table 13: Global MEA Combined Heat & Power Industry Revenue Million Forecast, by Capacity 2020 & 2033
- Table 14: Global MEA Combined Heat & Power Industry Revenue Million Forecast, by Fuel 2020 & 2033
- Table 15: Global MEA Combined Heat & Power Industry Revenue Million Forecast, by Application 2020 & 2033
- Table 16: Global MEA Combined Heat & Power Industry Revenue Million Forecast, by Country 2020 & 2033
- Table 17: Global MEA Combined Heat & Power Industry Revenue Million Forecast, by Capacity 2020 & 2033
- Table 18: Global MEA Combined Heat & Power Industry Revenue Million Forecast, by Fuel 2020 & 2033
- Table 19: Global MEA Combined Heat & Power Industry Revenue Million Forecast, by Application 2020 & 2033
- Table 20: Global MEA Combined Heat & Power Industry Revenue Million Forecast, by Country 2020 & 2033
Frequently Asked Questions
1. What is the projected Compound Annual Growth Rate (CAGR) of the MEA Combined Heat & Power Industry?
The projected CAGR is approximately > 5.10%.
2. Which companies are prominent players in the MEA Combined Heat & Power Industry?
Key companies in the market include GE Power , Honeywell, Siemens, Ansaldo Energia .
3. What are the main segments of the MEA Combined Heat & Power Industry?
The market segments include Capacity, Fuel, Application.
4. Can you provide details about the market size?
The market size is estimated to be USD 245.67 Million as of 2022.
5. What are some drivers contributing to market growth?
4.; Increasing Industrial Growth4.; Energy Efficiency.
6. What are the notable trends driving market growth?
Biomass Expected to See Significant Market Growth.
7. Are there any restraints impacting market growth?
4.; Penetration of Alternative Energy Sources.
8. Can you provide examples of recent developments in the market?
Mar 2023: Qatar Water and Electricity Company announced that it was awarded General Electric Company contracts to provide operations and maintenance services for its 9F gas turbines installed at the Ras Abu Fontas B2 (RAF B2) Cogeneration Plant in Doha. The duration of the contract awarded is nine years.
9. What pricing options are available for accessing the report?
Pricing options include single-user, multi-user, and enterprise licenses priced at USD 4750, USD 5250, and USD 8750 respectively.
10. Is the market size provided in terms of value or volume?
The market size is provided in terms of value, measured in Million.
11. Are there any specific market keywords associated with the report?
Yes, the market keyword associated with the report is "MEA Combined Heat & Power Industry," which aids in identifying and referencing the specific market segment covered.
12. How do I determine which pricing option suits my needs best?
The pricing options vary based on user requirements and access needs. Individual users may opt for single-user licenses, while businesses requiring broader access may choose multi-user or enterprise licenses for cost-effective access to the report.
13. Are there any additional resources or data provided in the MEA Combined Heat & Power Industry report?
While the report offers comprehensive insights, it's advisable to review the specific contents or supplementary materials provided to ascertain if additional resources or data are available.
14. How can I stay updated on further developments or reports in the MEA Combined Heat & Power Industry?
To stay informed about further developments, trends, and reports in the MEA Combined Heat & Power Industry, consider subscribing to industry newsletters, following relevant companies and organizations, or regularly checking reputable industry news sources and publications.
Methodology
Step 1 - Identification of Relevant Samples Size from Population Database


Step 2 - Approaches for Defining Global Market Size (Value, Volume* & Price*)

Note*: In applicable scenarios
Step 3 - Data Sources
Primary Research
- Web Analytics
- Survey Reports
- Research Institute
- Latest Research Reports
- Opinion Leaders
Secondary Research
- Annual Reports
- White Paper
- Latest Press Release
- Industry Association
- Paid Database
- Investor Presentations

Step 4 - Data Triangulation
Involves using different sources of information in order to increase the validity of a study
These sources are likely to be stakeholders in a program - participants, other researchers, program staff, other community members, and so on.
Then we put all data in single framework & apply various statistical tools to find out the dynamic on the market.
During the analysis stage, feedback from the stakeholder groups would be compared to determine areas of agreement as well as areas of divergence

