

Key Insights
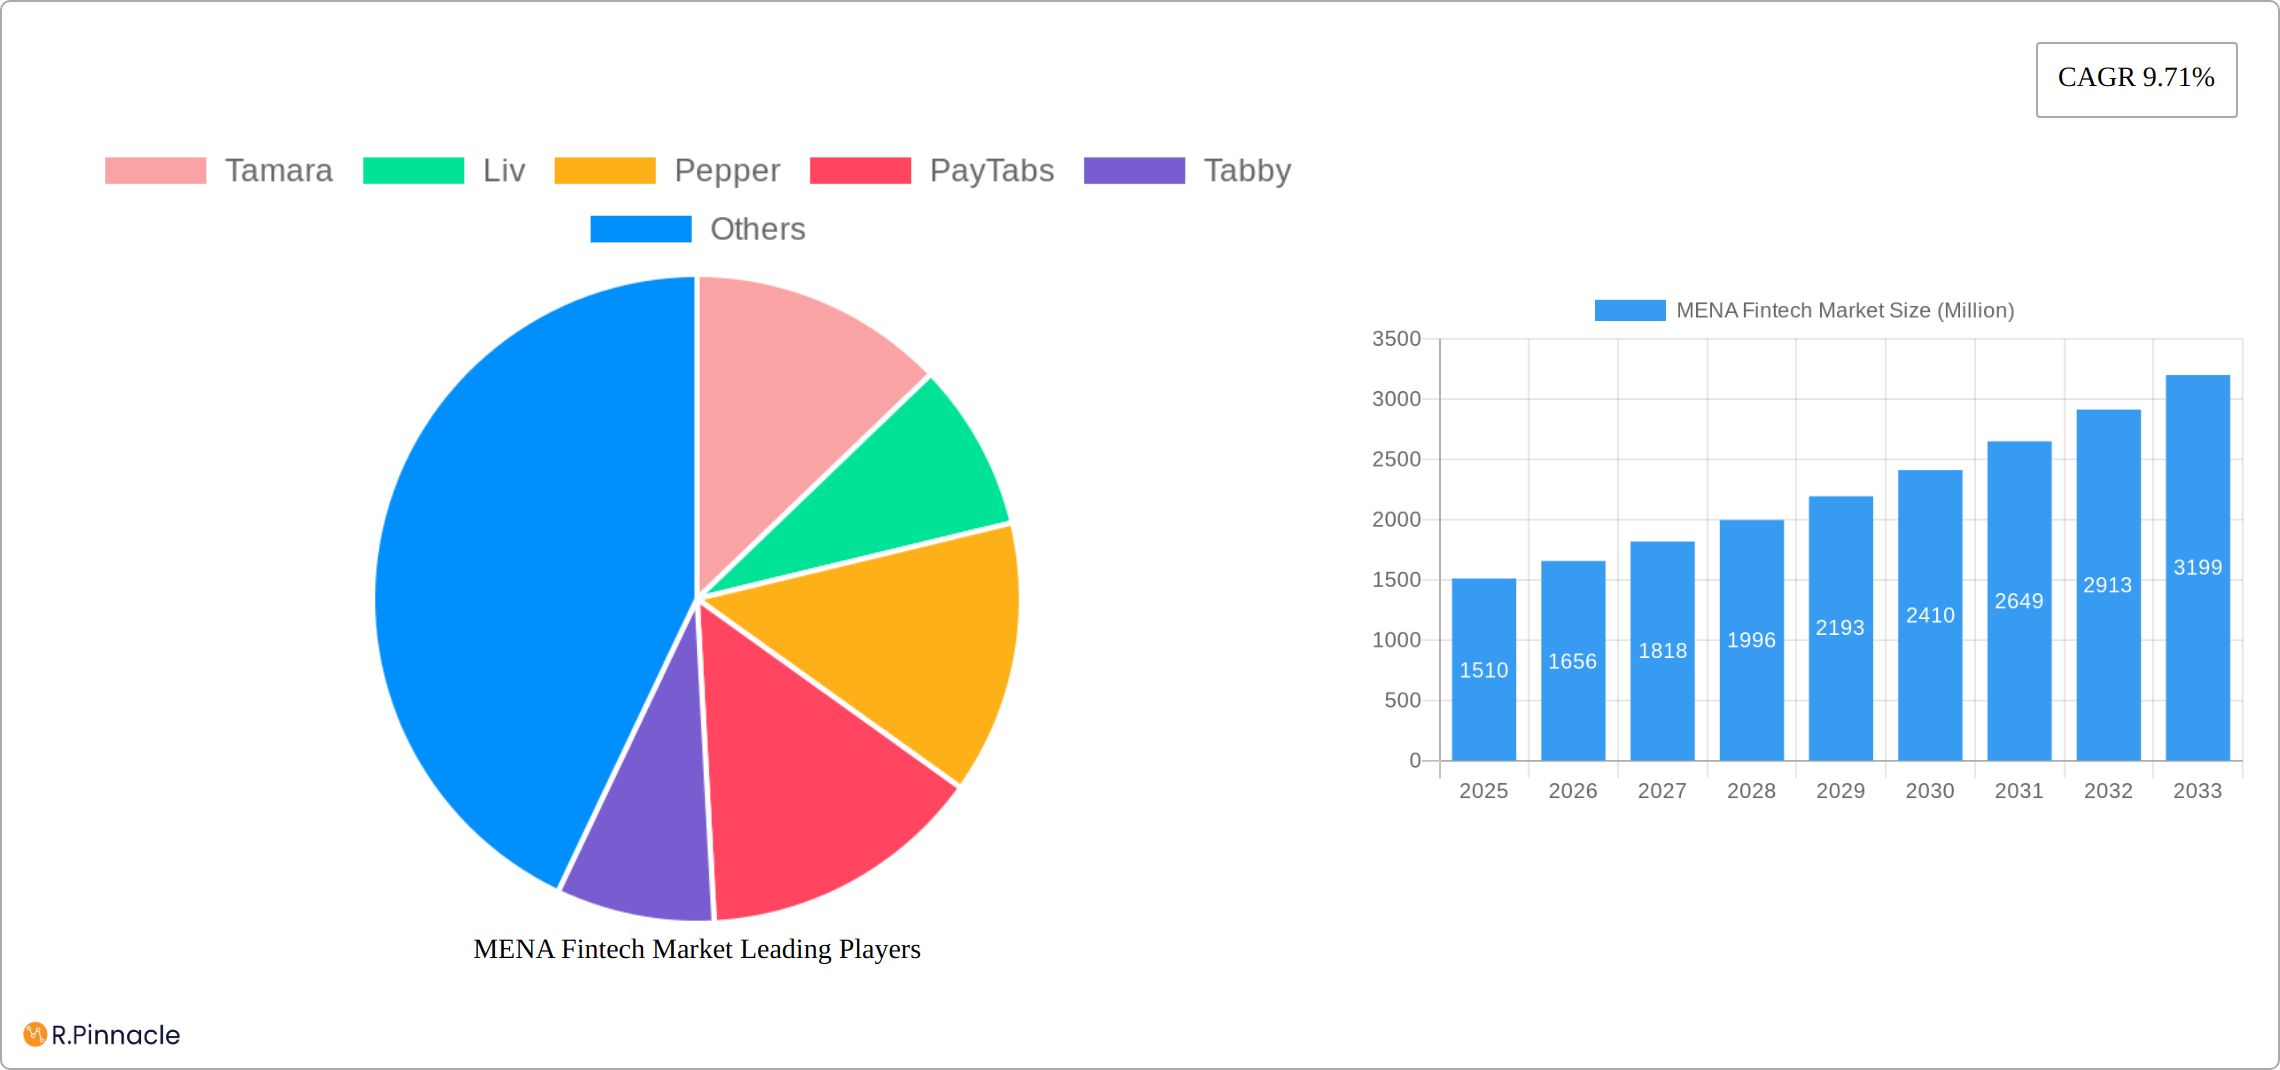
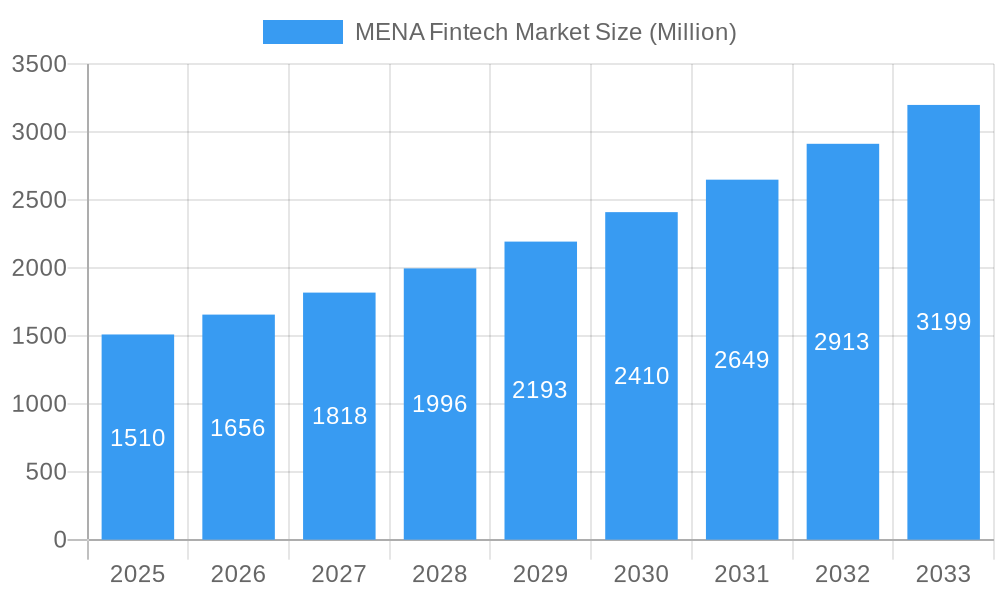
The MENA (Middle East and North Africa) Fintech market is experiencing robust growth, projected to reach a market size of $1.51 billion in 2025, exhibiting a Compound Annual Growth Rate (CAGR) of 9.71% from 2019 to 2033. This expansion is fueled by several key drivers. Increasing smartphone penetration and internet access across the region are creating a fertile ground for digital financial services. A young and tech-savvy population readily embraces innovative payment solutions and investment platforms. Furthermore, supportive government initiatives promoting digital transformation and financial inclusion are accelerating market adoption. The rise of e-commerce and the need for efficient cross-border payments further contribute to the market's growth trajectory. While challenges such as regulatory hurdles and cybersecurity concerns exist, the overall market outlook remains positive. The market is segmented by various service types, including payment gateways, digital lending, and investment platforms, each experiencing significant growth. Leading players such as Tamara, Liv, Pepper, PayTabs, Tabby, Sarwa, Ila Bank, Bayzat, Eureeca, and Cwallet are actively shaping the competitive landscape, constantly innovating to cater to evolving consumer needs. Competition is expected to intensify, driving further innovation and efficiency within the sector.
MENA Fintech Market Market Size (In Billion)
Looking forward to 2033, the MENA Fintech market is poised for continued expansion, driven by sustained economic growth, technological advancements, and increasing financial inclusion efforts. The market's evolution will likely involve further diversification of services, increased integration with existing financial infrastructure, and a greater focus on enhancing user experience and security. The region's unique demographic and economic characteristics will continue to present both opportunities and challenges for Fintech companies operating within this dynamic landscape. Further penetration into underserved segments and the development of tailored financial products will be crucial for sustained growth and success in this rapidly evolving market.
MENA Fintech Market Company Market Share
MENA Fintech Market: A Comprehensive Report (2019-2033)
This in-depth report provides a comprehensive analysis of the MENA Fintech market, offering invaluable insights for industry professionals, investors, and strategic decision-makers. With a study period spanning 2019-2033, a base year of 2025, and a forecast period of 2025-2033, this report unveils the market's current state and future trajectory. The report leverages key performance indicators, including CAGR and market penetration rates, to provide a granular view of market dynamics and growth opportunities within the burgeoning MENA Fintech landscape. The total market size in 2025 is estimated at xx Million.
MENA Fintech Market Structure & Innovation Trends
This section analyzes the MENA Fintech market's structure, highlighting key trends shaping its evolution. We examine market concentration, identifying dominant players and their market share. Innovation drivers, including technological advancements and regulatory changes, are explored, along with an analysis of product substitutes and their impact. The report further delves into end-user demographics, revealing key consumer segments driving market growth. Finally, we analyze M&A activities, including deal values and their implications for market consolidation.
- Market Concentration: The market is characterized by a mix of established players and emerging startups, with a relatively high level of competition. Market share data for key players like PayTabs, Tamara, and Tabby will be presented.
- Innovation Drivers: Technological advancements such as AI, blockchain, and mobile payments are driving innovation. Regulatory frameworks, including those promoting open banking and digital finance, also play a crucial role.
- M&A Activity: The report details recent mergers and acquisitions, providing insights into deal values and strategic implications for market consolidation. For example, the xx Million deal between [Company A] and [Company B] is analyzed for its impact on market dynamics.
MENA Fintech Market Dynamics & Trends
This section explores the key dynamics and trends shaping the MENA Fintech market’s growth. We analyze market growth drivers, including increasing smartphone penetration, rising internet usage, and the expanding e-commerce sector. Technological disruptions, such as the rise of mobile payments and digital lending platforms, are examined. We also analyze evolving consumer preferences, highlighting the demand for convenience, security, and personalized financial services. Finally, we analyze competitive dynamics, examining the strategies employed by key players to gain market share.
- CAGR: The MENA Fintech market is projected to experience a CAGR of xx% during the forecast period (2025-2033).
- Market Penetration: Mobile payment penetration is expected to reach xx% by 2033, while digital lending penetration is projected at xx%.
Dominant Regions & Segments in MENA Fintech Market
This section identifies the leading regions and segments within the MENA Fintech market. We conduct a detailed dominance analysis, examining key drivers of growth in each region and segment. Factors such as economic policies, infrastructure development, and regulatory frameworks are considered.
- Leading Region/Country: The UAE and Saudi Arabia are expected to remain the dominant markets due to [Reasons explained in detail in the report].
- Key Drivers: [Specific bullet points outlining the economic policies, infrastructure development, and regulatory frameworks driving growth in each dominant segment].
MENA Fintech Market Product Innovations
The MENA Fintech landscape is experiencing a surge of innovative product developments, reshaping the financial services sector. Recent advancements showcase a strong focus on addressing the region's unique needs and leveraging technological breakthroughs. Buy Now, Pay Later (BNPL) services, for instance, have witnessed explosive growth, catering to the increasing demand for flexible payment options. Simultaneously, the integration of Artificial Intelligence (AI) is revolutionizing areas such as fraud detection, personalized financial advice, and automated customer service, enhancing efficiency and security. This innovative wave is fueled by the region's young and tech-savvy population, coupled with supportive regulatory frameworks that encourage fintech adoption. Key aspects driving innovation include the development of robust mobile payment platforms, the expansion of open banking initiatives, and the incorporation of blockchain technology for enhanced security and transparency. The market's response to these innovations is overwhelmingly positive, with high adoption rates and a continuous influx of new players vying for market share.
Report Scope & Segmentation Analysis
This report segments the MENA Fintech market based on [Specific segmentation criteria, e.g., product type, service type, geography]. Each segment's growth projections, market size, and competitive dynamics are detailed.
Key Drivers of MENA Fintech Market Growth
Several factors are driving the growth of the MENA Fintech market. These include the increasing adoption of mobile technology, supportive government policies promoting financial inclusion, and the expanding e-commerce sector. Furthermore, the region's young and tech-savvy population is fueling innovation and adoption of new fintech solutions.
Challenges in the MENA Fintech Market Sector
Despite significant growth potential, the MENA Fintech market faces challenges such as regulatory uncertainty, cybersecurity risks, and limited financial literacy among certain demographics. These factors can hinder market expansion and adoption of new fintech solutions.
Emerging Opportunities in MENA Fintech Market
The MENA Fintech market is brimming with untapped potential. The region's burgeoning digital economy, characterized by a rapidly expanding e-commerce sector and a young, digitally engaged population, presents a fertile ground for fintech growth. Specific opportunities include: serving the vast underbanked population, providing accessible and affordable financial services to previously excluded segments; capitalizing on the growth of the sharing economy, by developing innovative financial solutions for gig workers and platform businesses; facilitating cross-border payments and remittances, streamlining international transactions and reducing costs; and leveraging the increasing adoption of mobile payments, creating convenient and secure digital payment ecosystems. Moreover, the supportive government initiatives and regulatory reforms across various MENA countries are further accelerating the pace of fintech development and attracting significant foreign investments.
Leading Players in the MENA Fintech Market Market
- Tamara
- Liv
- Pepper
- PayTabs
- Tabby
- Sarwa
- Ila Bank
- Bayzat
- Eureeca
- Cwallet
Key Developments in MENA Fintech Market Industry
- February 2024: PayTabs Egypt partnered with Souhoola, expanding BNPL options.
- February 2024: PayTabs Group partnered with Nearpay, enhancing soft POS payment experiences across Jordan and other markets.
- January 2024: Valu partnered with Bosta, enabling shipment payments through the Valu app in Egypt.
- March 2023: CoreLogic and Pepper Money extended their strategic agreement.
Future Outlook for MENA Fintech Market Market
The MENA Fintech market is poised for significant growth, driven by increasing smartphone penetration, rising internet usage, and favorable government policies. Strategic partnerships, technological advancements, and the expanding e-commerce sector will further fuel market expansion, creating significant opportunities for both established players and emerging startups.
MENA Fintech Market Segmentation
-
1. Service proposition
- 1.1. Money Transfer and Payments
- 1.2. Savings and Investments
- 1.3. Digital Lending & Lending Marketplaces
- 1.4. Online Insurance & Insurance Marketplaces
- 1.5. Other Service Propositions
MENA Fintech Market Segmentation By Geography
-
1. North America
- 1.1. United States
- 1.2. Canada
- 1.3. Mexico
-
2. South America
- 2.1. Brazil
- 2.2. Argentina
- 2.3. Rest of South America
-
3. Europe
- 3.1. United Kingdom
- 3.2. Germany
- 3.3. France
- 3.4. Italy
- 3.5. Spain
- 3.6. Russia
- 3.7. Benelux
- 3.8. Nordics
- 3.9. Rest of Europe
-
4. Middle East & Africa
- 4.1. Turkey
- 4.2. Israel
- 4.3. GCC
- 4.4. North Africa
- 4.5. South Africa
- 4.6. Rest of Middle East & Africa
-
5. Asia Pacific
- 5.1. China
- 5.2. India
- 5.3. Japan
- 5.4. South Korea
- 5.5. ASEAN
- 5.6. Oceania
- 5.7. Rest of Asia Pacific
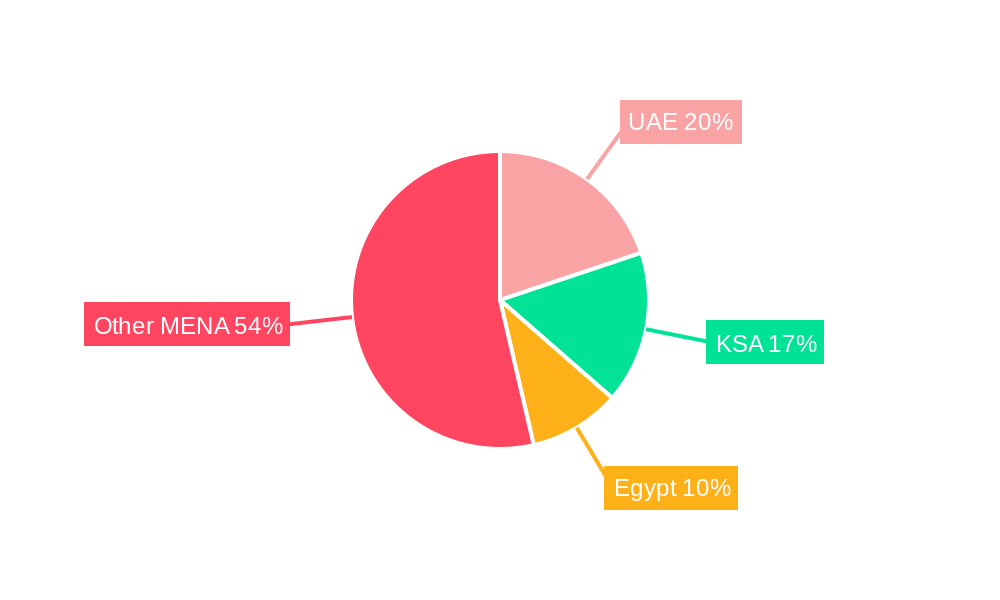
MENA Fintech Market Regional Market Share
Geographic Coverage of MENA Fintech Market
MENA Fintech Market REPORT HIGHLIGHTS
| Aspects | Details |
|---|---|
| Study Period | 2020-2034 |
| Base Year | 2025 |
| Estimated Year | 2026 |
| Forecast Period | 2026-2034 |
| Historical Period | 2020-2025 |
| Growth Rate | CAGR of 9.71% from 2020-2034 |
| Segmentation |
|
Table of Contents
- 1. Introduction
- 1.1. Research Scope
- 1.2. Market Segmentation
- 1.3. Research Objective
- 1.4. Definitions and Assumptions
- 2. Executive Summary
- 2.1. Market Snapshot
- 3. Market Dynamics
- 3.1. Market Drivers
- 3.2. Market Restrains
- 3.3. Market Trends
- 3.4. Market Opportunities
- 4. Market Factor Analysis
- 4.1. Porters Five Forces
- 4.1.1. Bargaining Power of Suppliers
- 4.1.2. Bargaining Power of Buyers
- 4.1.3. Threat of New Entrants
- 4.1.4. Threat of Substitutes
- 4.1.5. Competitive Rivalry
- 4.2. PESTEL analysis
- 4.3. BCG Analysis
- 4.3.1. Stars (High Growth, High Market Share)
- 4.3.2. Cash Cows (Low Growth, High Market Share)
- 4.3.3. Question Mark (High Growth, Low Market Share)
- 4.3.4. Dogs (Low Growth, Low Market Share)
- 4.4. Ansoff Matrix Analysis
- 4.5. Supply Chain Analysis
- 4.6. Regulatory Landscape
- 4.7. Current Market Potential and Opportunity Assessment (TAM–SAM–SOM Framework)
- 4.8. PRI Analyst Note
- 4.1. Porters Five Forces
- 5. Market Analysis, Insights and Forecast 2021-2033
- 5.1. Market Analysis, Insights and Forecast - by Service proposition
- 5.1.1. Money Transfer and Payments
- 5.1.2. Savings and Investments
- 5.1.3. Digital Lending & Lending Marketplaces
- 5.1.4. Online Insurance & Insurance Marketplaces
- 5.1.5. Other Service Propositions
- 5.2. Market Analysis, Insights and Forecast - by Region
- 5.2.1. North America
- 5.2.2. South America
- 5.2.3. Europe
- 5.2.4. Middle East & Africa
- 5.2.5. Asia Pacific
- 5.1. Market Analysis, Insights and Forecast - by Service proposition
- 6. Global MENA Fintech Market Analysis, Insights and Forecast, 2021-2033
- 6.1. Market Analysis, Insights and Forecast - by Service proposition
- 6.1.1. Money Transfer and Payments
- 6.1.2. Savings and Investments
- 6.1.3. Digital Lending & Lending Marketplaces
- 6.1.4. Online Insurance & Insurance Marketplaces
- 6.1.5. Other Service Propositions
- 6.1. Market Analysis, Insights and Forecast - by Service proposition
- 7. North America MENA Fintech Market Analysis, Insights and Forecast, 2020-2032
- 7.1. Market Analysis, Insights and Forecast - by Service proposition
- 7.1.1. Money Transfer and Payments
- 7.1.2. Savings and Investments
- 7.1.3. Digital Lending & Lending Marketplaces
- 7.1.4. Online Insurance & Insurance Marketplaces
- 7.1.5. Other Service Propositions
- 7.1. Market Analysis, Insights and Forecast - by Service proposition
- 8. South America MENA Fintech Market Analysis, Insights and Forecast, 2020-2032
- 8.1. Market Analysis, Insights and Forecast - by Service proposition
- 8.1.1. Money Transfer and Payments
- 8.1.2. Savings and Investments
- 8.1.3. Digital Lending & Lending Marketplaces
- 8.1.4. Online Insurance & Insurance Marketplaces
- 8.1.5. Other Service Propositions
- 8.1. Market Analysis, Insights and Forecast - by Service proposition
- 9. Europe MENA Fintech Market Analysis, Insights and Forecast, 2020-2032
- 9.1. Market Analysis, Insights and Forecast - by Service proposition
- 9.1.1. Money Transfer and Payments
- 9.1.2. Savings and Investments
- 9.1.3. Digital Lending & Lending Marketplaces
- 9.1.4. Online Insurance & Insurance Marketplaces
- 9.1.5. Other Service Propositions
- 9.1. Market Analysis, Insights and Forecast - by Service proposition
- 10. Middle East & Africa MENA Fintech Market Analysis, Insights and Forecast, 2020-2032
- 10.1. Market Analysis, Insights and Forecast - by Service proposition
- 10.1.1. Money Transfer and Payments
- 10.1.2. Savings and Investments
- 10.1.3. Digital Lending & Lending Marketplaces
- 10.1.4. Online Insurance & Insurance Marketplaces
- 10.1.5. Other Service Propositions
- 10.1. Market Analysis, Insights and Forecast - by Service proposition
- 11. Asia Pacific MENA Fintech Market Analysis, Insights and Forecast, 2020-2032
- 11.1. Market Analysis, Insights and Forecast - by Service proposition
- 11.1.1. Money Transfer and Payments
- 11.1.2. Savings and Investments
- 11.1.3. Digital Lending & Lending Marketplaces
- 11.1.4. Online Insurance & Insurance Marketplaces
- 11.1.5. Other Service Propositions
- 11.1. Market Analysis, Insights and Forecast - by Service proposition
- 12. Competitive Analysis
- 12.1. Company Profiles
- 12.1.1 Tamara
- 12.1.1.1. Company Overview
- 12.1.1.2. Products
- 12.1.1.3. Company Financials
- 12.1.1.4. SWOT Analysis
- 12.1.2 Liv
- 12.1.2.1. Company Overview
- 12.1.2.2. Products
- 12.1.2.3. Company Financials
- 12.1.2.4. SWOT Analysis
- 12.1.3 Pepper
- 12.1.3.1. Company Overview
- 12.1.3.2. Products
- 12.1.3.3. Company Financials
- 12.1.3.4. SWOT Analysis
- 12.1.4 PayTabs
- 12.1.4.1. Company Overview
- 12.1.4.2. Products
- 12.1.4.3. Company Financials
- 12.1.4.4. SWOT Analysis
- 12.1.5 Tabby
- 12.1.5.1. Company Overview
- 12.1.5.2. Products
- 12.1.5.3. Company Financials
- 12.1.5.4. SWOT Analysis
- 12.1.6 Sarwa
- 12.1.6.1. Company Overview
- 12.1.6.2. Products
- 12.1.6.3. Company Financials
- 12.1.6.4. SWOT Analysis
- 12.1.7 Ila Bank
- 12.1.7.1. Company Overview
- 12.1.7.2. Products
- 12.1.7.3. Company Financials
- 12.1.7.4. SWOT Analysis
- 12.1.8 Bayzat
- 12.1.8.1. Company Overview
- 12.1.8.2. Products
- 12.1.8.3. Company Financials
- 12.1.8.4. SWOT Analysis
- 12.1.9 Eureeca
- 12.1.9.1. Company Overview
- 12.1.9.2. Products
- 12.1.9.3. Company Financials
- 12.1.9.4. SWOT Analysis
- 12.1.10 Cwallet**List Not Exhaustive
- 12.1.10.1. Company Overview
- 12.1.10.2. Products
- 12.1.10.3. Company Financials
- 12.1.10.4. SWOT Analysis
- 12.1.1 Tamara
- 12.2. Market Entropy
- 12.2.1 Company's Key Areas Served
- 12.2.2 Recent Developments
- 12.3. Company Market Share Analysis 2025
- 12.3.1 Top 5 Companies Market Share Analysis
- 12.3.2 Top 3 Companies Market Share Analysis
- 12.4. List of Potential Customers
- 13. Research Methodology
List of Figures
- Figure 1: Global MENA Fintech Market Revenue Breakdown (Million, %) by Region 2025 & 2033
- Figure 2: Global MENA Fintech Market Volume Breakdown (Billion, %) by Region 2025 & 2033
- Figure 3: North America MENA Fintech Market Revenue (Million), by Service proposition 2025 & 2033
- Figure 4: North America MENA Fintech Market Volume (Billion), by Service proposition 2025 & 2033
- Figure 5: North America MENA Fintech Market Revenue Share (%), by Service proposition 2025 & 2033
- Figure 6: North America MENA Fintech Market Volume Share (%), by Service proposition 2025 & 2033
- Figure 7: North America MENA Fintech Market Revenue (Million), by Country 2025 & 2033
- Figure 8: North America MENA Fintech Market Volume (Billion), by Country 2025 & 2033
- Figure 9: North America MENA Fintech Market Revenue Share (%), by Country 2025 & 2033
- Figure 10: North America MENA Fintech Market Volume Share (%), by Country 2025 & 2033
- Figure 11: South America MENA Fintech Market Revenue (Million), by Service proposition 2025 & 2033
- Figure 12: South America MENA Fintech Market Volume (Billion), by Service proposition 2025 & 2033
- Figure 13: South America MENA Fintech Market Revenue Share (%), by Service proposition 2025 & 2033
- Figure 14: South America MENA Fintech Market Volume Share (%), by Service proposition 2025 & 2033
- Figure 15: South America MENA Fintech Market Revenue (Million), by Country 2025 & 2033
- Figure 16: South America MENA Fintech Market Volume (Billion), by Country 2025 & 2033
- Figure 17: South America MENA Fintech Market Revenue Share (%), by Country 2025 & 2033
- Figure 18: South America MENA Fintech Market Volume Share (%), by Country 2025 & 2033
- Figure 19: Europe MENA Fintech Market Revenue (Million), by Service proposition 2025 & 2033
- Figure 20: Europe MENA Fintech Market Volume (Billion), by Service proposition 2025 & 2033
- Figure 21: Europe MENA Fintech Market Revenue Share (%), by Service proposition 2025 & 2033
- Figure 22: Europe MENA Fintech Market Volume Share (%), by Service proposition 2025 & 2033
- Figure 23: Europe MENA Fintech Market Revenue (Million), by Country 2025 & 2033
- Figure 24: Europe MENA Fintech Market Volume (Billion), by Country 2025 & 2033
- Figure 25: Europe MENA Fintech Market Revenue Share (%), by Country 2025 & 2033
- Figure 26: Europe MENA Fintech Market Volume Share (%), by Country 2025 & 2033
- Figure 27: Middle East & Africa MENA Fintech Market Revenue (Million), by Service proposition 2025 & 2033
- Figure 28: Middle East & Africa MENA Fintech Market Volume (Billion), by Service proposition 2025 & 2033
- Figure 29: Middle East & Africa MENA Fintech Market Revenue Share (%), by Service proposition 2025 & 2033
- Figure 30: Middle East & Africa MENA Fintech Market Volume Share (%), by Service proposition 2025 & 2033
- Figure 31: Middle East & Africa MENA Fintech Market Revenue (Million), by Country 2025 & 2033
- Figure 32: Middle East & Africa MENA Fintech Market Volume (Billion), by Country 2025 & 2033
- Figure 33: Middle East & Africa MENA Fintech Market Revenue Share (%), by Country 2025 & 2033
- Figure 34: Middle East & Africa MENA Fintech Market Volume Share (%), by Country 2025 & 2033
- Figure 35: Asia Pacific MENA Fintech Market Revenue (Million), by Service proposition 2025 & 2033
- Figure 36: Asia Pacific MENA Fintech Market Volume (Billion), by Service proposition 2025 & 2033
- Figure 37: Asia Pacific MENA Fintech Market Revenue Share (%), by Service proposition 2025 & 2033
- Figure 38: Asia Pacific MENA Fintech Market Volume Share (%), by Service proposition 2025 & 2033
- Figure 39: Asia Pacific MENA Fintech Market Revenue (Million), by Country 2025 & 2033
- Figure 40: Asia Pacific MENA Fintech Market Volume (Billion), by Country 2025 & 2033
- Figure 41: Asia Pacific MENA Fintech Market Revenue Share (%), by Country 2025 & 2033
- Figure 42: Asia Pacific MENA Fintech Market Volume Share (%), by Country 2025 & 2033
List of Tables
- Table 1: Global MENA Fintech Market Revenue Million Forecast, by Service proposition 2020 & 2033
- Table 2: Global MENA Fintech Market Volume Billion Forecast, by Service proposition 2020 & 2033
- Table 3: Global MENA Fintech Market Revenue Million Forecast, by Region 2020 & 2033
- Table 4: Global MENA Fintech Market Volume Billion Forecast, by Region 2020 & 2033
- Table 5: Global MENA Fintech Market Revenue Million Forecast, by Service proposition 2020 & 2033
- Table 6: Global MENA Fintech Market Volume Billion Forecast, by Service proposition 2020 & 2033
- Table 7: Global MENA Fintech Market Revenue Million Forecast, by Country 2020 & 2033
- Table 8: Global MENA Fintech Market Volume Billion Forecast, by Country 2020 & 2033
- Table 9: United States MENA Fintech Market Revenue (Million) Forecast, by Application 2020 & 2033
- Table 10: United States MENA Fintech Market Volume (Billion) Forecast, by Application 2020 & 2033
- Table 11: Canada MENA Fintech Market Revenue (Million) Forecast, by Application 2020 & 2033
- Table 12: Canada MENA Fintech Market Volume (Billion) Forecast, by Application 2020 & 2033
- Table 13: Mexico MENA Fintech Market Revenue (Million) Forecast, by Application 2020 & 2033
- Table 14: Mexico MENA Fintech Market Volume (Billion) Forecast, by Application 2020 & 2033
- Table 15: Global MENA Fintech Market Revenue Million Forecast, by Service proposition 2020 & 2033
- Table 16: Global MENA Fintech Market Volume Billion Forecast, by Service proposition 2020 & 2033
- Table 17: Global MENA Fintech Market Revenue Million Forecast, by Country 2020 & 2033
- Table 18: Global MENA Fintech Market Volume Billion Forecast, by Country 2020 & 2033
- Table 19: Brazil MENA Fintech Market Revenue (Million) Forecast, by Application 2020 & 2033
- Table 20: Brazil MENA Fintech Market Volume (Billion) Forecast, by Application 2020 & 2033
- Table 21: Argentina MENA Fintech Market Revenue (Million) Forecast, by Application 2020 & 2033
- Table 22: Argentina MENA Fintech Market Volume (Billion) Forecast, by Application 2020 & 2033
- Table 23: Rest of South America MENA Fintech Market Revenue (Million) Forecast, by Application 2020 & 2033
- Table 24: Rest of South America MENA Fintech Market Volume (Billion) Forecast, by Application 2020 & 2033
- Table 25: Global MENA Fintech Market Revenue Million Forecast, by Service proposition 2020 & 2033
- Table 26: Global MENA Fintech Market Volume Billion Forecast, by Service proposition 2020 & 2033
- Table 27: Global MENA Fintech Market Revenue Million Forecast, by Country 2020 & 2033
- Table 28: Global MENA Fintech Market Volume Billion Forecast, by Country 2020 & 2033
- Table 29: United Kingdom MENA Fintech Market Revenue (Million) Forecast, by Application 2020 & 2033
- Table 30: United Kingdom MENA Fintech Market Volume (Billion) Forecast, by Application 2020 & 2033
- Table 31: Germany MENA Fintech Market Revenue (Million) Forecast, by Application 2020 & 2033
- Table 32: Germany MENA Fintech Market Volume (Billion) Forecast, by Application 2020 & 2033
- Table 33: France MENA Fintech Market Revenue (Million) Forecast, by Application 2020 & 2033
- Table 34: France MENA Fintech Market Volume (Billion) Forecast, by Application 2020 & 2033
- Table 35: Italy MENA Fintech Market Revenue (Million) Forecast, by Application 2020 & 2033
- Table 36: Italy MENA Fintech Market Volume (Billion) Forecast, by Application 2020 & 2033
- Table 37: Spain MENA Fintech Market Revenue (Million) Forecast, by Application 2020 & 2033
- Table 38: Spain MENA Fintech Market Volume (Billion) Forecast, by Application 2020 & 2033
- Table 39: Russia MENA Fintech Market Revenue (Million) Forecast, by Application 2020 & 2033
- Table 40: Russia MENA Fintech Market Volume (Billion) Forecast, by Application 2020 & 2033
- Table 41: Benelux MENA Fintech Market Revenue (Million) Forecast, by Application 2020 & 2033
- Table 42: Benelux MENA Fintech Market Volume (Billion) Forecast, by Application 2020 & 2033
- Table 43: Nordics MENA Fintech Market Revenue (Million) Forecast, by Application 2020 & 2033
- Table 44: Nordics MENA Fintech Market Volume (Billion) Forecast, by Application 2020 & 2033
- Table 45: Rest of Europe MENA Fintech Market Revenue (Million) Forecast, by Application 2020 & 2033
- Table 46: Rest of Europe MENA Fintech Market Volume (Billion) Forecast, by Application 2020 & 2033
- Table 47: Global MENA Fintech Market Revenue Million Forecast, by Service proposition 2020 & 2033
- Table 48: Global MENA Fintech Market Volume Billion Forecast, by Service proposition 2020 & 2033
- Table 49: Global MENA Fintech Market Revenue Million Forecast, by Country 2020 & 2033
- Table 50: Global MENA Fintech Market Volume Billion Forecast, by Country 2020 & 2033
- Table 51: Turkey MENA Fintech Market Revenue (Million) Forecast, by Application 2020 & 2033
- Table 52: Turkey MENA Fintech Market Volume (Billion) Forecast, by Application 2020 & 2033
- Table 53: Israel MENA Fintech Market Revenue (Million) Forecast, by Application 2020 & 2033
- Table 54: Israel MENA Fintech Market Volume (Billion) Forecast, by Application 2020 & 2033
- Table 55: GCC MENA Fintech Market Revenue (Million) Forecast, by Application 2020 & 2033
- Table 56: GCC MENA Fintech Market Volume (Billion) Forecast, by Application 2020 & 2033
- Table 57: North Africa MENA Fintech Market Revenue (Million) Forecast, by Application 2020 & 2033
- Table 58: North Africa MENA Fintech Market Volume (Billion) Forecast, by Application 2020 & 2033
- Table 59: South Africa MENA Fintech Market Revenue (Million) Forecast, by Application 2020 & 2033
- Table 60: South Africa MENA Fintech Market Volume (Billion) Forecast, by Application 2020 & 2033
- Table 61: Rest of Middle East & Africa MENA Fintech Market Revenue (Million) Forecast, by Application 2020 & 2033
- Table 62: Rest of Middle East & Africa MENA Fintech Market Volume (Billion) Forecast, by Application 2020 & 2033
- Table 63: Global MENA Fintech Market Revenue Million Forecast, by Service proposition 2020 & 2033
- Table 64: Global MENA Fintech Market Volume Billion Forecast, by Service proposition 2020 & 2033
- Table 65: Global MENA Fintech Market Revenue Million Forecast, by Country 2020 & 2033
- Table 66: Global MENA Fintech Market Volume Billion Forecast, by Country 2020 & 2033
- Table 67: China MENA Fintech Market Revenue (Million) Forecast, by Application 2020 & 2033
- Table 68: China MENA Fintech Market Volume (Billion) Forecast, by Application 2020 & 2033
- Table 69: India MENA Fintech Market Revenue (Million) Forecast, by Application 2020 & 2033
- Table 70: India MENA Fintech Market Volume (Billion) Forecast, by Application 2020 & 2033
- Table 71: Japan MENA Fintech Market Revenue (Million) Forecast, by Application 2020 & 2033
- Table 72: Japan MENA Fintech Market Volume (Billion) Forecast, by Application 2020 & 2033
- Table 73: South Korea MENA Fintech Market Revenue (Million) Forecast, by Application 2020 & 2033
- Table 74: South Korea MENA Fintech Market Volume (Billion) Forecast, by Application 2020 & 2033
- Table 75: ASEAN MENA Fintech Market Revenue (Million) Forecast, by Application 2020 & 2033
- Table 76: ASEAN MENA Fintech Market Volume (Billion) Forecast, by Application 2020 & 2033
- Table 77: Oceania MENA Fintech Market Revenue (Million) Forecast, by Application 2020 & 2033
- Table 78: Oceania MENA Fintech Market Volume (Billion) Forecast, by Application 2020 & 2033
- Table 79: Rest of Asia Pacific MENA Fintech Market Revenue (Million) Forecast, by Application 2020 & 2033
- Table 80: Rest of Asia Pacific MENA Fintech Market Volume (Billion) Forecast, by Application 2020 & 2033
Frequently Asked Questions
1. What is the projected Compound Annual Growth Rate (CAGR) of the MENA Fintech Market?
The projected CAGR is approximately 9.71%.
2. Which companies are prominent players in the MENA Fintech Market?
Key companies in the market include Tamara, Liv, Pepper, PayTabs, Tabby, Sarwa, Ila Bank, Bayzat, Eureeca, Cwallet**List Not Exhaustive.
3. What are the main segments of the MENA Fintech Market?
The market segments include Service proposition.
4. Can you provide details about the market size?
The market size is estimated to be USD 1.51 Million as of 2022.
5. What are some drivers contributing to market growth?
Customers' Growing Need for E-Commerce and Mobile Banking Platforms; Rising Internet Penetration & Adoption of Smartphones will Continue to Lead the Growth of the Market.
6. What are the notable trends driving market growth?
Rising Digital & Cashless Payments is Driving the Growth of The Market.
7. Are there any restraints impacting market growth?
Customers' Growing Need for E-Commerce and Mobile Banking Platforms; Rising Internet Penetration & Adoption of Smartphones will Continue to Lead the Growth of the Market.
8. Can you provide examples of recent developments in the market?
In February 2024, MeasA’s (MEASA) award-winning payments leader, PayTabs, Egypt, announced a strategic partnership with Egypt’s leading BNPL platform, Souhoola. This new BNPL platform will provide merchants with a new way to pay, expanding the variety of online payment options PayTabs Egypt offers.
9. What pricing options are available for accessing the report?
Pricing options include single-user, multi-user, and enterprise licenses priced at USD 3800, USD 4500, and USD 5800 respectively.
10. Is the market size provided in terms of value or volume?
The market size is provided in terms of value, measured in Million and volume, measured in Billion.
11. Are there any specific market keywords associated with the report?
Yes, the market keyword associated with the report is "MENA Fintech Market," which aids in identifying and referencing the specific market segment covered.
12. How do I determine which pricing option suits my needs best?
The pricing options vary based on user requirements and access needs. Individual users may opt for single-user licenses, while businesses requiring broader access may choose multi-user or enterprise licenses for cost-effective access to the report.
13. Are there any additional resources or data provided in the MENA Fintech Market report?
While the report offers comprehensive insights, it's advisable to review the specific contents or supplementary materials provided to ascertain if additional resources or data are available.
14. How can I stay updated on further developments or reports in the MENA Fintech Market?
To stay informed about further developments, trends, and reports in the MENA Fintech Market, consider subscribing to industry newsletters, following relevant companies and organizations, or regularly checking reputable industry news sources and publications.
Methodology
Step 1 - Identification of Relevant Samples Size from Population Database


Step 2 - Approaches for Defining Global Market Size (Value, Volume* & Price*)

Note*: In applicable scenarios
Step 3 - Data Sources
Primary Research
- Web Analytics
- Survey Reports
- Research Institute
- Latest Research Reports
- Opinion Leaders
Secondary Research
- Annual Reports
- White Paper
- Latest Press Release
- Industry Association
- Paid Database
- Investor Presentations

Step 4 - Data Triangulation
Involves using different sources of information in order to increase the validity of a study
These sources are likely to be stakeholders in a program - participants, other researchers, program staff, other community members, and so on.
Then we put all data in single framework & apply various statistical tools to find out the dynamic on the market.
During the analysis stage, feedback from the stakeholder groups would be compared to determine areas of agreement as well as areas of divergence