

Key Insights
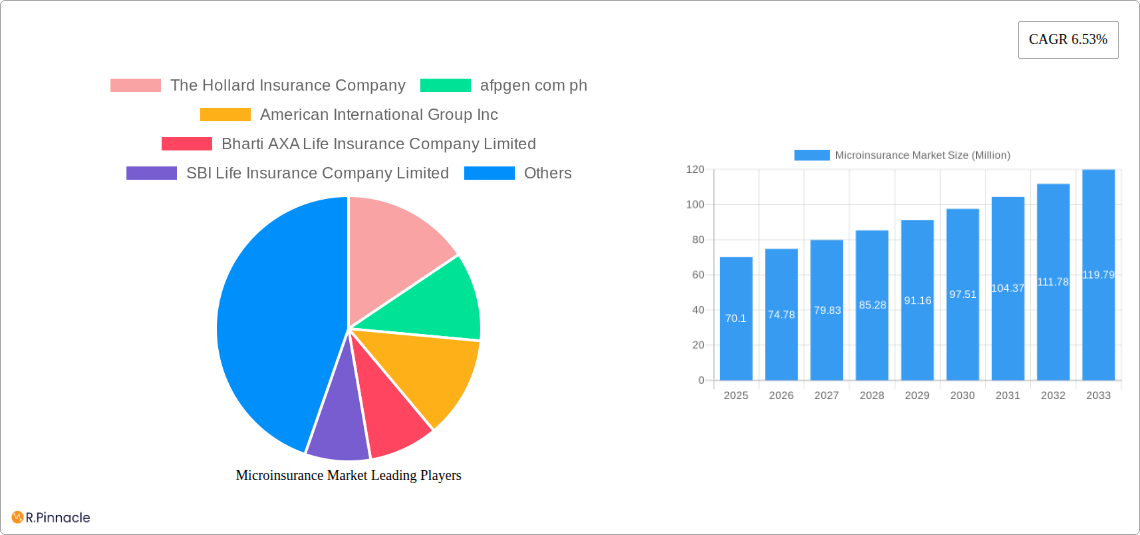
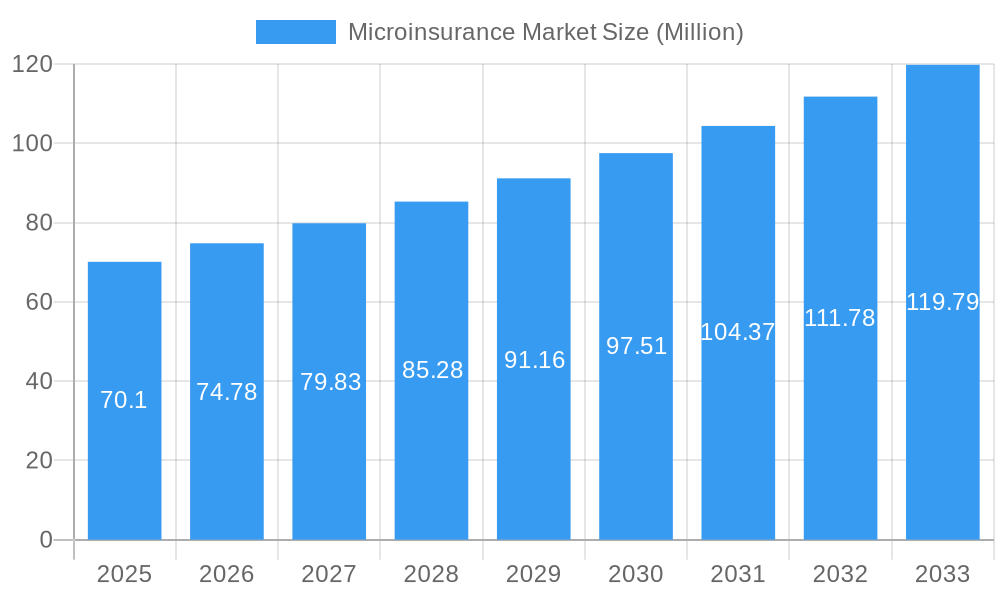
The microinsurance market, valued at $70.10 million in 2025, is projected to experience robust growth, driven by increasing mobile penetration, financial inclusion initiatives in developing economies, and a rising awareness of the need for affordable risk protection. The 6.53% CAGR indicates a substantial market expansion over the forecast period (2025-2033). Key growth drivers include government regulations promoting microinsurance, the emergence of innovative distribution channels (e.g., mobile platforms and partnerships with microfinance institutions), and the growing demand for affordable health and life insurance among low-income populations. While challenges remain, such as low insurance literacy and trust issues in certain regions, the market is expected to overcome these hurdles through targeted educational campaigns and the development of trust-building strategies. The competitive landscape is characterized by a mix of established global insurers like Allianz SE and AIG, alongside regional players and specialized microinsurance providers. This dynamic mix fosters innovation and competition, ultimately benefiting consumers.
Microinsurance Market Market Size (In Million)
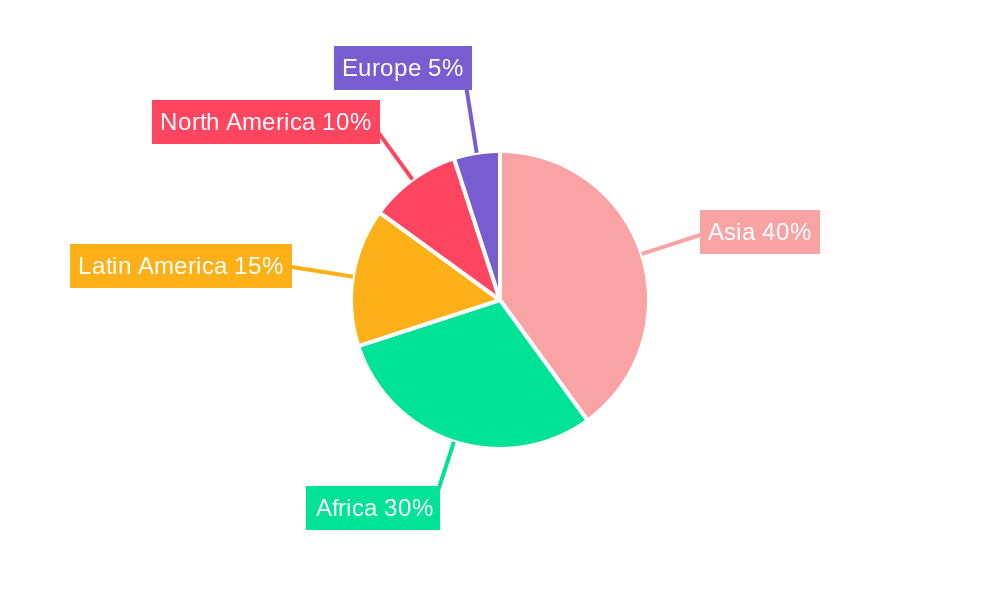
The market segmentation is likely diverse, encompassing various product categories (health, life, agricultural, etc.) and customer demographics. While specific segment data is unavailable, analysis suggests a significant portion of the market will be concentrated in developing nations in Asia and Africa, mirroring existing trends in financial inclusion. The substantial growth potential will attract further investment and innovation, leading to the development of more tailored and accessible microinsurance products. Companies must focus on delivering user-friendly products and services through convenient channels to capitalize on the growing market. Future growth depends on successful collaborations between insurers, technology providers, and government agencies to overcome existing barriers to access. Focus on digitalization and data analytics will be crucial for driving efficiency and expanding reach to underserved populations.
Microinsurance Market Company Market Share
Microinsurance Market Report: 2019-2033 Forecast
This comprehensive report provides an in-depth analysis of the global microinsurance market, offering invaluable insights for industry professionals, investors, and strategists. The study period covers 2019-2033, with a base year of 2025 and a forecast period of 2025-2033. The report uses data from the historical period (2019-2024) and estimated year data from 2025 to project future market trends. Market values are expressed in Millions.
Microinsurance Market Structure & Innovation Trends
This section analyzes the microinsurance market's competitive landscape, examining market concentration, innovation drivers, regulatory frameworks, and M&A activities. We delve into the dynamics shaping the market, including product substitutes, end-user demographics, and the role of mergers and acquisitions.
- Market Concentration: The market exhibits a moderately concentrated structure, with a few large players holding significant market share. The precise market share distribution will be detailed in the full report.
- Innovation Drivers: Technological advancements, particularly in mobile technology and digital distribution channels, are key innovation drivers. Government initiatives promoting financial inclusion also play a crucial role.
- Regulatory Frameworks: Varying regulatory landscapes across different regions influence market growth and penetration. Stricter regulations can pose challenges, while supportive frameworks can foster expansion.
- M&A Activities: The report analyzes significant mergers and acquisitions within the microinsurance sector, including deal values and their impact on market dynamics. For example, the estimated value of M&A deals in the period 2019-2024 is xx Million.
Microinsurance Market Dynamics & Trends
This section explores the market's growth trajectory, encompassing market growth drivers, technological disruptions, consumer preferences, and competitive dynamics. We analyze the Compound Annual Growth Rate (CAGR) and market penetration rates across various segments. The global market is expected to reach xx Million by 2033. Key trends include increasing mobile penetration, evolving customer expectations, and the adoption of innovative distribution channels. The CAGR is projected to be xx% during the forecast period.
Dominant Regions & Segments in Microinsurance Market
This section identifies the leading regions and segments within the microinsurance market. We perform a comprehensive analysis of the factors contributing to the dominance of specific regions and segments.
- Key Drivers for Dominant Regions:
- Asia-Pacific: High population density, increasing smartphone penetration, and supportive government policies contribute to strong growth.
- Africa: Growing mobile money adoption and a large underserved population represent significant market opportunities.
- Latin America: Expanding middle class and increasing access to financial services are driving market expansion.
The full report offers a detailed analysis of regional and segmental market sizes and projections.
Microinsurance Market Product Innovations
The microinsurance sector is witnessing continuous product innovation, driven by technological advancements and evolving customer needs. New products focus on affordability, accessibility, and customized risk coverage, utilizing mobile platforms and digital distribution networks. This leads to enhanced customer engagement and increased market reach.
Report Scope & Segmentation Analysis
The report segments the microinsurance market by various criteria, including product type, distribution channel, and geography. Each segment's growth projections, market size, and competitive dynamics are extensively analyzed.
Key Drivers of Microinsurance Market Growth
Several factors drive microinsurance market growth, including:
- Technological advancements: Mobile technology facilitates wider reach and accessibility.
- Expanding financial inclusion initiatives: Government support increases access to insurance for underserved populations.
- Rising disposable incomes in emerging economies: Increased purchasing power boosts demand for insurance products.
Challenges in the Microinsurance Market Sector
Despite growth opportunities, challenges exist, including:
- Regulatory hurdles: Inconsistent regulations across various regions can create obstacles.
- Supply chain inefficiencies: Reaching remote populations can pose logistical challenges.
- Competition: Intense competition among players may impact profitability.
Emerging Opportunities in Microinsurance Market
The microinsurance market presents various emerging opportunities, including:
- Expansion into underserved markets: Reaching previously inaccessible customer segments holds significant potential.
- Development of innovative product offerings: Tailoring products to specific needs opens new avenues for growth.
- Leveraging big data and analytics: Enhanced risk assessment and customer segmentation improve efficiency.
Leading Players in the Microinsurance Market
- The Hollard Insurance Company
- afpgen com ph
- American International Group Inc
- Bharti AXA Life Insurance Company Limited
- SBI Life Insurance Company Limited
- ICICI Prudential Life Insurance Co Ltd
- Banco do Nordeste Brasil SA
- Climbs
- Allianz SE
- Bajaj Allianz Life Insurance Co Ltd
- List Not Exhaustive
Key Developments in Microinsurance Market Industry
- October 2023: Bharti Group's acquisition of AXA's stake in Bharti AXA Life Insurance signifies consolidation within the market.
- April 2023: AIG's establishment of Private Client Select Insurance Services demonstrates a focus on high-net-worth individuals, indicating diversification strategies.
Future Outlook for Microinsurance Market
The future outlook for the microinsurance market is positive, driven by continuous technological advancements, expanding financial inclusion, and increasing demand in emerging markets. Strategic partnerships, product innovation, and efficient distribution strategies will play crucial roles in shaping the market's future trajectory. Significant growth is anticipated throughout the forecast period, with market expansion in both developed and developing nations.
Microinsurance Market Segmentation
-
1. Model Type
- 1.1. Partner Agent Model
- 1.2. Full-service Model
-
2. Product Type
- 2.1. Life Insurance
- 2.2. Health Insurance
- 2.3. Property Insurance
- 2.4. Other Product Types
-
3. Distribution Channel
- 3.1. Direct Sales
- 3.2. Financial Institutions
- 3.3. Digital Channels
- 3.4. Other Distribution Channels
-
4. Provider
- 4.1. Commercially Viable
- 4.2. Through Aid/Government Support
Microinsurance Market Segmentation By Geography
- 1. North America
- 2. Europe
- 3. Asia Pacific
- 4. Middle East and Africa
- 5. South America
Microinsurance Market Regional Market Share
Geographic Coverage of Microinsurance Market
Microinsurance Market REPORT HIGHLIGHTS
| Aspects | Details |
|---|---|
| Study Period | 2020-2034 |
| Base Year | 2025 |
| Estimated Year | 2026 |
| Forecast Period | 2026-2034 |
| Historical Period | 2020-2025 |
| Growth Rate | CAGR of 4.57% from 2020-2034 |
| Segmentation |
|
Table of Contents
- 1. Introduction
- 1.1. Research Scope
- 1.2. Market Segmentation
- 1.3. Research Objective
- 1.4. Definitions and Assumptions
- 2. Executive Summary
- 2.1. Market Snapshot
- 3. Market Dynamics
- 3.1. Market Drivers
- 3.2. Market Restrains
- 3.3. Market Trends
- 3.4. Market Opportunities
- 4. Market Factor Analysis
- 4.1. Porters Five Forces
- 4.1.1. Bargaining Power of Suppliers
- 4.1.2. Bargaining Power of Buyers
- 4.1.3. Threat of New Entrants
- 4.1.4. Threat of Substitutes
- 4.1.5. Competitive Rivalry
- 4.2. PESTEL analysis
- 4.3. BCG Analysis
- 4.3.1. Stars (High Growth, High Market Share)
- 4.3.2. Cash Cows (Low Growth, High Market Share)
- 4.3.3. Question Mark (High Growth, Low Market Share)
- 4.3.4. Dogs (Low Growth, Low Market Share)
- 4.4. Ansoff Matrix Analysis
- 4.5. Supply Chain Analysis
- 4.6. Regulatory Landscape
- 4.7. Current Market Potential and Opportunity Assessment (TAM–SAM–SOM Framework)
- 4.8. PRI Analyst Note
- 4.1. Porters Five Forces
- 5. Market Analysis, Insights and Forecast 2021-2033
- 5.1. Market Analysis, Insights and Forecast - by Model Type
- 5.1.1. Partner Agent Model
- 5.1.2. Full-service Model
- 5.2. Market Analysis, Insights and Forecast - by Product Type
- 5.2.1. Life Insurance
- 5.2.2. Health Insurance
- 5.2.3. Property Insurance
- 5.2.4. Other Product Types
- 5.3. Market Analysis, Insights and Forecast - by Distribution Channel
- 5.3.1. Direct Sales
- 5.3.2. Financial Institutions
- 5.3.3. Digital Channels
- 5.3.4. Other Distribution Channels
- 5.4. Market Analysis, Insights and Forecast - by Provider
- 5.4.1. Commercially Viable
- 5.4.2. Through Aid/Government Support
- 5.5. Market Analysis, Insights and Forecast - by Region
- 5.5.1. North America
- 5.5.2. Europe
- 5.5.3. Asia Pacific
- 5.5.4. Middle East and Africa
- 5.5.5. South America
- 5.1. Market Analysis, Insights and Forecast - by Model Type
- 6. Global Microinsurance Market Analysis, Insights and Forecast, 2021-2033
- 6.1. Market Analysis, Insights and Forecast - by Model Type
- 6.1.1. Partner Agent Model
- 6.1.2. Full-service Model
- 6.2. Market Analysis, Insights and Forecast - by Product Type
- 6.2.1. Life Insurance
- 6.2.2. Health Insurance
- 6.2.3. Property Insurance
- 6.2.4. Other Product Types
- 6.3. Market Analysis, Insights and Forecast - by Distribution Channel
- 6.3.1. Direct Sales
- 6.3.2. Financial Institutions
- 6.3.3. Digital Channels
- 6.3.4. Other Distribution Channels
- 6.4. Market Analysis, Insights and Forecast - by Provider
- 6.4.1. Commercially Viable
- 6.4.2. Through Aid/Government Support
- 6.1. Market Analysis, Insights and Forecast - by Model Type
- 7. North America Microinsurance Market Analysis, Insights and Forecast, 2020-2032
- 7.1. Market Analysis, Insights and Forecast - by Model Type
- 7.1.1. Partner Agent Model
- 7.1.2. Full-service Model
- 7.2. Market Analysis, Insights and Forecast - by Product Type
- 7.2.1. Life Insurance
- 7.2.2. Health Insurance
- 7.2.3. Property Insurance
- 7.2.4. Other Product Types
- 7.3. Market Analysis, Insights and Forecast - by Distribution Channel
- 7.3.1. Direct Sales
- 7.3.2. Financial Institutions
- 7.3.3. Digital Channels
- 7.3.4. Other Distribution Channels
- 7.4. Market Analysis, Insights and Forecast - by Provider
- 7.4.1. Commercially Viable
- 7.4.2. Through Aid/Government Support
- 7.1. Market Analysis, Insights and Forecast - by Model Type
- 8. Europe Microinsurance Market Analysis, Insights and Forecast, 2020-2032
- 8.1. Market Analysis, Insights and Forecast - by Model Type
- 8.1.1. Partner Agent Model
- 8.1.2. Full-service Model
- 8.2. Market Analysis, Insights and Forecast - by Product Type
- 8.2.1. Life Insurance
- 8.2.2. Health Insurance
- 8.2.3. Property Insurance
- 8.2.4. Other Product Types
- 8.3. Market Analysis, Insights and Forecast - by Distribution Channel
- 8.3.1. Direct Sales
- 8.3.2. Financial Institutions
- 8.3.3. Digital Channels
- 8.3.4. Other Distribution Channels
- 8.4. Market Analysis, Insights and Forecast - by Provider
- 8.4.1. Commercially Viable
- 8.4.2. Through Aid/Government Support
- 8.1. Market Analysis, Insights and Forecast - by Model Type
- 9. Asia Pacific Microinsurance Market Analysis, Insights and Forecast, 2020-2032
- 9.1. Market Analysis, Insights and Forecast - by Model Type
- 9.1.1. Partner Agent Model
- 9.1.2. Full-service Model
- 9.2. Market Analysis, Insights and Forecast - by Product Type
- 9.2.1. Life Insurance
- 9.2.2. Health Insurance
- 9.2.3. Property Insurance
- 9.2.4. Other Product Types
- 9.3. Market Analysis, Insights and Forecast - by Distribution Channel
- 9.3.1. Direct Sales
- 9.3.2. Financial Institutions
- 9.3.3. Digital Channels
- 9.3.4. Other Distribution Channels
- 9.4. Market Analysis, Insights and Forecast - by Provider
- 9.4.1. Commercially Viable
- 9.4.2. Through Aid/Government Support
- 9.1. Market Analysis, Insights and Forecast - by Model Type
- 10. Middle East and Africa Microinsurance Market Analysis, Insights and Forecast, 2020-2032
- 10.1. Market Analysis, Insights and Forecast - by Model Type
- 10.1.1. Partner Agent Model
- 10.1.2. Full-service Model
- 10.2. Market Analysis, Insights and Forecast - by Product Type
- 10.2.1. Life Insurance
- 10.2.2. Health Insurance
- 10.2.3. Property Insurance
- 10.2.4. Other Product Types
- 10.3. Market Analysis, Insights and Forecast - by Distribution Channel
- 10.3.1. Direct Sales
- 10.3.2. Financial Institutions
- 10.3.3. Digital Channels
- 10.3.4. Other Distribution Channels
- 10.4. Market Analysis, Insights and Forecast - by Provider
- 10.4.1. Commercially Viable
- 10.4.2. Through Aid/Government Support
- 10.1. Market Analysis, Insights and Forecast - by Model Type
- 11. South America Microinsurance Market Analysis, Insights and Forecast, 2020-2032
- 11.1. Market Analysis, Insights and Forecast - by Model Type
- 11.1.1. Partner Agent Model
- 11.1.2. Full-service Model
- 11.2. Market Analysis, Insights and Forecast - by Product Type
- 11.2.1. Life Insurance
- 11.2.2. Health Insurance
- 11.2.3. Property Insurance
- 11.2.4. Other Product Types
- 11.3. Market Analysis, Insights and Forecast - by Distribution Channel
- 11.3.1. Direct Sales
- 11.3.2. Financial Institutions
- 11.3.3. Digital Channels
- 11.3.4. Other Distribution Channels
- 11.4. Market Analysis, Insights and Forecast - by Provider
- 11.4.1. Commercially Viable
- 11.4.2. Through Aid/Government Support
- 11.1. Market Analysis, Insights and Forecast - by Model Type
- 12. Competitive Analysis
- 12.1. Company Profiles
- 12.1.1 The Hollard Insurance Company
- 12.1.1.1. Company Overview
- 12.1.1.2. Products
- 12.1.1.3. Company Financials
- 12.1.1.4. SWOT Analysis
- 12.1.2 afpgen com ph
- 12.1.2.1. Company Overview
- 12.1.2.2. Products
- 12.1.2.3. Company Financials
- 12.1.2.4. SWOT Analysis
- 12.1.3 American International Group Inc
- 12.1.3.1. Company Overview
- 12.1.3.2. Products
- 12.1.3.3. Company Financials
- 12.1.3.4. SWOT Analysis
- 12.1.4 Bharti AXA Life Insurance Company Limited
- 12.1.4.1. Company Overview
- 12.1.4.2. Products
- 12.1.4.3. Company Financials
- 12.1.4.4. SWOT Analysis
- 12.1.5 SBI Life Insurance Company Limited
- 12.1.5.1. Company Overview
- 12.1.5.2. Products
- 12.1.5.3. Company Financials
- 12.1.5.4. SWOT Analysis
- 12.1.6 ICICI Prudential Life Insurance Co Ltd
- 12.1.6.1. Company Overview
- 12.1.6.2. Products
- 12.1.6.3. Company Financials
- 12.1.6.4. SWOT Analysis
- 12.1.7 Banco do Nordeste Brasil SA
- 12.1.7.1. Company Overview
- 12.1.7.2. Products
- 12.1.7.3. Company Financials
- 12.1.7.4. SWOT Analysis
- 12.1.8 Climbs
- 12.1.8.1. Company Overview
- 12.1.8.2. Products
- 12.1.8.3. Company Financials
- 12.1.8.4. SWOT Analysis
- 12.1.9 Allianz SE
- 12.1.9.1. Company Overview
- 12.1.9.2. Products
- 12.1.9.3. Company Financials
- 12.1.9.4. SWOT Analysis
- 12.1.10 Bajaj Allianz Life Insurance Co Ltd**List Not Exhaustive
- 12.1.10.1. Company Overview
- 12.1.10.2. Products
- 12.1.10.3. Company Financials
- 12.1.10.4. SWOT Analysis
- 12.1.1 The Hollard Insurance Company
- 12.2. Market Entropy
- 12.2.1 Company's Key Areas Served
- 12.2.2 Recent Developments
- 12.3. Company Market Share Analysis 2025
- 12.3.1 Top 5 Companies Market Share Analysis
- 12.3.2 Top 3 Companies Market Share Analysis
- 12.4. List of Potential Customers
- 13. Research Methodology
List of Figures
- Figure 1: Global Microinsurance Market Revenue Breakdown (billion, %) by Region 2025 & 2033
- Figure 2: Global Microinsurance Market Volume Breakdown (Billion, %) by Region 2025 & 2033
- Figure 3: North America Microinsurance Market Revenue (billion), by Model Type 2025 & 2033
- Figure 4: North America Microinsurance Market Volume (Billion), by Model Type 2025 & 2033
- Figure 5: North America Microinsurance Market Revenue Share (%), by Model Type 2025 & 2033
- Figure 6: North America Microinsurance Market Volume Share (%), by Model Type 2025 & 2033
- Figure 7: North America Microinsurance Market Revenue (billion), by Product Type 2025 & 2033
- Figure 8: North America Microinsurance Market Volume (Billion), by Product Type 2025 & 2033
- Figure 9: North America Microinsurance Market Revenue Share (%), by Product Type 2025 & 2033
- Figure 10: North America Microinsurance Market Volume Share (%), by Product Type 2025 & 2033
- Figure 11: North America Microinsurance Market Revenue (billion), by Distribution Channel 2025 & 2033
- Figure 12: North America Microinsurance Market Volume (Billion), by Distribution Channel 2025 & 2033
- Figure 13: North America Microinsurance Market Revenue Share (%), by Distribution Channel 2025 & 2033
- Figure 14: North America Microinsurance Market Volume Share (%), by Distribution Channel 2025 & 2033
- Figure 15: North America Microinsurance Market Revenue (billion), by Provider 2025 & 2033
- Figure 16: North America Microinsurance Market Volume (Billion), by Provider 2025 & 2033
- Figure 17: North America Microinsurance Market Revenue Share (%), by Provider 2025 & 2033
- Figure 18: North America Microinsurance Market Volume Share (%), by Provider 2025 & 2033
- Figure 19: North America Microinsurance Market Revenue (billion), by Country 2025 & 2033
- Figure 20: North America Microinsurance Market Volume (Billion), by Country 2025 & 2033
- Figure 21: North America Microinsurance Market Revenue Share (%), by Country 2025 & 2033
- Figure 22: North America Microinsurance Market Volume Share (%), by Country 2025 & 2033
- Figure 23: Europe Microinsurance Market Revenue (billion), by Model Type 2025 & 2033
- Figure 24: Europe Microinsurance Market Volume (Billion), by Model Type 2025 & 2033
- Figure 25: Europe Microinsurance Market Revenue Share (%), by Model Type 2025 & 2033
- Figure 26: Europe Microinsurance Market Volume Share (%), by Model Type 2025 & 2033
- Figure 27: Europe Microinsurance Market Revenue (billion), by Product Type 2025 & 2033
- Figure 28: Europe Microinsurance Market Volume (Billion), by Product Type 2025 & 2033
- Figure 29: Europe Microinsurance Market Revenue Share (%), by Product Type 2025 & 2033
- Figure 30: Europe Microinsurance Market Volume Share (%), by Product Type 2025 & 2033
- Figure 31: Europe Microinsurance Market Revenue (billion), by Distribution Channel 2025 & 2033
- Figure 32: Europe Microinsurance Market Volume (Billion), by Distribution Channel 2025 & 2033
- Figure 33: Europe Microinsurance Market Revenue Share (%), by Distribution Channel 2025 & 2033
- Figure 34: Europe Microinsurance Market Volume Share (%), by Distribution Channel 2025 & 2033
- Figure 35: Europe Microinsurance Market Revenue (billion), by Provider 2025 & 2033
- Figure 36: Europe Microinsurance Market Volume (Billion), by Provider 2025 & 2033
- Figure 37: Europe Microinsurance Market Revenue Share (%), by Provider 2025 & 2033
- Figure 38: Europe Microinsurance Market Volume Share (%), by Provider 2025 & 2033
- Figure 39: Europe Microinsurance Market Revenue (billion), by Country 2025 & 2033
- Figure 40: Europe Microinsurance Market Volume (Billion), by Country 2025 & 2033
- Figure 41: Europe Microinsurance Market Revenue Share (%), by Country 2025 & 2033
- Figure 42: Europe Microinsurance Market Volume Share (%), by Country 2025 & 2033
- Figure 43: Asia Pacific Microinsurance Market Revenue (billion), by Model Type 2025 & 2033
- Figure 44: Asia Pacific Microinsurance Market Volume (Billion), by Model Type 2025 & 2033
- Figure 45: Asia Pacific Microinsurance Market Revenue Share (%), by Model Type 2025 & 2033
- Figure 46: Asia Pacific Microinsurance Market Volume Share (%), by Model Type 2025 & 2033
- Figure 47: Asia Pacific Microinsurance Market Revenue (billion), by Product Type 2025 & 2033
- Figure 48: Asia Pacific Microinsurance Market Volume (Billion), by Product Type 2025 & 2033
- Figure 49: Asia Pacific Microinsurance Market Revenue Share (%), by Product Type 2025 & 2033
- Figure 50: Asia Pacific Microinsurance Market Volume Share (%), by Product Type 2025 & 2033
- Figure 51: Asia Pacific Microinsurance Market Revenue (billion), by Distribution Channel 2025 & 2033
- Figure 52: Asia Pacific Microinsurance Market Volume (Billion), by Distribution Channel 2025 & 2033
- Figure 53: Asia Pacific Microinsurance Market Revenue Share (%), by Distribution Channel 2025 & 2033
- Figure 54: Asia Pacific Microinsurance Market Volume Share (%), by Distribution Channel 2025 & 2033
- Figure 55: Asia Pacific Microinsurance Market Revenue (billion), by Provider 2025 & 2033
- Figure 56: Asia Pacific Microinsurance Market Volume (Billion), by Provider 2025 & 2033
- Figure 57: Asia Pacific Microinsurance Market Revenue Share (%), by Provider 2025 & 2033
- Figure 58: Asia Pacific Microinsurance Market Volume Share (%), by Provider 2025 & 2033
- Figure 59: Asia Pacific Microinsurance Market Revenue (billion), by Country 2025 & 2033
- Figure 60: Asia Pacific Microinsurance Market Volume (Billion), by Country 2025 & 2033
- Figure 61: Asia Pacific Microinsurance Market Revenue Share (%), by Country 2025 & 2033
- Figure 62: Asia Pacific Microinsurance Market Volume Share (%), by Country 2025 & 2033
- Figure 63: Middle East and Africa Microinsurance Market Revenue (billion), by Model Type 2025 & 2033
- Figure 64: Middle East and Africa Microinsurance Market Volume (Billion), by Model Type 2025 & 2033
- Figure 65: Middle East and Africa Microinsurance Market Revenue Share (%), by Model Type 2025 & 2033
- Figure 66: Middle East and Africa Microinsurance Market Volume Share (%), by Model Type 2025 & 2033
- Figure 67: Middle East and Africa Microinsurance Market Revenue (billion), by Product Type 2025 & 2033
- Figure 68: Middle East and Africa Microinsurance Market Volume (Billion), by Product Type 2025 & 2033
- Figure 69: Middle East and Africa Microinsurance Market Revenue Share (%), by Product Type 2025 & 2033
- Figure 70: Middle East and Africa Microinsurance Market Volume Share (%), by Product Type 2025 & 2033
- Figure 71: Middle East and Africa Microinsurance Market Revenue (billion), by Distribution Channel 2025 & 2033
- Figure 72: Middle East and Africa Microinsurance Market Volume (Billion), by Distribution Channel 2025 & 2033
- Figure 73: Middle East and Africa Microinsurance Market Revenue Share (%), by Distribution Channel 2025 & 2033
- Figure 74: Middle East and Africa Microinsurance Market Volume Share (%), by Distribution Channel 2025 & 2033
- Figure 75: Middle East and Africa Microinsurance Market Revenue (billion), by Provider 2025 & 2033
- Figure 76: Middle East and Africa Microinsurance Market Volume (Billion), by Provider 2025 & 2033
- Figure 77: Middle East and Africa Microinsurance Market Revenue Share (%), by Provider 2025 & 2033
- Figure 78: Middle East and Africa Microinsurance Market Volume Share (%), by Provider 2025 & 2033
- Figure 79: Middle East and Africa Microinsurance Market Revenue (billion), by Country 2025 & 2033
- Figure 80: Middle East and Africa Microinsurance Market Volume (Billion), by Country 2025 & 2033
- Figure 81: Middle East and Africa Microinsurance Market Revenue Share (%), by Country 2025 & 2033
- Figure 82: Middle East and Africa Microinsurance Market Volume Share (%), by Country 2025 & 2033
- Figure 83: South America Microinsurance Market Revenue (billion), by Model Type 2025 & 2033
- Figure 84: South America Microinsurance Market Volume (Billion), by Model Type 2025 & 2033
- Figure 85: South America Microinsurance Market Revenue Share (%), by Model Type 2025 & 2033
- Figure 86: South America Microinsurance Market Volume Share (%), by Model Type 2025 & 2033
- Figure 87: South America Microinsurance Market Revenue (billion), by Product Type 2025 & 2033
- Figure 88: South America Microinsurance Market Volume (Billion), by Product Type 2025 & 2033
- Figure 89: South America Microinsurance Market Revenue Share (%), by Product Type 2025 & 2033
- Figure 90: South America Microinsurance Market Volume Share (%), by Product Type 2025 & 2033
- Figure 91: South America Microinsurance Market Revenue (billion), by Distribution Channel 2025 & 2033
- Figure 92: South America Microinsurance Market Volume (Billion), by Distribution Channel 2025 & 2033
- Figure 93: South America Microinsurance Market Revenue Share (%), by Distribution Channel 2025 & 2033
- Figure 94: South America Microinsurance Market Volume Share (%), by Distribution Channel 2025 & 2033
- Figure 95: South America Microinsurance Market Revenue (billion), by Provider 2025 & 2033
- Figure 96: South America Microinsurance Market Volume (Billion), by Provider 2025 & 2033
- Figure 97: South America Microinsurance Market Revenue Share (%), by Provider 2025 & 2033
- Figure 98: South America Microinsurance Market Volume Share (%), by Provider 2025 & 2033
- Figure 99: South America Microinsurance Market Revenue (billion), by Country 2025 & 2033
- Figure 100: South America Microinsurance Market Volume (Billion), by Country 2025 & 2033
- Figure 101: South America Microinsurance Market Revenue Share (%), by Country 2025 & 2033
- Figure 102: South America Microinsurance Market Volume Share (%), by Country 2025 & 2033
List of Tables
- Table 1: Global Microinsurance Market Revenue billion Forecast, by Model Type 2020 & 2033
- Table 2: Global Microinsurance Market Volume Billion Forecast, by Model Type 2020 & 2033
- Table 3: Global Microinsurance Market Revenue billion Forecast, by Product Type 2020 & 2033
- Table 4: Global Microinsurance Market Volume Billion Forecast, by Product Type 2020 & 2033
- Table 5: Global Microinsurance Market Revenue billion Forecast, by Distribution Channel 2020 & 2033
- Table 6: Global Microinsurance Market Volume Billion Forecast, by Distribution Channel 2020 & 2033
- Table 7: Global Microinsurance Market Revenue billion Forecast, by Provider 2020 & 2033
- Table 8: Global Microinsurance Market Volume Billion Forecast, by Provider 2020 & 2033
- Table 9: Global Microinsurance Market Revenue billion Forecast, by Region 2020 & 2033
- Table 10: Global Microinsurance Market Volume Billion Forecast, by Region 2020 & 2033
- Table 11: Global Microinsurance Market Revenue billion Forecast, by Model Type 2020 & 2033
- Table 12: Global Microinsurance Market Volume Billion Forecast, by Model Type 2020 & 2033
- Table 13: Global Microinsurance Market Revenue billion Forecast, by Product Type 2020 & 2033
- Table 14: Global Microinsurance Market Volume Billion Forecast, by Product Type 2020 & 2033
- Table 15: Global Microinsurance Market Revenue billion Forecast, by Distribution Channel 2020 & 2033
- Table 16: Global Microinsurance Market Volume Billion Forecast, by Distribution Channel 2020 & 2033
- Table 17: Global Microinsurance Market Revenue billion Forecast, by Provider 2020 & 2033
- Table 18: Global Microinsurance Market Volume Billion Forecast, by Provider 2020 & 2033
- Table 19: Global Microinsurance Market Revenue billion Forecast, by Country 2020 & 2033
- Table 20: Global Microinsurance Market Volume Billion Forecast, by Country 2020 & 2033
- Table 21: Global Microinsurance Market Revenue billion Forecast, by Model Type 2020 & 2033
- Table 22: Global Microinsurance Market Volume Billion Forecast, by Model Type 2020 & 2033
- Table 23: Global Microinsurance Market Revenue billion Forecast, by Product Type 2020 & 2033
- Table 24: Global Microinsurance Market Volume Billion Forecast, by Product Type 2020 & 2033
- Table 25: Global Microinsurance Market Revenue billion Forecast, by Distribution Channel 2020 & 2033
- Table 26: Global Microinsurance Market Volume Billion Forecast, by Distribution Channel 2020 & 2033
- Table 27: Global Microinsurance Market Revenue billion Forecast, by Provider 2020 & 2033
- Table 28: Global Microinsurance Market Volume Billion Forecast, by Provider 2020 & 2033
- Table 29: Global Microinsurance Market Revenue billion Forecast, by Country 2020 & 2033
- Table 30: Global Microinsurance Market Volume Billion Forecast, by Country 2020 & 2033
- Table 31: Global Microinsurance Market Revenue billion Forecast, by Model Type 2020 & 2033
- Table 32: Global Microinsurance Market Volume Billion Forecast, by Model Type 2020 & 2033
- Table 33: Global Microinsurance Market Revenue billion Forecast, by Product Type 2020 & 2033
- Table 34: Global Microinsurance Market Volume Billion Forecast, by Product Type 2020 & 2033
- Table 35: Global Microinsurance Market Revenue billion Forecast, by Distribution Channel 2020 & 2033
- Table 36: Global Microinsurance Market Volume Billion Forecast, by Distribution Channel 2020 & 2033
- Table 37: Global Microinsurance Market Revenue billion Forecast, by Provider 2020 & 2033
- Table 38: Global Microinsurance Market Volume Billion Forecast, by Provider 2020 & 2033
- Table 39: Global Microinsurance Market Revenue billion Forecast, by Country 2020 & 2033
- Table 40: Global Microinsurance Market Volume Billion Forecast, by Country 2020 & 2033
- Table 41: Global Microinsurance Market Revenue billion Forecast, by Model Type 2020 & 2033
- Table 42: Global Microinsurance Market Volume Billion Forecast, by Model Type 2020 & 2033
- Table 43: Global Microinsurance Market Revenue billion Forecast, by Product Type 2020 & 2033
- Table 44: Global Microinsurance Market Volume Billion Forecast, by Product Type 2020 & 2033
- Table 45: Global Microinsurance Market Revenue billion Forecast, by Distribution Channel 2020 & 2033
- Table 46: Global Microinsurance Market Volume Billion Forecast, by Distribution Channel 2020 & 2033
- Table 47: Global Microinsurance Market Revenue billion Forecast, by Provider 2020 & 2033
- Table 48: Global Microinsurance Market Volume Billion Forecast, by Provider 2020 & 2033
- Table 49: Global Microinsurance Market Revenue billion Forecast, by Country 2020 & 2033
- Table 50: Global Microinsurance Market Volume Billion Forecast, by Country 2020 & 2033
- Table 51: Global Microinsurance Market Revenue billion Forecast, by Model Type 2020 & 2033
- Table 52: Global Microinsurance Market Volume Billion Forecast, by Model Type 2020 & 2033
- Table 53: Global Microinsurance Market Revenue billion Forecast, by Product Type 2020 & 2033
- Table 54: Global Microinsurance Market Volume Billion Forecast, by Product Type 2020 & 2033
- Table 55: Global Microinsurance Market Revenue billion Forecast, by Distribution Channel 2020 & 2033
- Table 56: Global Microinsurance Market Volume Billion Forecast, by Distribution Channel 2020 & 2033
- Table 57: Global Microinsurance Market Revenue billion Forecast, by Provider 2020 & 2033
- Table 58: Global Microinsurance Market Volume Billion Forecast, by Provider 2020 & 2033
- Table 59: Global Microinsurance Market Revenue billion Forecast, by Country 2020 & 2033
- Table 60: Global Microinsurance Market Volume Billion Forecast, by Country 2020 & 2033
Frequently Asked Questions
1. What is the projected Compound Annual Growth Rate (CAGR) of the Microinsurance Market?
The projected CAGR is approximately 4.57%.
2. Which companies are prominent players in the Microinsurance Market?
Key companies in the market include The Hollard Insurance Company, afpgen com ph, American International Group Inc, Bharti AXA Life Insurance Company Limited, SBI Life Insurance Company Limited, ICICI Prudential Life Insurance Co Ltd, Banco do Nordeste Brasil SA, Climbs, Allianz SE, Bajaj Allianz Life Insurance Co Ltd**List Not Exhaustive.
3. What are the main segments of the Microinsurance Market?
The market segments include Model Type, Product Type, Distribution Channel, Provider.
4. Can you provide details about the market size?
The market size is estimated to be USD 98.8 billion as of 2022.
5. What are some drivers contributing to market growth?
Access to Financial Services; Rise of Digital Platforms and Mobile Technology.
6. What are the notable trends driving market growth?
Low- and Middle-income Earners prefer Healthcare Insurance.
7. Are there any restraints impacting market growth?
Access to Financial Services; Rise of Digital Platforms and Mobile Technology.
8. Can you provide examples of recent developments in the market?
October 2023: Bharti Group entered an agreement with its partner AXA to purchase AXA's 49% ownership stake in Bharti AXA Life Insurance. The completion of the transaction was anticipated by December 2023.
9. What pricing options are available for accessing the report?
Pricing options include single-user, multi-user, and enterprise licenses priced at USD 4750, USD 5250, and USD 8750 respectively.
10. Is the market size provided in terms of value or volume?
The market size is provided in terms of value, measured in billion and volume, measured in Billion.
11. Are there any specific market keywords associated with the report?
Yes, the market keyword associated with the report is "Microinsurance Market," which aids in identifying and referencing the specific market segment covered.
12. How do I determine which pricing option suits my needs best?
The pricing options vary based on user requirements and access needs. Individual users may opt for single-user licenses, while businesses requiring broader access may choose multi-user or enterprise licenses for cost-effective access to the report.
13. Are there any additional resources or data provided in the Microinsurance Market report?
While the report offers comprehensive insights, it's advisable to review the specific contents or supplementary materials provided to ascertain if additional resources or data are available.
14. How can I stay updated on further developments or reports in the Microinsurance Market?
To stay informed about further developments, trends, and reports in the Microinsurance Market, consider subscribing to industry newsletters, following relevant companies and organizations, or regularly checking reputable industry news sources and publications.
Methodology
Step 1 - Identification of Relevant Samples Size from Population Database


Step 2 - Approaches for Defining Global Market Size (Value, Volume* & Price*)

Note*: In applicable scenarios
Step 3 - Data Sources
Primary Research
- Web Analytics
- Survey Reports
- Research Institute
- Latest Research Reports
- Opinion Leaders
Secondary Research
- Annual Reports
- White Paper
- Latest Press Release
- Industry Association
- Paid Database
- Investor Presentations

Step 4 - Data Triangulation
Involves using different sources of information in order to increase the validity of a study
These sources are likely to be stakeholders in a program - participants, other researchers, program staff, other community members, and so on.
Then we put all data in single framework & apply various statistical tools to find out the dynamic on the market.
During the analysis stage, feedback from the stakeholder groups would be compared to determine areas of agreement as well as areas of divergence