

Key Insights
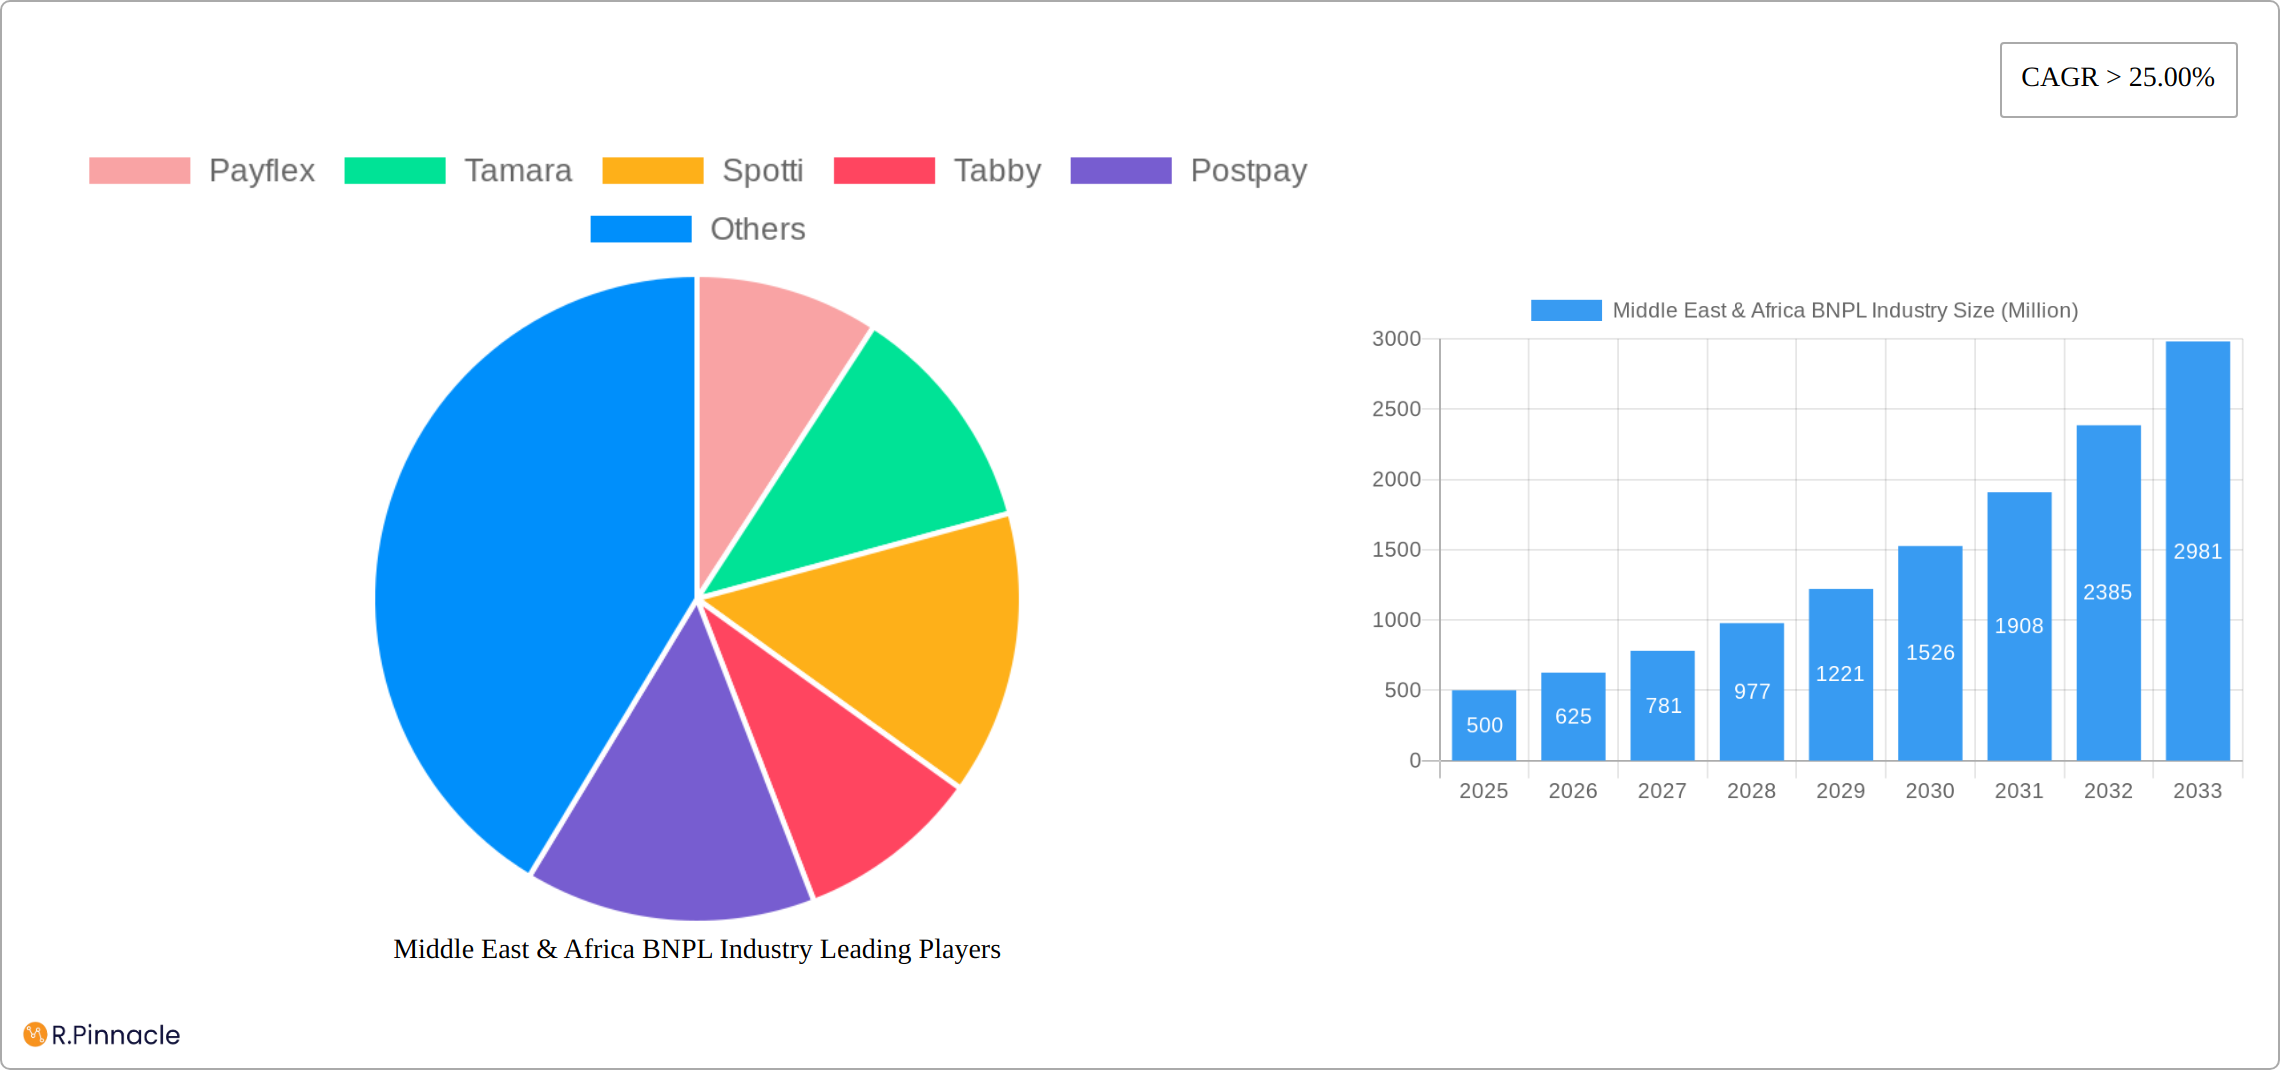
The Middle East and Africa (MEA) Buy Now, Pay Later (BNPL) market is experiencing significant expansion, propelled by widespread smartphone adoption, growing e-commerce engagement, and a youthful, digitally adept demographic. The market is projected to reach 44858.18 million by 2025, with a Compound Annual Growth Rate (CAGR) of 20.7%. BNPL services are reshaping consumer purchasing habits across sectors like fashion, electronics, and travel by offering unparalleled convenience and accessibility, particularly to individuals without traditional credit access. Strategic alliances between BNPL providers and leading e-commerce platforms are further accelerating market penetration through seamless integration into the online shopping journey. However, potential challenges include evolving regulatory frameworks and consumer debt management concerns. The market is segmented by payment methods, consumer profiles, and geographical areas. Key industry players, including Payflex, Tamara, Spotti, Tabby, Postpay, Shahry, Lipa Later, Sympl, Chari, and ThankUCash, are driving innovation and market consolidation.
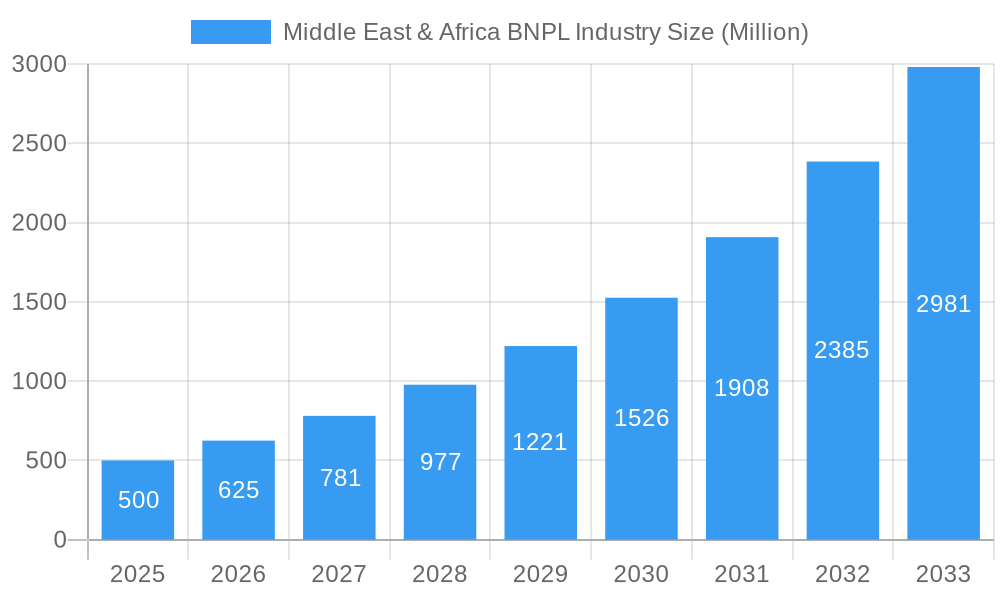
Middle East & Africa BNPL Industry Market Size (In Billion)
To sustain this robust growth, strategic imperatives include diversifying product portfolios, exploring untapped regional markets, and implementing advanced technologies such as AI and machine learning for enhanced risk management and personalized customer experiences. These initiatives are crucial for capturing a larger share of the MEA market and maintaining its impressive growth trajectory. The continued expansion hinges on the financial inclusion facilitated by BNPL solutions and the broader adoption of digital financial technologies across the region. Intensifying competition is anticipated, fostering innovation in pricing strategies, customer loyalty programs, and integrated financial services.
Middle East & Africa BNPL Industry Company Market Share
Middle East & Africa BNPL Industry: Market Report 2019-2033
This comprehensive report provides an in-depth analysis of the burgeoning Buy Now, Pay Later (BNPL) industry in the Middle East and Africa, covering the period 2019-2033. It offers actionable insights for industry professionals, investors, and stakeholders seeking to understand the market's dynamics, opportunities, and challenges. The report leverages extensive research and data analysis to project a robust growth trajectory, detailing key players, emerging trends, and future outlook for this rapidly evolving sector.
Middle East & Africa BNPL Industry Market Structure & Innovation Trends
This section meticulously dissects the competitive landscape, identifies key innovation drivers, and scrutinizes the regulatory factors profoundly shaping the Middle East & Africa (MEA) Buy Now, Pay Later (BNPL) market. We offer a granular analysis of market concentration, pinpointing leading players and their projected market shares, with an estimated concentration of xx% for the top 3 players in 2025. Furthermore, the report extensively explores the pivotal role of mergers and acquisitions (M&A), detailing significant deals and their substantial impact on market consolidation. The total estimated value of M&A deals within the MEA BNPL sector from 2019 to 2024 is a significant USD xx Million.
- Market Concentration: In-depth analysis of market share distribution among dominant players, highlighting their strategic positioning and growth trajectories.
- Innovation Drivers: Comprehensive examination of technological advancements (e.g., AI, blockchain), evolving consumer demand for seamless payment solutions, and dynamic regulatory shifts that are collectively propelling innovation within the MEA BNPL ecosystem.
- Regulatory Frameworks: Critical assessment of existing and emerging regulatory landscapes across diverse MEA countries, evaluating their impact on BNPL operations, consumer protection, and market accessibility.
- Product Substitutes: Identification and rigorous analysis of alternative payment methods, including traditional credit cards, digital wallets, and other fintech solutions, that pose competitive challenges to BNPL services.
- End-User Demographics: Detailed profiling of the typical BNPL user in the MEA region, encompassing age demographics, income levels, spending habits, and psychographic characteristics to understand user behavior and preferences.
- M&A Activities: A thorough overview of significant mergers and acquisitions, including disclosed deal values, strategic rationales, and their implications for market consolidation, competitive intensity, and the expansion of service portfolios.
Middle East & Africa BNPL Industry Market Dynamics & Trends
This section delves deeply into the primary factors fueling the robust growth of the MEA BNPL market. Key drivers include the accelerating adoption of e-commerce platforms, the pervasive increase in smartphone penetration across the region, and a discernible growing preference among consumers for agile and flexible payment options. The report forecasts a compelling Compound Annual Growth Rate (CAGR) of xx% for the BNPL market in MEA throughout the forecast period (2025-2033), with market penetration projected to reach a significant xx% by 2033. We also meticulously analyze disruptive technological advancements, the evolving landscape of consumer preferences, and the intense competitive dynamics that are collectively shaping and redefining the market's evolution.
Dominant Regions & Segments in Middle East & Africa BNPL Industry
This section pinpoints the leading regions and segments within the MEA BNPL market. The analysis identifies key growth drivers within these dominant areas, considering economic factors, infrastructure development, and regulatory support.
- Leading Regions: [Detailed analysis of the leading region(s), highlighting key factors driving dominance].
- Key Drivers:
- Economic Policies: Impact of government initiatives and economic growth on BNPL adoption.
- Infrastructure: Role of digital infrastructure and financial inclusion in market expansion.
- Consumer Behavior: Analysis of consumer preferences and spending patterns influencing market growth.
- [Other relevant factors]
Middle East & Africa BNPL Industry Product Innovations
The MEA BNPL market is characterized by a continuous stream of groundbreaking product development and strategic innovation. New features are consistently being introduced to significantly enhance the user experience, broaden the scope of service offerings, and adeptly cater to the diverse and evolving needs of consumers across the region. These innovations are largely propelled by rapid technological advancements, particularly in critical areas such as sophisticated AI-powered risk assessment methodologies, the implementation of seamless digital onboarding processes, and the development of personalized financial management tools. This section provides an in-depth examination of the evolutionary trajectory of BNPL products, prominently highlighting key innovations, their unique competitive advantages, and their potential to redefine the payment landscape.
Report Scope & Segmentation Analysis
This report segments the MEA BNPL market by various factors, including region, country, and payment type. Growth projections and market size estimations are provided for each segment, along with an analysis of competitive dynamics. [Provide paragraph-by-paragraph analysis of each segment – e.g., by country, by income level, by transaction value, etc.].
Key Drivers of Middle East & Africa BNPL Industry Growth
The significant growth of the MEA BNPL market is fueled by a confluence of factors. The increasing adoption of e-commerce, coupled with rising smartphone penetration and improving digital infrastructure, creates a fertile ground for the expansion of BNPL services. Furthermore, favorable regulatory environments in certain regions and the growing financial inclusion initiatives further bolster the market's growth.
Challenges in the Middle East & Africa BNPL Industry Sector
Notwithstanding its formidable growth trajectory and immense potential, the MEA BNPL industry is confronted with a spectrum of significant challenges. Regulatory uncertainties, particularly in certain emerging markets, persistent concerns surrounding escalating consumer debt levels, and the ever-present risks associated with fraud and security breaches represent substantial hurdles to widespread adoption and sustainable growth. Furthermore, intensified competition from established financial institutions and payment providers, coupled with the imperative for developing and maintaining robust customer support infrastructure, continue to pose ongoing obstacles. The estimated impact of these collective challenges on market growth in 2025 is projected to result in a reduction of approximately xx%.
Emerging Opportunities in Middle East & Africa BNPL Industry
The MEA BNPL market presents numerous opportunities for growth and expansion. Untapped markets in less-penetrated regions, the potential for partnerships with traditional financial institutions, and the integration of BNPL services into broader fintech ecosystems offer significant potential. The adoption of innovative technologies, such as blockchain and AI, promises further enhancements to the security and efficiency of BNPL transactions.
Key Developments in Middle East & Africa BNPL Industry
- January 2022: Lipa Later successfully secured USD 12 Million in pre-series A funding, a strategic move aimed at fueling its ambitious expansion plans across the African continent.
- February 2022: Postpay announced the securing of a crucial debt financing agreement with the Commercial Bank of Dubai, a development designed to empower the company in significantly expanding its product portfolio and service offerings.
Future Outlook for Middle East & Africa BNPL Industry Market
The MEA BNPL market is poised for continued strong growth driven by increasing digital adoption, expanding financial inclusion, and innovative product offerings. Strategic partnerships, technological advancements, and favorable regulatory landscapes will further contribute to its future potential. The market is expected to reach USD xx Million by 2033, offering significant opportunities for both established players and new entrants.
Middle East & Africa BNPL Industry Segmentation
-
1. Channel
- 1.1. Online
- 1.2. POS
-
2. Enterprises Size
- 2.1. Large Enterprises
- 2.2. Small & Medium Enterprises
-
3. End User
- 3.1. Consumer Electronics
- 3.2. Fashion & Garments
- 3.3. Healthcare
- 3.4. Leisure & Entertainment
- 3.5. Retail
- 3.6. Others
Middle East & Africa BNPL Industry Segmentation By Geography
-
1. Middle East
- 1.1. Saudi Arabia
- 1.2. United Arab Emirates
- 1.3. Israel
- 1.4. Qatar
- 1.5. Kuwait
- 1.6. Oman
- 1.7. Bahrain
- 1.8. Jordan
- 1.9. Lebanon
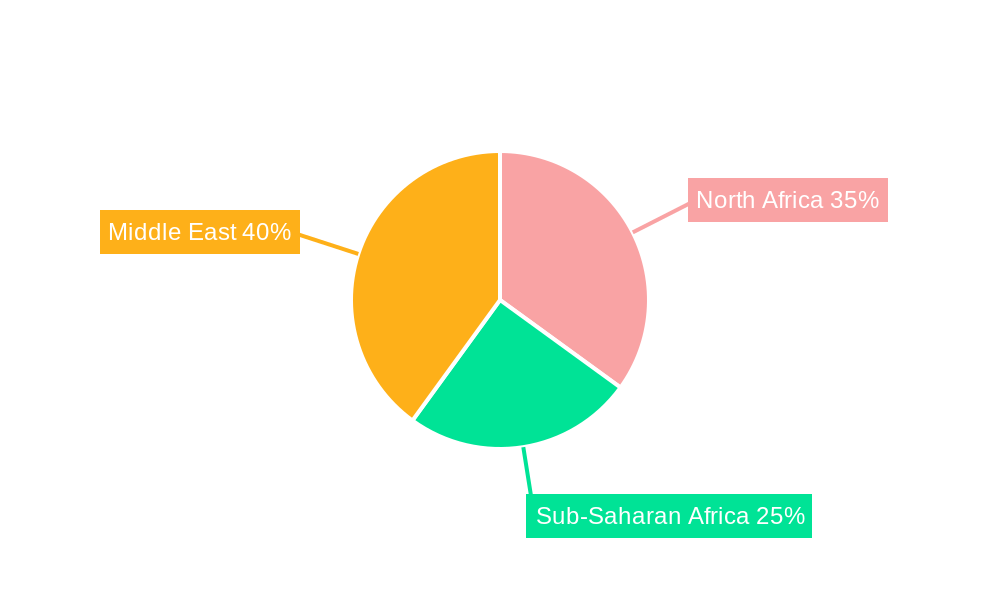
Middle East & Africa BNPL Industry Regional Market Share
Geographic Coverage of Middle East & Africa BNPL Industry
Middle East & Africa BNPL Industry REPORT HIGHLIGHTS
| Aspects | Details |
|---|---|
| Study Period | 2020-2034 |
| Base Year | 2025 |
| Estimated Year | 2026 |
| Forecast Period | 2026-2034 |
| Historical Period | 2020-2025 |
| Growth Rate | CAGR of 20.7% from 2020-2034 |
| Segmentation |
|
Table of Contents
- 1. Introduction
- 1.1. Research Scope
- 1.2. Market Segmentation
- 1.3. Research Objective
- 1.4. Definitions and Assumptions
- 2. Executive Summary
- 2.1. Market Snapshot
- 3. Market Dynamics
- 3.1. Market Drivers
- 3.2. Market Restrains
- 3.3. Market Trends
- 3.4. Market Opportunities
- 4. Market Factor Analysis
- 4.1. Porters Five Forces
- 4.1.1. Bargaining Power of Suppliers
- 4.1.2. Bargaining Power of Buyers
- 4.1.3. Threat of New Entrants
- 4.1.4. Threat of Substitutes
- 4.1.5. Competitive Rivalry
- 4.2. PESTEL analysis
- 4.3. BCG Analysis
- 4.3.1. Stars (High Growth, High Market Share)
- 4.3.2. Cash Cows (Low Growth, High Market Share)
- 4.3.3. Question Mark (High Growth, Low Market Share)
- 4.3.4. Dogs (Low Growth, Low Market Share)
- 4.4. Ansoff Matrix Analysis
- 4.5. Supply Chain Analysis
- 4.6. Regulatory Landscape
- 4.7. Current Market Potential and Opportunity Assessment (TAM–SAM–SOM Framework)
- 4.8. PRI Analyst Note
- 4.1. Porters Five Forces
- 5. Market Analysis, Insights and Forecast 2021-2033
- 5.1. Market Analysis, Insights and Forecast - by Channel
- 5.1.1. Online
- 5.1.2. POS
- 5.2. Market Analysis, Insights and Forecast - by Enterprises Size
- 5.2.1. Large Enterprises
- 5.2.2. Small & Medium Enterprises
- 5.3. Market Analysis, Insights and Forecast - by End User
- 5.3.1. Consumer Electronics
- 5.3.2. Fashion & Garments
- 5.3.3. Healthcare
- 5.3.4. Leisure & Entertainment
- 5.3.5. Retail
- 5.3.6. Others
- 5.4. Market Analysis, Insights and Forecast - by Region
- 5.4.1. Middle East
- 5.1. Market Analysis, Insights and Forecast - by Channel
- 6. Middle East & Africa BNPL Industry Analysis, Insights and Forecast, 2021-2033
- 6.1. Market Analysis, Insights and Forecast - by Channel
- 6.1.1. Online
- 6.1.2. POS
- 6.2. Market Analysis, Insights and Forecast - by Enterprises Size
- 6.2.1. Large Enterprises
- 6.2.2. Small & Medium Enterprises
- 6.3. Market Analysis, Insights and Forecast - by End User
- 6.3.1. Consumer Electronics
- 6.3.2. Fashion & Garments
- 6.3.3. Healthcare
- 6.3.4. Leisure & Entertainment
- 6.3.5. Retail
- 6.3.6. Others
- 6.1. Market Analysis, Insights and Forecast - by Channel
- 7. Competitive Analysis
- 7.1. Company Profiles
- 7.1.1 Payflex
- 7.1.1.1. Company Overview
- 7.1.1.2. Products
- 7.1.1.3. Company Financials
- 7.1.1.4. SWOT Analysis
- 7.1.2 Tamara
- 7.1.2.1. Company Overview
- 7.1.2.2. Products
- 7.1.2.3. Company Financials
- 7.1.2.4. SWOT Analysis
- 7.1.3 Spotti
- 7.1.3.1. Company Overview
- 7.1.3.2. Products
- 7.1.3.3. Company Financials
- 7.1.3.4. SWOT Analysis
- 7.1.4 Tabby
- 7.1.4.1. Company Overview
- 7.1.4.2. Products
- 7.1.4.3. Company Financials
- 7.1.4.4. SWOT Analysis
- 7.1.5 Postpay
- 7.1.5.1. Company Overview
- 7.1.5.2. Products
- 7.1.5.3. Company Financials
- 7.1.5.4. SWOT Analysis
- 7.1.6 Shahry
- 7.1.6.1. Company Overview
- 7.1.6.2. Products
- 7.1.6.3. Company Financials
- 7.1.6.4. SWOT Analysis
- 7.1.7 Lipa Later
- 7.1.7.1. Company Overview
- 7.1.7.2. Products
- 7.1.7.3. Company Financials
- 7.1.7.4. SWOT Analysis
- 7.1.8 Sympl
- 7.1.8.1. Company Overview
- 7.1.8.2. Products
- 7.1.8.3. Company Financials
- 7.1.8.4. SWOT Analysis
- 7.1.9 Chari
- 7.1.9.1. Company Overview
- 7.1.9.2. Products
- 7.1.9.3. Company Financials
- 7.1.9.4. SWOT Analysis
- 7.1.10 ThankUCash*List Not Exhaustive
- 7.1.10.1. Company Overview
- 7.1.10.2. Products
- 7.1.10.3. Company Financials
- 7.1.10.4. SWOT Analysis
- 7.1.1 Payflex
- 7.2. Market Entropy
- 7.2.1 Company's Key Areas Served
- 7.2.2 Recent Developments
- 7.3. Company Market Share Analysis 2025
- 7.3.1 Top 5 Companies Market Share Analysis
- 7.3.2 Top 3 Companies Market Share Analysis
- 7.4. List of Potential Customers
- 8. Research Methodology
List of Figures
- Figure 1: Middle East & Africa BNPL Industry Revenue Breakdown (million, %) by Product 2025 & 2033
- Figure 2: Middle East & Africa BNPL Industry Share (%) by Company 2025
List of Tables
- Table 1: Middle East & Africa BNPL Industry Revenue million Forecast, by Channel 2020 & 2033
- Table 2: Middle East & Africa BNPL Industry Revenue million Forecast, by Enterprises Size 2020 & 2033
- Table 3: Middle East & Africa BNPL Industry Revenue million Forecast, by End User 2020 & 2033
- Table 4: Middle East & Africa BNPL Industry Revenue million Forecast, by Region 2020 & 2033
- Table 5: Middle East & Africa BNPL Industry Revenue million Forecast, by Channel 2020 & 2033
- Table 6: Middle East & Africa BNPL Industry Revenue million Forecast, by Enterprises Size 2020 & 2033
- Table 7: Middle East & Africa BNPL Industry Revenue million Forecast, by End User 2020 & 2033
- Table 8: Middle East & Africa BNPL Industry Revenue million Forecast, by Country 2020 & 2033
- Table 9: Saudi Arabia Middle East & Africa BNPL Industry Revenue (million) Forecast, by Application 2020 & 2033
- Table 10: United Arab Emirates Middle East & Africa BNPL Industry Revenue (million) Forecast, by Application 2020 & 2033
- Table 11: Israel Middle East & Africa BNPL Industry Revenue (million) Forecast, by Application 2020 & 2033
- Table 12: Qatar Middle East & Africa BNPL Industry Revenue (million) Forecast, by Application 2020 & 2033
- Table 13: Kuwait Middle East & Africa BNPL Industry Revenue (million) Forecast, by Application 2020 & 2033
- Table 14: Oman Middle East & Africa BNPL Industry Revenue (million) Forecast, by Application 2020 & 2033
- Table 15: Bahrain Middle East & Africa BNPL Industry Revenue (million) Forecast, by Application 2020 & 2033
- Table 16: Jordan Middle East & Africa BNPL Industry Revenue (million) Forecast, by Application 2020 & 2033
- Table 17: Lebanon Middle East & Africa BNPL Industry Revenue (million) Forecast, by Application 2020 & 2033
Frequently Asked Questions
1. What is the projected Compound Annual Growth Rate (CAGR) of the Middle East & Africa BNPL Industry?
The projected CAGR is approximately 20.7%.
2. Which companies are prominent players in the Middle East & Africa BNPL Industry?
Key companies in the market include Payflex, Tamara, Spotti, Tabby, Postpay, Shahry, Lipa Later, Sympl, Chari, ThankUCash*List Not Exhaustive.
3. What are the main segments of the Middle East & Africa BNPL Industry?
The market segments include Channel, Enterprises Size, End User.
4. Can you provide details about the market size?
The market size is estimated to be USD 44858.18 million as of 2022.
5. What are some drivers contributing to market growth?
N/A
6. What are the notable trends driving market growth?
Growth in E-commerce in Middle East and Africa is increasing.
7. Are there any restraints impacting market growth?
N/A
8. Can you provide examples of recent developments in the market?
January 2022 - Lipa Later, a Kenyan BNPL startup, has secured USD 12 million in pre-series A funding to grow across Africa. This new capital, according to the firm, would allow them to supply their buy-now-pay-later services to their current pipeline of users, strengthen their presence in current markets (Kenya, Uganda, and Rwanda), and expand into new markets such as Nigeria, South Africa, Ghana, and Tanzania.
9. What pricing options are available for accessing the report?
Pricing options include single-user, multi-user, and enterprise licenses priced at USD 3800, USD 4500, and USD 5800 respectively.
10. Is the market size provided in terms of value or volume?
The market size is provided in terms of value, measured in million.
11. Are there any specific market keywords associated with the report?
Yes, the market keyword associated with the report is "Middle East & Africa BNPL Industry," which aids in identifying and referencing the specific market segment covered.
12. How do I determine which pricing option suits my needs best?
The pricing options vary based on user requirements and access needs. Individual users may opt for single-user licenses, while businesses requiring broader access may choose multi-user or enterprise licenses for cost-effective access to the report.
13. Are there any additional resources or data provided in the Middle East & Africa BNPL Industry report?
While the report offers comprehensive insights, it's advisable to review the specific contents or supplementary materials provided to ascertain if additional resources or data are available.
14. How can I stay updated on further developments or reports in the Middle East & Africa BNPL Industry?
To stay informed about further developments, trends, and reports in the Middle East & Africa BNPL Industry, consider subscribing to industry newsletters, following relevant companies and organizations, or regularly checking reputable industry news sources and publications.
Methodology
Step 1 - Identification of Relevant Samples Size from Population Database


Step 2 - Approaches for Defining Global Market Size (Value, Volume* & Price*)

Note*: In applicable scenarios
Step 3 - Data Sources
Primary Research
- Web Analytics
- Survey Reports
- Research Institute
- Latest Research Reports
- Opinion Leaders
Secondary Research
- Annual Reports
- White Paper
- Latest Press Release
- Industry Association
- Paid Database
- Investor Presentations

Step 4 - Data Triangulation
Involves using different sources of information in order to increase the validity of a study
These sources are likely to be stakeholders in a program - participants, other researchers, program staff, other community members, and so on.
Then we put all data in single framework & apply various statistical tools to find out the dynamic on the market.
During the analysis stage, feedback from the stakeholder groups would be compared to determine areas of agreement as well as areas of divergence