

Key Insights
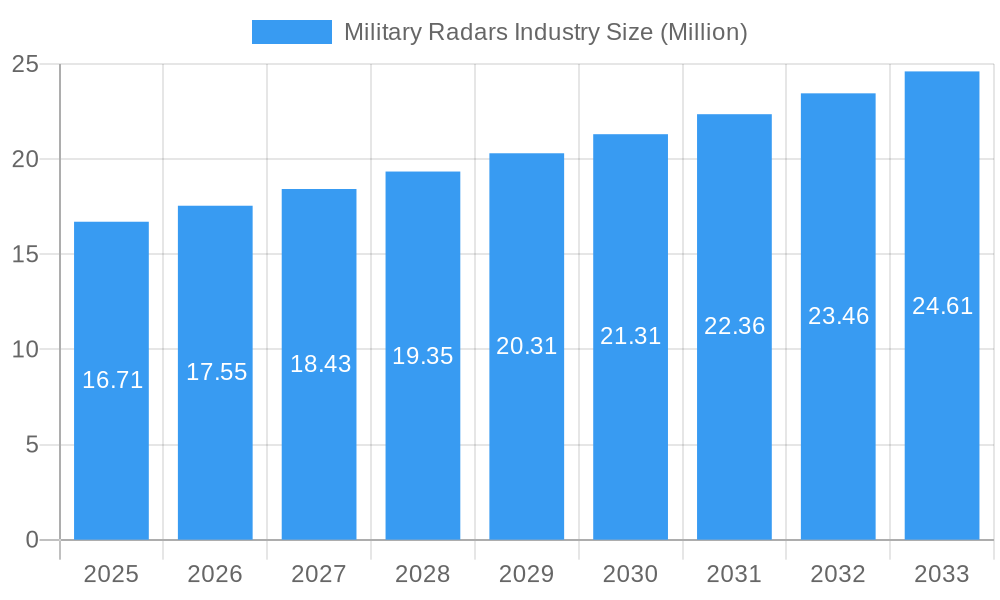
The global Military Radars market is poised for substantial growth, projected to reach 16.71 Million units by 2025, with a robust Compound Annual Growth Rate (CAGR) of 5.15% during the forecast period of 2025-2033. This expansion is driven by an increasing demand for advanced surveillance, reconnaissance, and target acquisition capabilities across various military branches. Nations are heavily investing in upgrading their existing radar systems and developing new technologies to counter evolving threats and maintain a strategic advantage. Key drivers include the rising geopolitical tensions, the need for enhanced border security, and the continuous innovation in radar technologies such as AESA (Active Electronically Scanned Array) and AI-powered analytics, which offer superior performance, reliability, and reduced downtime. The market benefits from ongoing modernization programs by defense forces worldwide, aiming to integrate sophisticated radar solutions for air, ground, and naval applications.
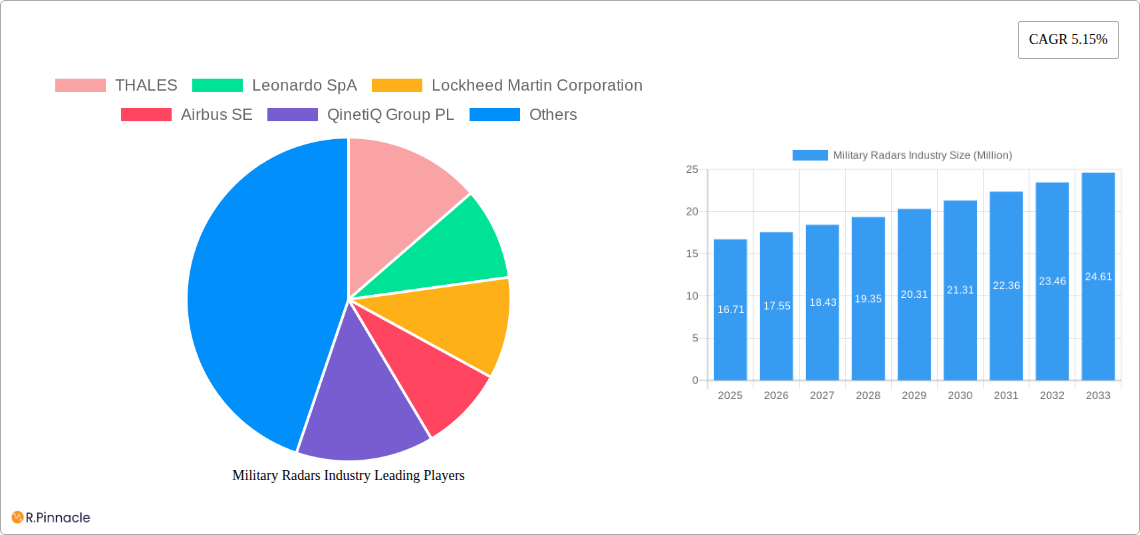
Military Radars Industry Market Size (In Million)
The market is characterized by significant investments in research and development to enhance radar functionalities, including improved target detection in complex environments, electronic warfare resilience, and miniaturization for integration into various platforms like drones and unmanned aerial vehicles. The growing emphasis on integrated defense systems and network-centric warfare further fuels the demand for interoperable and high-performance radar solutions. While the market demonstrates strong growth potential, certain factors can influence its trajectory. These include stringent regulatory approvals for advanced military technologies, the high cost associated with research, development, and deployment of sophisticated radar systems, and potential supply chain disruptions for critical components. Nevertheless, the persistent global security concerns and the ongoing technological advancements are expected to sustain the upward trend, making the Military Radars market a dynamic and strategically important sector.
Military Radars Industry Company Market Share
This in-depth report provides a critical analysis of the global Military Radars Industry, offering unparalleled insights into market dynamics, growth drivers, and future trajectories. Covering a comprehensive study period from 2019 to 2033, with a base and estimated year of 2025 and a forecast period from 2025 to 2033, this report is an indispensable resource for industry stakeholders seeking to navigate the complex landscape of military radar systems. We delve deep into Production Analysis, Consumption Analysis, Import/Export Market Analysis (Value & Volume), and Price Trend Analysis, presenting actionable data and strategic recommendations.
Leveraging high-ranking SEO keywords, this report is designed to be easily discoverable by professionals seeking information on advanced defense technologies, surveillance systems, and tactical radar solutions. Keywords such as "military radar market," "defense radar systems," "surveillance radar," "airborne radar," "ground radar," "naval radar," and "electronic warfare radar" have been integrated throughout to maximize search engine visibility.
The report meticulously examines the market share of leading companies and forecasts future market penetration. We provide detailed breakdowns of Military Radars Industry Market Structure & Innovation Trends, Military Radars Industry Market Dynamics & Trends, Dominant Regions & Segments in Military Radars Industry, Military Radars Industry Product Innovations, Report Scope & Segmentation Analysis, Key Drivers of Military Radars Industry Growth, Challenges in the Military Radars Industry Sector, Emerging Opportunities in Military Radars Industry, Leading Players in the Military Radars Industry Market, Key Developments in Military Radars Industry Industry, and Future Outlook for Military Radars Industry Market.
Military Radars Industry Market Structure & Innovation Trends
The Military Radars Industry is characterized by a moderately concentrated market structure, driven by high barriers to entry due to significant R&D investments and stringent regulatory approvals. Innovation remains a cornerstone, with continuous advancements in sensor technology, artificial intelligence, and data processing fueling the development of more sophisticated and adaptive radar systems. Key innovation drivers include the escalating need for superior battlefield awareness, enhanced threat detection capabilities, and the integration of multi-function radar systems. Regulatory frameworks, primarily governed by national defense policies and international arms control agreements, play a crucial role in shaping market access and product development. Product substitutes are limited due to the specialized nature of military-grade radar, though advancements in alternative sensing technologies present a long-term consideration. End-user demographics are predominantly government defense agencies and allied military forces. Mergers and acquisitions (M&A) activities are strategic, aimed at consolidating market share, acquiring specialized technological expertise, and expanding product portfolios. Recent M&A deal values are in the hundreds of Millions, reflecting the strategic importance of these acquisitions in bolstering competitive advantages. For instance, the acquisition of a niche radar technology firm by a major defense contractor for an estimated $500 Million illustrates this trend.
Military Radars Industry Market Dynamics & Trends
The Military Radars Industry is poised for robust growth, propelled by escalating geopolitical tensions and the increasing adoption of advanced defense technologies by nations worldwide. The market is projected to grow at a Compound Annual Growth Rate (CAGR) of approximately 7.5% during the forecast period. This expansion is largely fueled by the continuous need for enhanced situational awareness, improved target acquisition, and superior electronic warfare capabilities. Technological disruptions, such as the integration of AI and machine learning for real-time data analysis and predictive maintenance, are transforming radar performance. Furthermore, the development of solid-state phased array radars and multi-function radar systems offers greater flexibility and reduced lifecycle costs, making them increasingly attractive to defense forces. Consumer preferences, or rather defense procurement priorities, are shifting towards networked battlefield solutions, enabling seamless data sharing and collaborative engagement across various military platforms. This trend necessitates radar systems that are not only powerful but also highly interoperable. Competitive dynamics are intense, with leading players heavily investing in research and development to maintain their technological edge. Market penetration is expected to deepen as emerging economies expand their defense budgets and modernize their military infrastructure. The global market size is estimated to reach $25,000 Million by 2025 and is projected to exceed $40,000 Million by 2033. The demand for airborne radar systems, particularly for fighter jets and surveillance aircraft, is a significant growth driver, estimated to account for over 35% of the total market revenue in 2025.
Dominant Regions & Segments in Military Radars Industry
The North America region currently dominates the Military Radars Industry, driven by substantial defense spending from the United States and Canada, coupled with significant investments in advanced radar technology research and development. The United States, in particular, leads in consumption and production, supported by its large military footprint and continuous modernization programs.
- Production Analysis: The US and European nations are primary production hubs, with key players like RTX Corporation, Lockheed Martin Corporation, and THALES leading in manufacturing advanced radar systems. Production volumes are projected to increase by 8% annually.
- Consumption Analysis: North America and Europe are the largest consumers, accounting for an estimated 60% of the global market share in 2025. This demand is driven by ongoing conflicts and the need for modernized defense capabilities. Consumption is expected to rise by 7% year-on-year.
- Import Market Analysis (Value & Volume): While major players produce domestically, import markets exist for specialized components and niche radar systems. Countries in the Middle East and Asia-Pacific are significant importers, with import values in 2025 estimated at $3,500 Million. Volume of imports is projected to grow at 6%.
- Export Market Analysis (Value & Volume): The US, France, and the UK are major exporters of military radar technology. Export values are estimated at $4,200 Million in 2025, with a projected annual growth of 7.5%. Key export destinations include allied nations in the Middle East and Asia-Pacific.
- Price Trend Analysis: Prices for advanced military radar systems are high and tend to increase due to the complexity of technology and R&D costs. Inflationary pressures and the demand for cutting-edge features will likely drive price increases of 3-4% annually. The average price for a sophisticated airborne radar system can range from $10 Million to $50 Million.
Military Radars Industry Product Innovations
Recent product innovations in the Military Radars Industry are focused on enhancing sensor fusion, improving electronic counter-countermeasures (ECCM) capabilities, and miniaturizing radar systems for integration into smaller platforms like drones. The development of Gallium Nitride (GaN) technology is enabling more powerful, efficient, and compact radar solutions. AI-powered signal processing is revolutionizing target detection and tracking, allowing for the identification of stealthy targets and the discrimination of complex threats in cluttered environments. These innovations provide significant competitive advantages by offering superior performance, reduced signatures, and increased operational flexibility for military forces.
Report Scope & Segmentation Analysis
This report segments the Military Radars Industry across key areas including Production Analysis, Consumption Analysis, Import Market Analysis (Value & Volume), Export Market Analysis (Value & Volume), and Price Trend Analysis. Production is analyzed by technology type and manufacturing region, with projected growth of 7%. Consumption is segmented by end-user application (airborne, ground-based, naval) and geographical region, with the airborne segment expected to grow at 8%. Import and export markets are detailed by region and value, with import values estimated at $3,500 Million and export values at $4,200 Million in 2025. Price trends are analyzed by radar type and technological sophistication, with an anticipated annual increase of 3-4%.
Key Drivers of Military Radars Industry Growth
The primary drivers for the Military Radars Industry include escalating global defense spending driven by geopolitical uncertainties, the constant need to modernize aging radar systems with advanced technologies, and the growing demand for enhanced surveillance and reconnaissance capabilities. The proliferation of unmanned aerial vehicles (UAVs) also necessitates the development of specialized radar systems for their detection and tracking. Furthermore, the integration of artificial intelligence and machine learning into radar systems for improved target identification and threat assessment is a significant growth accelerator. Regulatory support for defense innovation and the adoption of advanced technologies by major military powers are also critical factors.
Challenges in the Military Radars Industry Sector
Despite strong growth prospects, the Military Radars Industry faces several challenges. High R&D costs and the long development cycles for advanced radar systems can be a significant barrier. Stringent regulatory requirements and complex procurement processes within defense establishments can slow down market adoption. The global supply chain for specialized electronic components can be vulnerable to disruptions, impacting production timelines and costs. Moreover, intense competition among established players and the emergence of new technological solutions require continuous innovation and strategic investments to maintain market position. The high price point of advanced radar systems also limits their widespread adoption in certain markets.
Emerging Opportunities in Military Radars Industry
Emerging opportunities in the Military Radars Industry lie in the development of networked and multi-functional radar systems that can operate across different domains (air, land, sea). The increasing adoption of AI and big data analytics presents significant opportunities for predictive maintenance and enhanced operational efficiency. The growing market for counter-drone and counter-stealth radar technologies is also a key area of expansion. Furthermore, the demand for compact, lightweight, and power-efficient radar solutions for integration into smaller platforms, such as micro-UAVs and soldier-worn systems, offers significant growth potential. Partnerships and collaborations for technology sharing and joint development are also key emerging trends.
Leading Players in the Military Radars Industry Market
- THALES
- Leonardo SpA
- Lockheed Martin Corporation
- Airbus SE
- QinetiQ Group PL
- Teledyne Technologies Incorporated
- BAE Systems PLC
- RTX Corporation
- HENSOLDT Holding Germany GmbH
- Israel Aerospace Industries Ltd
- Northrop Grumman Corporation
- Saab AB
Key Developments in Military Radars Industry Industry
- 2024/03: RTX Corporation awarded a contract for advanced airborne radar systems for a major allied air force, enhancing their surveillance capabilities.
- 2024/01: Leonardo SpA unveils a new generation of naval radar with enhanced multi-target tracking capabilities.
- 2023/11: Lockheed Martin Corporation successfully demonstrates an AI-integrated radar system capable of real-time threat assessment.
- 2023/09: THALES announces the development of a compact radar solution for counter-UAV operations.
- 2023/07: BAE Systems PLC secures a significant order for upgrades to existing ground surveillance radar systems.
- 2023/05: Northrop Grumman Corporation expands its portfolio of active electronically scanned array (AESA) radar systems.
- 2023/03: HENSOLDT Holding Germany GmbH announces a partnership to develop advanced radar solutions for next-generation fighter aircraft.
- 2023/01: Israel Aerospace Industries Ltd (IAI) showcases its latest airborne radar technology at a leading defense exhibition.
- 2022/11: Saab AB delivers advanced radar systems for a European nation's air defense network.
- 2022/09: QinetiQ Group PL develops innovative radar solutions for electronic warfare training simulations.
- 2022/07: Teledyne Technologies Incorporated announces advancements in solid-state radar technology.
- 2022/05: Airbus SE integrates advanced radar systems into its latest surveillance aircraft platform.
Future Outlook for Military Radars Industry Market
The future outlook for the Military Radars Industry is exceptionally promising, driven by continuous technological advancements and the persistent global security environment. The increasing demand for multi-functional, networked, and AI-enabled radar systems will fuel market growth. Opportunities in counter-stealth, counter-drone, and electronic warfare radar segments are expected to expand significantly. Investments in research and development for next-generation radar technologies, including those leveraging quantum sensing, will shape the future landscape. Strategic partnerships and collaborations will be crucial for companies to remain competitive and to address the evolving needs of modern defense forces. The market is projected to witness sustained innovation and significant expansion in the coming years.
Military Radars Industry Segmentation
- 1. Production Analysis
- 2. Consumption Analysis
- 3. Import Market Analysis (Value & Volume)
- 4. Export Market Analysis (Value & Volume)
- 5. Price Trend Analysis
Military Radars Industry Segmentation By Geography
-
1. North America
- 1.1. United States
- 1.2. Canada
- 1.3. Mexico
-
2. South America
- 2.1. Brazil
- 2.2. Argentina
- 2.3. Rest of South America
-
3. Europe
- 3.1. United Kingdom
- 3.2. Germany
- 3.3. France
- 3.4. Italy
- 3.5. Spain
- 3.6. Russia
- 3.7. Benelux
- 3.8. Nordics
- 3.9. Rest of Europe
-
4. Middle East & Africa
- 4.1. Turkey
- 4.2. Israel
- 4.3. GCC
- 4.4. North Africa
- 4.5. South Africa
- 4.6. Rest of Middle East & Africa
-
5. Asia Pacific
- 5.1. China
- 5.2. India
- 5.3. Japan
- 5.4. South Korea
- 5.5. ASEAN
- 5.6. Oceania
- 5.7. Rest of Asia Pacific
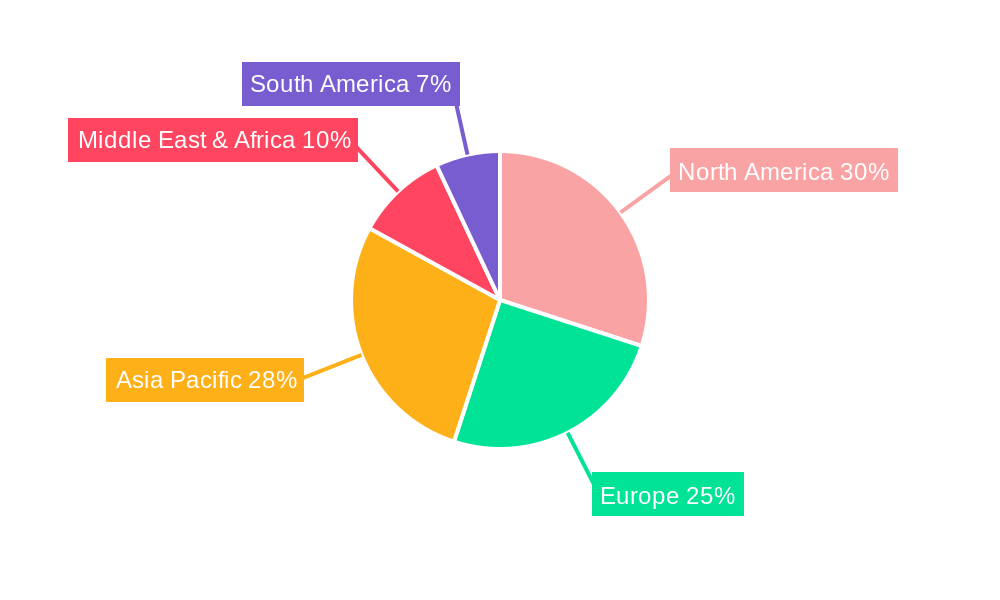
Military Radars Industry Regional Market Share
Geographic Coverage of Military Radars Industry
Military Radars Industry REPORT HIGHLIGHTS
| Aspects | Details |
|---|---|
| Study Period | 2020-2034 |
| Base Year | 2025 |
| Estimated Year | 2026 |
| Forecast Period | 2026-2034 |
| Historical Period | 2020-2025 |
| Growth Rate | CAGR of 5.15% from 2020-2034 |
| Segmentation |
|
Table of Contents
- 1. Introduction
- 1.1. Research Scope
- 1.2. Market Segmentation
- 1.3. Research Objective
- 1.4. Definitions and Assumptions
- 2. Executive Summary
- 2.1. Market Snapshot
- 3. Market Dynamics
- 3.1. Market Drivers
- 3.2. Market Restrains
- 3.3. Market Trends
- 3.4. Market Opportunities
- 4. Market Factor Analysis
- 4.1. Porters Five Forces
- 4.1.1. Bargaining Power of Suppliers
- 4.1.2. Bargaining Power of Buyers
- 4.1.3. Threat of New Entrants
- 4.1.4. Threat of Substitutes
- 4.1.5. Competitive Rivalry
- 4.2. PESTEL analysis
- 4.3. BCG Analysis
- 4.3.1. Stars (High Growth, High Market Share)
- 4.3.2. Cash Cows (Low Growth, High Market Share)
- 4.3.3. Question Mark (High Growth, Low Market Share)
- 4.3.4. Dogs (Low Growth, Low Market Share)
- 4.4. Ansoff Matrix Analysis
- 4.5. Supply Chain Analysis
- 4.6. Regulatory Landscape
- 4.7. Current Market Potential and Opportunity Assessment (TAM–SAM–SOM Framework)
- 4.8. PRI Analyst Note
- 4.1. Porters Five Forces
- 5. Market Analysis, Insights and Forecast 2021-2033
- 5.1. Market Analysis, Insights and Forecast - by Production Analysis
- 5.2. Market Analysis, Insights and Forecast - by Consumption Analysis
- 5.3. Market Analysis, Insights and Forecast - by Import Market Analysis (Value & Volume)
- 5.4. Market Analysis, Insights and Forecast - by Export Market Analysis (Value & Volume)
- 5.5. Market Analysis, Insights and Forecast - by Price Trend Analysis
- 5.6. Market Analysis, Insights and Forecast - by Region
- 5.6.1. North America
- 5.6.2. South America
- 5.6.3. Europe
- 5.6.4. Middle East & Africa
- 5.6.5. Asia Pacific
- 6. Global Military Radars Industry Analysis, Insights and Forecast, 2021-2033
- 6.1. Market Analysis, Insights and Forecast - by Production Analysis
- 6.2. Market Analysis, Insights and Forecast - by Consumption Analysis
- 6.3. Market Analysis, Insights and Forecast - by Import Market Analysis (Value & Volume)
- 6.4. Market Analysis, Insights and Forecast - by Export Market Analysis (Value & Volume)
- 6.5. Market Analysis, Insights and Forecast - by Price Trend Analysis
- 7. North America Military Radars Industry Analysis, Insights and Forecast, 2020-2032
- 7.1. Market Analysis, Insights and Forecast - by Production Analysis
- 7.2. Market Analysis, Insights and Forecast - by Consumption Analysis
- 7.3. Market Analysis, Insights and Forecast - by Import Market Analysis (Value & Volume)
- 7.4. Market Analysis, Insights and Forecast - by Export Market Analysis (Value & Volume)
- 7.5. Market Analysis, Insights and Forecast - by Price Trend Analysis
- 8. South America Military Radars Industry Analysis, Insights and Forecast, 2020-2032
- 8.1. Market Analysis, Insights and Forecast - by Production Analysis
- 8.2. Market Analysis, Insights and Forecast - by Consumption Analysis
- 8.3. Market Analysis, Insights and Forecast - by Import Market Analysis (Value & Volume)
- 8.4. Market Analysis, Insights and Forecast - by Export Market Analysis (Value & Volume)
- 8.5. Market Analysis, Insights and Forecast - by Price Trend Analysis
- 9. Europe Military Radars Industry Analysis, Insights and Forecast, 2020-2032
- 9.1. Market Analysis, Insights and Forecast - by Production Analysis
- 9.2. Market Analysis, Insights and Forecast - by Consumption Analysis
- 9.3. Market Analysis, Insights and Forecast - by Import Market Analysis (Value & Volume)
- 9.4. Market Analysis, Insights and Forecast - by Export Market Analysis (Value & Volume)
- 9.5. Market Analysis, Insights and Forecast - by Price Trend Analysis
- 10. Middle East & Africa Military Radars Industry Analysis, Insights and Forecast, 2020-2032
- 10.1. Market Analysis, Insights and Forecast - by Production Analysis
- 10.2. Market Analysis, Insights and Forecast - by Consumption Analysis
- 10.3. Market Analysis, Insights and Forecast - by Import Market Analysis (Value & Volume)
- 10.4. Market Analysis, Insights and Forecast - by Export Market Analysis (Value & Volume)
- 10.5. Market Analysis, Insights and Forecast - by Price Trend Analysis
- 11. Asia Pacific Military Radars Industry Analysis, Insights and Forecast, 2020-2032
- 11.1. Market Analysis, Insights and Forecast - by Production Analysis
- 11.2. Market Analysis, Insights and Forecast - by Consumption Analysis
- 11.3. Market Analysis, Insights and Forecast - by Import Market Analysis (Value & Volume)
- 11.4. Market Analysis, Insights and Forecast - by Export Market Analysis (Value & Volume)
- 11.5. Market Analysis, Insights and Forecast - by Price Trend Analysis
- 12. Competitive Analysis
- 12.1. Company Profiles
- 12.1.1 THALES
- 12.1.1.1. Company Overview
- 12.1.1.2. Products
- 12.1.1.3. Company Financials
- 12.1.1.4. SWOT Analysis
- 12.1.2 Leonardo SpA
- 12.1.2.1. Company Overview
- 12.1.2.2. Products
- 12.1.2.3. Company Financials
- 12.1.2.4. SWOT Analysis
- 12.1.3 Lockheed Martin Corporation
- 12.1.3.1. Company Overview
- 12.1.3.2. Products
- 12.1.3.3. Company Financials
- 12.1.3.4. SWOT Analysis
- 12.1.4 Airbus SE
- 12.1.4.1. Company Overview
- 12.1.4.2. Products
- 12.1.4.3. Company Financials
- 12.1.4.4. SWOT Analysis
- 12.1.5 QinetiQ Group PL
- 12.1.5.1. Company Overview
- 12.1.5.2. Products
- 12.1.5.3. Company Financials
- 12.1.5.4. SWOT Analysis
- 12.1.6 Teledyne Technologies Incorporated
- 12.1.6.1. Company Overview
- 12.1.6.2. Products
- 12.1.6.3. Company Financials
- 12.1.6.4. SWOT Analysis
- 12.1.7 BAE Systems PLC
- 12.1.7.1. Company Overview
- 12.1.7.2. Products
- 12.1.7.3. Company Financials
- 12.1.7.4. SWOT Analysis
- 12.1.8 RTX Corporation
- 12.1.8.1. Company Overview
- 12.1.8.2. Products
- 12.1.8.3. Company Financials
- 12.1.8.4. SWOT Analysis
- 12.1.9 HENSOLDT Holding Germany GmbH
- 12.1.9.1. Company Overview
- 12.1.9.2. Products
- 12.1.9.3. Company Financials
- 12.1.9.4. SWOT Analysis
- 12.1.10 Israel Aerospace Industries Ltd
- 12.1.10.1. Company Overview
- 12.1.10.2. Products
- 12.1.10.3. Company Financials
- 12.1.10.4. SWOT Analysis
- 12.1.11 Northrop Grumman Corporation
- 12.1.11.1. Company Overview
- 12.1.11.2. Products
- 12.1.11.3. Company Financials
- 12.1.11.4. SWOT Analysis
- 12.1.12 Saab AB
- 12.1.12.1. Company Overview
- 12.1.12.2. Products
- 12.1.12.3. Company Financials
- 12.1.12.4. SWOT Analysis
- 12.1.1 THALES
- 12.2. Market Entropy
- 12.2.1 Company's Key Areas Served
- 12.2.2 Recent Developments
- 12.3. Company Market Share Analysis 2025
- 12.3.1 Top 5 Companies Market Share Analysis
- 12.3.2 Top 3 Companies Market Share Analysis
- 12.4. List of Potential Customers
- 13. Research Methodology
List of Figures
- Figure 1: Global Military Radars Industry Revenue Breakdown (Million, %) by Region 2025 & 2033
- Figure 2: North America Military Radars Industry Revenue (Million), by Production Analysis 2025 & 2033
- Figure 3: North America Military Radars Industry Revenue Share (%), by Production Analysis 2025 & 2033
- Figure 4: North America Military Radars Industry Revenue (Million), by Consumption Analysis 2025 & 2033
- Figure 5: North America Military Radars Industry Revenue Share (%), by Consumption Analysis 2025 & 2033
- Figure 6: North America Military Radars Industry Revenue (Million), by Import Market Analysis (Value & Volume) 2025 & 2033
- Figure 7: North America Military Radars Industry Revenue Share (%), by Import Market Analysis (Value & Volume) 2025 & 2033
- Figure 8: North America Military Radars Industry Revenue (Million), by Export Market Analysis (Value & Volume) 2025 & 2033
- Figure 9: North America Military Radars Industry Revenue Share (%), by Export Market Analysis (Value & Volume) 2025 & 2033
- Figure 10: North America Military Radars Industry Revenue (Million), by Price Trend Analysis 2025 & 2033
- Figure 11: North America Military Radars Industry Revenue Share (%), by Price Trend Analysis 2025 & 2033
- Figure 12: North America Military Radars Industry Revenue (Million), by Country 2025 & 2033
- Figure 13: North America Military Radars Industry Revenue Share (%), by Country 2025 & 2033
- Figure 14: South America Military Radars Industry Revenue (Million), by Production Analysis 2025 & 2033
- Figure 15: South America Military Radars Industry Revenue Share (%), by Production Analysis 2025 & 2033
- Figure 16: South America Military Radars Industry Revenue (Million), by Consumption Analysis 2025 & 2033
- Figure 17: South America Military Radars Industry Revenue Share (%), by Consumption Analysis 2025 & 2033
- Figure 18: South America Military Radars Industry Revenue (Million), by Import Market Analysis (Value & Volume) 2025 & 2033
- Figure 19: South America Military Radars Industry Revenue Share (%), by Import Market Analysis (Value & Volume) 2025 & 2033
- Figure 20: South America Military Radars Industry Revenue (Million), by Export Market Analysis (Value & Volume) 2025 & 2033
- Figure 21: South America Military Radars Industry Revenue Share (%), by Export Market Analysis (Value & Volume) 2025 & 2033
- Figure 22: South America Military Radars Industry Revenue (Million), by Price Trend Analysis 2025 & 2033
- Figure 23: South America Military Radars Industry Revenue Share (%), by Price Trend Analysis 2025 & 2033
- Figure 24: South America Military Radars Industry Revenue (Million), by Country 2025 & 2033
- Figure 25: South America Military Radars Industry Revenue Share (%), by Country 2025 & 2033
- Figure 26: Europe Military Radars Industry Revenue (Million), by Production Analysis 2025 & 2033
- Figure 27: Europe Military Radars Industry Revenue Share (%), by Production Analysis 2025 & 2033
- Figure 28: Europe Military Radars Industry Revenue (Million), by Consumption Analysis 2025 & 2033
- Figure 29: Europe Military Radars Industry Revenue Share (%), by Consumption Analysis 2025 & 2033
- Figure 30: Europe Military Radars Industry Revenue (Million), by Import Market Analysis (Value & Volume) 2025 & 2033
- Figure 31: Europe Military Radars Industry Revenue Share (%), by Import Market Analysis (Value & Volume) 2025 & 2033
- Figure 32: Europe Military Radars Industry Revenue (Million), by Export Market Analysis (Value & Volume) 2025 & 2033
- Figure 33: Europe Military Radars Industry Revenue Share (%), by Export Market Analysis (Value & Volume) 2025 & 2033
- Figure 34: Europe Military Radars Industry Revenue (Million), by Price Trend Analysis 2025 & 2033
- Figure 35: Europe Military Radars Industry Revenue Share (%), by Price Trend Analysis 2025 & 2033
- Figure 36: Europe Military Radars Industry Revenue (Million), by Country 2025 & 2033
- Figure 37: Europe Military Radars Industry Revenue Share (%), by Country 2025 & 2033
- Figure 38: Middle East & Africa Military Radars Industry Revenue (Million), by Production Analysis 2025 & 2033
- Figure 39: Middle East & Africa Military Radars Industry Revenue Share (%), by Production Analysis 2025 & 2033
- Figure 40: Middle East & Africa Military Radars Industry Revenue (Million), by Consumption Analysis 2025 & 2033
- Figure 41: Middle East & Africa Military Radars Industry Revenue Share (%), by Consumption Analysis 2025 & 2033
- Figure 42: Middle East & Africa Military Radars Industry Revenue (Million), by Import Market Analysis (Value & Volume) 2025 & 2033
- Figure 43: Middle East & Africa Military Radars Industry Revenue Share (%), by Import Market Analysis (Value & Volume) 2025 & 2033
- Figure 44: Middle East & Africa Military Radars Industry Revenue (Million), by Export Market Analysis (Value & Volume) 2025 & 2033
- Figure 45: Middle East & Africa Military Radars Industry Revenue Share (%), by Export Market Analysis (Value & Volume) 2025 & 2033
- Figure 46: Middle East & Africa Military Radars Industry Revenue (Million), by Price Trend Analysis 2025 & 2033
- Figure 47: Middle East & Africa Military Radars Industry Revenue Share (%), by Price Trend Analysis 2025 & 2033
- Figure 48: Middle East & Africa Military Radars Industry Revenue (Million), by Country 2025 & 2033
- Figure 49: Middle East & Africa Military Radars Industry Revenue Share (%), by Country 2025 & 2033
- Figure 50: Asia Pacific Military Radars Industry Revenue (Million), by Production Analysis 2025 & 2033
- Figure 51: Asia Pacific Military Radars Industry Revenue Share (%), by Production Analysis 2025 & 2033
- Figure 52: Asia Pacific Military Radars Industry Revenue (Million), by Consumption Analysis 2025 & 2033
- Figure 53: Asia Pacific Military Radars Industry Revenue Share (%), by Consumption Analysis 2025 & 2033
- Figure 54: Asia Pacific Military Radars Industry Revenue (Million), by Import Market Analysis (Value & Volume) 2025 & 2033
- Figure 55: Asia Pacific Military Radars Industry Revenue Share (%), by Import Market Analysis (Value & Volume) 2025 & 2033
- Figure 56: Asia Pacific Military Radars Industry Revenue (Million), by Export Market Analysis (Value & Volume) 2025 & 2033
- Figure 57: Asia Pacific Military Radars Industry Revenue Share (%), by Export Market Analysis (Value & Volume) 2025 & 2033
- Figure 58: Asia Pacific Military Radars Industry Revenue (Million), by Price Trend Analysis 2025 & 2033
- Figure 59: Asia Pacific Military Radars Industry Revenue Share (%), by Price Trend Analysis 2025 & 2033
- Figure 60: Asia Pacific Military Radars Industry Revenue (Million), by Country 2025 & 2033
- Figure 61: Asia Pacific Military Radars Industry Revenue Share (%), by Country 2025 & 2033
List of Tables
- Table 1: Global Military Radars Industry Revenue Million Forecast, by Production Analysis 2020 & 2033
- Table 2: Global Military Radars Industry Revenue Million Forecast, by Consumption Analysis 2020 & 2033
- Table 3: Global Military Radars Industry Revenue Million Forecast, by Import Market Analysis (Value & Volume) 2020 & 2033
- Table 4: Global Military Radars Industry Revenue Million Forecast, by Export Market Analysis (Value & Volume) 2020 & 2033
- Table 5: Global Military Radars Industry Revenue Million Forecast, by Price Trend Analysis 2020 & 2033
- Table 6: Global Military Radars Industry Revenue Million Forecast, by Region 2020 & 2033
- Table 7: Global Military Radars Industry Revenue Million Forecast, by Production Analysis 2020 & 2033
- Table 8: Global Military Radars Industry Revenue Million Forecast, by Consumption Analysis 2020 & 2033
- Table 9: Global Military Radars Industry Revenue Million Forecast, by Import Market Analysis (Value & Volume) 2020 & 2033
- Table 10: Global Military Radars Industry Revenue Million Forecast, by Export Market Analysis (Value & Volume) 2020 & 2033
- Table 11: Global Military Radars Industry Revenue Million Forecast, by Price Trend Analysis 2020 & 2033
- Table 12: Global Military Radars Industry Revenue Million Forecast, by Country 2020 & 2033
- Table 13: United States Military Radars Industry Revenue (Million) Forecast, by Application 2020 & 2033
- Table 14: Canada Military Radars Industry Revenue (Million) Forecast, by Application 2020 & 2033
- Table 15: Mexico Military Radars Industry Revenue (Million) Forecast, by Application 2020 & 2033
- Table 16: Global Military Radars Industry Revenue Million Forecast, by Production Analysis 2020 & 2033
- Table 17: Global Military Radars Industry Revenue Million Forecast, by Consumption Analysis 2020 & 2033
- Table 18: Global Military Radars Industry Revenue Million Forecast, by Import Market Analysis (Value & Volume) 2020 & 2033
- Table 19: Global Military Radars Industry Revenue Million Forecast, by Export Market Analysis (Value & Volume) 2020 & 2033
- Table 20: Global Military Radars Industry Revenue Million Forecast, by Price Trend Analysis 2020 & 2033
- Table 21: Global Military Radars Industry Revenue Million Forecast, by Country 2020 & 2033
- Table 22: Brazil Military Radars Industry Revenue (Million) Forecast, by Application 2020 & 2033
- Table 23: Argentina Military Radars Industry Revenue (Million) Forecast, by Application 2020 & 2033
- Table 24: Rest of South America Military Radars Industry Revenue (Million) Forecast, by Application 2020 & 2033
- Table 25: Global Military Radars Industry Revenue Million Forecast, by Production Analysis 2020 & 2033
- Table 26: Global Military Radars Industry Revenue Million Forecast, by Consumption Analysis 2020 & 2033
- Table 27: Global Military Radars Industry Revenue Million Forecast, by Import Market Analysis (Value & Volume) 2020 & 2033
- Table 28: Global Military Radars Industry Revenue Million Forecast, by Export Market Analysis (Value & Volume) 2020 & 2033
- Table 29: Global Military Radars Industry Revenue Million Forecast, by Price Trend Analysis 2020 & 2033
- Table 30: Global Military Radars Industry Revenue Million Forecast, by Country 2020 & 2033
- Table 31: United Kingdom Military Radars Industry Revenue (Million) Forecast, by Application 2020 & 2033
- Table 32: Germany Military Radars Industry Revenue (Million) Forecast, by Application 2020 & 2033
- Table 33: France Military Radars Industry Revenue (Million) Forecast, by Application 2020 & 2033
- Table 34: Italy Military Radars Industry Revenue (Million) Forecast, by Application 2020 & 2033
- Table 35: Spain Military Radars Industry Revenue (Million) Forecast, by Application 2020 & 2033
- Table 36: Russia Military Radars Industry Revenue (Million) Forecast, by Application 2020 & 2033
- Table 37: Benelux Military Radars Industry Revenue (Million) Forecast, by Application 2020 & 2033
- Table 38: Nordics Military Radars Industry Revenue (Million) Forecast, by Application 2020 & 2033
- Table 39: Rest of Europe Military Radars Industry Revenue (Million) Forecast, by Application 2020 & 2033
- Table 40: Global Military Radars Industry Revenue Million Forecast, by Production Analysis 2020 & 2033
- Table 41: Global Military Radars Industry Revenue Million Forecast, by Consumption Analysis 2020 & 2033
- Table 42: Global Military Radars Industry Revenue Million Forecast, by Import Market Analysis (Value & Volume) 2020 & 2033
- Table 43: Global Military Radars Industry Revenue Million Forecast, by Export Market Analysis (Value & Volume) 2020 & 2033
- Table 44: Global Military Radars Industry Revenue Million Forecast, by Price Trend Analysis 2020 & 2033
- Table 45: Global Military Radars Industry Revenue Million Forecast, by Country 2020 & 2033
- Table 46: Turkey Military Radars Industry Revenue (Million) Forecast, by Application 2020 & 2033
- Table 47: Israel Military Radars Industry Revenue (Million) Forecast, by Application 2020 & 2033
- Table 48: GCC Military Radars Industry Revenue (Million) Forecast, by Application 2020 & 2033
- Table 49: North Africa Military Radars Industry Revenue (Million) Forecast, by Application 2020 & 2033
- Table 50: South Africa Military Radars Industry Revenue (Million) Forecast, by Application 2020 & 2033
- Table 51: Rest of Middle East & Africa Military Radars Industry Revenue (Million) Forecast, by Application 2020 & 2033
- Table 52: Global Military Radars Industry Revenue Million Forecast, by Production Analysis 2020 & 2033
- Table 53: Global Military Radars Industry Revenue Million Forecast, by Consumption Analysis 2020 & 2033
- Table 54: Global Military Radars Industry Revenue Million Forecast, by Import Market Analysis (Value & Volume) 2020 & 2033
- Table 55: Global Military Radars Industry Revenue Million Forecast, by Export Market Analysis (Value & Volume) 2020 & 2033
- Table 56: Global Military Radars Industry Revenue Million Forecast, by Price Trend Analysis 2020 & 2033
- Table 57: Global Military Radars Industry Revenue Million Forecast, by Country 2020 & 2033
- Table 58: China Military Radars Industry Revenue (Million) Forecast, by Application 2020 & 2033
- Table 59: India Military Radars Industry Revenue (Million) Forecast, by Application 2020 & 2033
- Table 60: Japan Military Radars Industry Revenue (Million) Forecast, by Application 2020 & 2033
- Table 61: South Korea Military Radars Industry Revenue (Million) Forecast, by Application 2020 & 2033
- Table 62: ASEAN Military Radars Industry Revenue (Million) Forecast, by Application 2020 & 2033
- Table 63: Oceania Military Radars Industry Revenue (Million) Forecast, by Application 2020 & 2033
- Table 64: Rest of Asia Pacific Military Radars Industry Revenue (Million) Forecast, by Application 2020 & 2033
Frequently Asked Questions
1. What is the projected Compound Annual Growth Rate (CAGR) of the Military Radars Industry?
The projected CAGR is approximately 5.15%.
2. Which companies are prominent players in the Military Radars Industry?
Key companies in the market include THALES, Leonardo SpA, Lockheed Martin Corporation, Airbus SE, QinetiQ Group PL, Teledyne Technologies Incorporated, BAE Systems PLC, RTX Corporation, HENSOLDT Holding Germany GmbH, Israel Aerospace Industries Ltd, Northrop Grumman Corporation, Saab AB.
3. What are the main segments of the Military Radars Industry?
The market segments include Production Analysis, Consumption Analysis, Import Market Analysis (Value & Volume), Export Market Analysis (Value & Volume), Price Trend Analysis.
4. Can you provide details about the market size?
The market size is estimated to be USD 16.71 Million as of 2022.
5. What are some drivers contributing to market growth?
Increase in Internet of Things (IoT) and Autonomous Systems; Rise in Demand for Military and Defense Satellite Communication Solutions.
6. What are the notable trends driving market growth?
Airborne Segment Expected to Register the Highest CAGR During the Forecast Period.
7. Are there any restraints impacting market growth?
Cybersecurity Threats to Satellite Communication; Interference in Transmission of Data.
8. Can you provide examples of recent developments in the market?
N/A
9. What pricing options are available for accessing the report?
Pricing options include single-user, multi-user, and enterprise licenses priced at USD 4750, USD 5250, and USD 8750 respectively.
10. Is the market size provided in terms of value or volume?
The market size is provided in terms of value, measured in Million.
11. Are there any specific market keywords associated with the report?
Yes, the market keyword associated with the report is "Military Radars Industry," which aids in identifying and referencing the specific market segment covered.
12. How do I determine which pricing option suits my needs best?
The pricing options vary based on user requirements and access needs. Individual users may opt for single-user licenses, while businesses requiring broader access may choose multi-user or enterprise licenses for cost-effective access to the report.
13. Are there any additional resources or data provided in the Military Radars Industry report?
While the report offers comprehensive insights, it's advisable to review the specific contents or supplementary materials provided to ascertain if additional resources or data are available.
14. How can I stay updated on further developments or reports in the Military Radars Industry?
To stay informed about further developments, trends, and reports in the Military Radars Industry, consider subscribing to industry newsletters, following relevant companies and organizations, or regularly checking reputable industry news sources and publications.
Methodology
Step 1 - Identification of Relevant Samples Size from Population Database


Step 2 - Approaches for Defining Global Market Size (Value, Volume* & Price*)

Note*: In applicable scenarios
Step 3 - Data Sources
Primary Research
- Web Analytics
- Survey Reports
- Research Institute
- Latest Research Reports
- Opinion Leaders
Secondary Research
- Annual Reports
- White Paper
- Latest Press Release
- Industry Association
- Paid Database
- Investor Presentations

Step 4 - Data Triangulation
Involves using different sources of information in order to increase the validity of a study
These sources are likely to be stakeholders in a program - participants, other researchers, program staff, other community members, and so on.
Then we put all data in single framework & apply various statistical tools to find out the dynamic on the market.
During the analysis stage, feedback from the stakeholder groups would be compared to determine areas of agreement as well as areas of divergence