

Key Insights
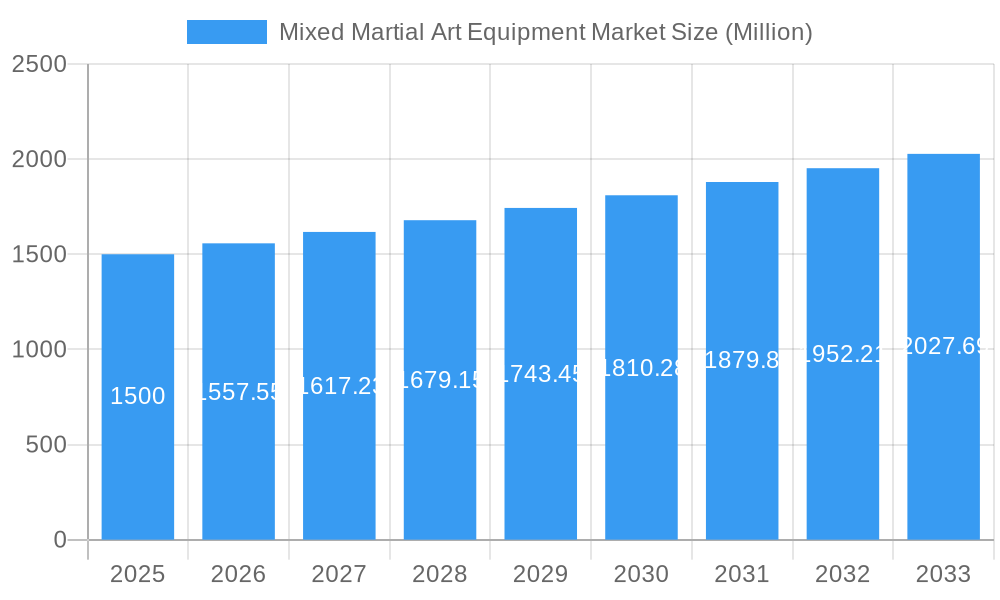
The Mixed Martial Arts (MMA) equipment market is poised for robust expansion, projected to reach 9.54 billion by 2033, with a Compound Annual Growth Rate (CAGR) of 6.9% from a base year of 2025. This growth is propelled by the escalating global popularity of MMA, increased participation across amateur and professional levels, and a heightened consumer focus on fitness and self-defense. Key growth drivers include the expanding fitness industry, greater accessibility to MMA training facilities, and the influential impact of media showcasing MMA athletes and their training methodologies. The market is segmented by product type, including MMA gloves, protective gear (ankle, knee, elbow guards), punching bags, hand wraps, shin guards, mouth guards, and headgear, and by end-user, encompassing personal and institutional use. While online retail is experiencing rapid adoption due to e-commerce growth and convenience, traditional retail stores maintain a significant presence, offering consumers the opportunity to assess product quality firsthand. Market challenges include the inherent risk of injuries in MMA training, necessitating investment in protective equipment, and the potential for fluctuating consumer interest in sports trends. Leading companies like Adidas AG and Everlast Worldwide Inc. are driving market evolution through innovations in materials and design, addressing the diverse needs of MMA practitioners.
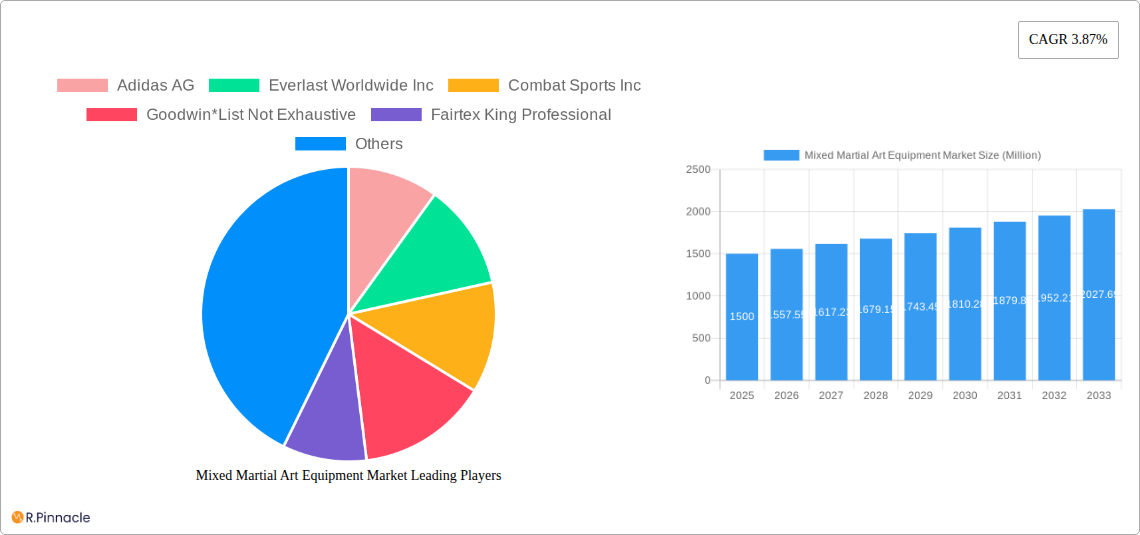
Mixed Martial Art Equipment Market Market Size (In Billion)
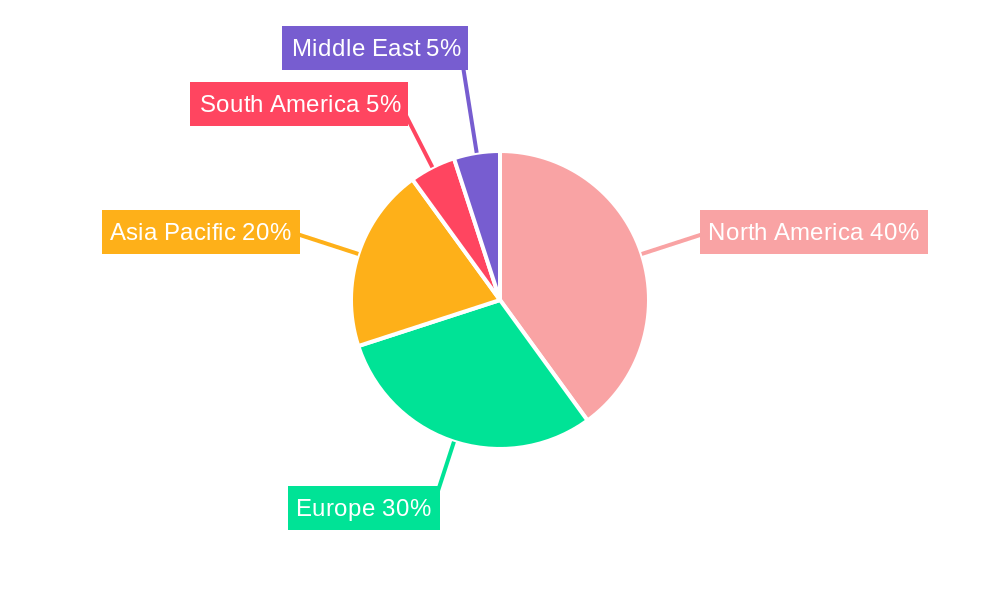
Geographically, North America and Europe currently dominate the MMA equipment market, supported by established MMA communities and strong consumer expenditure. However, the Asia-Pacific region presents substantial growth potential, driven by the increasing adoption of MMA as a sport and fitness discipline, particularly in China and India. Emerging markets in South America and the Middle East offer significant opportunities for future expansion, fueled by rising disposable incomes and growing interest in combat sports. Competitive dynamics are characterized by a blend of established brands and agile new entrants competing on product quality, innovation, and strategic marketing efforts to engage target consumer segments. This competitive landscape fosters market growth and drives product diversification.
Mixed Martial Art Equipment Market Company Market Share
Mixed Martial Art Equipment Market: A Comprehensive Report (2019-2033)
This in-depth report provides a comprehensive analysis of the Mixed Martial Art (MMA) Equipment market, offering invaluable insights for industry professionals, investors, and stakeholders. With a study period spanning 2019-2033, a base year of 2025, and a forecast period of 2025-2033, this report delivers actionable intelligence to navigate the dynamic landscape of this growing market. The report projects a market value of xx Million by 2033, showcasing significant growth opportunities.
Mixed Martial Art Equipment Market Structure & Innovation Trends
This section analyzes the competitive landscape, innovation drivers, and regulatory factors shaping the MMA equipment market. The market exhibits a moderately concentrated structure, with key players such as Adidas AG, Everlast Worldwide Inc, Combat Sports Inc, Goodwin, Fairtex King Professional, Century LLC, Twins Special Co LTD, Ringside Inc, Title Boxing LLC, and Hayabusa Fightwear Inc holding significant market share. However, the presence of numerous smaller, specialized brands indicates a competitive landscape. Market share data for 2024 reveals that the top 5 players collectively hold approximately xx% of the market, while the remaining share is distributed among numerous smaller players.
Key Aspects Analyzed:
- Market Concentration: Analysis of market share held by key players and the degree of competition.
- Innovation Drivers: Examination of technological advancements driving product development and market expansion, such as material innovations and enhanced protective features.
- Regulatory Frameworks: Assessment of safety regulations and standards impacting product design and distribution.
- Product Substitutes: Identification of alternative products and their impact on market dynamics.
- End-User Demographics: Analysis of the changing demographics of MMA participants and their influence on market demand.
- M&A Activities: Review of recent mergers and acquisitions, including their impact on market consolidation and competitive dynamics. While specific deal values are unavailable, several strategic alliances and partnerships have been observed, suggesting a trend towards consolidation in the sector.
Mixed Martial Art Equipment Market Dynamics & Trends
The MMA equipment market is experiencing robust growth, driven by increasing participation in MMA globally and a rising consumer preference for high-quality, specialized equipment. The market's Compound Annual Growth Rate (CAGR) during the historical period (2019-2024) was xx%, and is projected to maintain a CAGR of xx% during the forecast period (2025-2033). Market penetration, currently estimated at xx%, is expected to grow further, particularly in emerging markets.
This growth is fueled by several key factors:
- Rising Popularity of MMA: The global surge in MMA's popularity as a spectator sport and competitive activity is a primary driver.
- Technological Advancements: Innovations in materials and design are enhancing product performance and safety features.
- Evolving Consumer Preferences: Demand for specialized equipment tailored to specific training needs and preferences is increasing.
- Competitive Dynamics: Intense competition among established and emerging brands is driving innovation and improved product offerings.
Dominant Regions & Segments in Mixed Martial Art Equipment Market
The North American region currently holds the largest market share in the MMA equipment market, driven by high participation rates and strong consumer spending. However, significant growth potential exists in Asia-Pacific and Europe, fueled by rising disposable incomes and increasing participation in MMA.
Key Drivers by Region:
- North America: Strong established MMA culture, high consumer spending on fitness and sports equipment.
- Europe: Growing interest in MMA, coupled with increased investment in sports infrastructure.
- Asia-Pacific: Rapidly expanding MMA participation, particularly in emerging economies.
Dominant Segments:
- By Product: MMA Gloves hold the largest market share, followed by punching bags and other protective gear (ankle, knee, elbow guards, shin guards).
- By End-User: The personal-use segment dominates, but the institutional segment (gyms, training facilities) shows considerable growth potential.
- By Distribution Channel: Offline retail stores currently hold a larger market share, though online retail is experiencing rapid growth.
Mixed Martial Art Equipment Market Product Innovations
Recent innovations focus on enhancing safety, performance, and comfort. Materials like advanced polymers and breathable fabrics are being incorporated into gloves and protective gear. Technological trends like improved ergonomic designs and data-driven performance analysis are shaping product development. The market prioritizes lightweight, durable products with superior shock absorption and enhanced breathability to provide optimal protection and performance for athletes.
Report Scope & Segmentation Analysis
This report segments the MMA equipment market by product (MMA gloves, ankle/knee/elbow guards, punching bags, hand wraps, shin guards, mouth guards, headgear), end-user (personal-use, institution), and distribution channel (offline retail stores, online retail stores). Each segment's growth trajectory, market size, and competitive landscape are analyzed in detail, providing a granular view of market opportunities. Growth projections suggest that the MMA gloves segment will maintain its leading position, while online retail is projected to exhibit the highest growth rate among distribution channels.
Key Drivers of Mixed Martial Art Equipment Market Growth
The market's growth is propelled by several factors:
- Rising MMA participation: Globally, the number of MMA practitioners is increasing.
- Technological advancements: Innovations in materials and designs enhance product quality.
- Increased disposable income: Rising disposable incomes in key markets fuel demand.
- Growing health and fitness consciousness: A worldwide emphasis on fitness boosts demand for sports equipment.
Challenges in the Mixed Martial Art Equipment Market Sector
Several challenges hinder market growth:
- Counterfeit products: The prevalence of lower-quality counterfeit goods undermines market integrity.
- Supply chain disruptions: Global supply chain challenges can impact product availability and cost.
- Stringent safety regulations: Adherence to safety and quality standards increases production costs.
- Intense competition: The competitive market environment necessitates continuous innovation.
Emerging Opportunities in Mixed Martial Art Equipment Market
Several opportunities exist for growth:
- Expansion into emerging markets: Untapped potential in developing economies offers significant opportunities.
- Development of specialized equipment: Demand for specialized equipment caters to niche segments.
- Technological integration: Smart equipment and data analytics enhance user experience.
- Sustainable and eco-friendly products: Growing consumer preference for environmentally responsible products opens avenues.
Leading Players in the Mixed Martial Art Equipment Market Market
- Adidas AG
- Everlast Worldwide Inc
- Combat Sports Inc
- Goodwin
- Fairtex King Professional
- Century LLC
- Twins Special Co LTD
- Ringside Inc
- Title Boxing LLC
- Hayabusa Fightwear Inc
Key Developments in Mixed Martial Art Equipment Market Industry
- September 2022: Adidas opened a new flagship store in Warsaw, boosting brand visibility and promoting active lifestyles.
- August 2022: VENUM renewed its partnership with UFC, solidifying its position in the MMA equipment market.
- August 2021: Toyam Industries Ltd. launched MMA gear in India under the "Kumite 1" brand, expanding market reach.
Future Outlook for Mixed Martial Art Equipment Market Market
The MMA equipment market shows strong potential for future growth. Continued expansion into new markets, innovative product development, and strategic partnerships will drive market expansion. The increasing popularity of MMA and a growing focus on health and fitness will fuel demand for high-quality, specialized equipment, presenting significant opportunities for market players.
Mixed Martial Art Equipment Market Segmentation
-
1. Product
- 1.1. MMA gloves
- 1.2. Ankle/ Knee/ Elbow Guard
- 1.3. Punching Bags
- 1.4. Hand Wraps
- 1.5. Shin Guard
- 1.6. Mouth Guard
- 1.7. Head Gear
-
2. End-User
- 2.1. Personal-use
- 2.2. Institution
-
3. Distribution Channel
- 3.1. Offline Retail Stores
- 3.2. Online Retail Stores
Mixed Martial Art Equipment Market Segmentation By Geography
-
1. North America
- 1.1. United States
- 1.2. Canada
- 1.3. Mexico
- 1.4. Rest of North America
-
2. Europe
- 2.1. United Kingdom
- 2.2. Germany
- 2.3. Spain
- 2.4. France
- 2.5. Italy
- 2.6. Russia
- 2.7. Rest of Europe
-
3. Asia Pacific
- 3.1. China
- 3.2. Japan
- 3.3. India
- 3.4. Australia
- 3.5. Rest of Asia Pacific
-
4. South America
- 4.1. Brazil
- 4.2. Argentina
- 4.3. Rest of South America
- 5. Middle East
-
6. Saudi Arabia
- 6.1. South Africa
- 6.2. Rest of Middle East
Mixed Martial Art Equipment Market Regional Market Share
Geographic Coverage of Mixed Martial Art Equipment Market
Mixed Martial Art Equipment Market REPORT HIGHLIGHTS
| Aspects | Details |
|---|---|
| Study Period | 2020-2034 |
| Base Year | 2025 |
| Estimated Year | 2026 |
| Forecast Period | 2026-2034 |
| Historical Period | 2020-2025 |
| Growth Rate | CAGR of 6.9% from 2020-2034 |
| Segmentation |
|
Table of Contents
- 1. Introduction
- 1.1. Research Scope
- 1.2. Market Segmentation
- 1.3. Research Objective
- 1.4. Definitions and Assumptions
- 2. Executive Summary
- 2.1. Market Snapshot
- 3. Market Dynamics
- 3.1. Market Drivers
- 3.2. Market Restrains
- 3.3. Market Trends
- 3.4. Market Opportunities
- 4. Market Factor Analysis
- 4.1. Porters Five Forces
- 4.1.1. Bargaining Power of Suppliers
- 4.1.2. Bargaining Power of Buyers
- 4.1.3. Threat of New Entrants
- 4.1.4. Threat of Substitutes
- 4.1.5. Competitive Rivalry
- 4.2. PESTEL analysis
- 4.3. BCG Analysis
- 4.3.1. Stars (High Growth, High Market Share)
- 4.3.2. Cash Cows (Low Growth, High Market Share)
- 4.3.3. Question Mark (High Growth, Low Market Share)
- 4.3.4. Dogs (Low Growth, Low Market Share)
- 4.4. Ansoff Matrix Analysis
- 4.5. Supply Chain Analysis
- 4.6. Regulatory Landscape
- 4.7. Current Market Potential and Opportunity Assessment (TAM–SAM–SOM Framework)
- 4.8. PRI Analyst Note
- 4.1. Porters Five Forces
- 5. Market Analysis, Insights and Forecast 2021-2033
- 5.1. Market Analysis, Insights and Forecast - by Product
- 5.1.1. MMA gloves
- 5.1.2. Ankle/ Knee/ Elbow Guard
- 5.1.3. Punching Bags
- 5.1.4. Hand Wraps
- 5.1.5. Shin Guard
- 5.1.6. Mouth Guard
- 5.1.7. Head Gear
- 5.2. Market Analysis, Insights and Forecast - by End-User
- 5.2.1. Personal-use
- 5.2.2. Institution
- 5.3. Market Analysis, Insights and Forecast - by Distribution Channel
- 5.3.1. Offline Retail Stores
- 5.3.2. Online Retail Stores
- 5.4. Market Analysis, Insights and Forecast - by Region
- 5.4.1. North America
- 5.4.2. Europe
- 5.4.3. Asia Pacific
- 5.4.4. South America
- 5.4.5. Middle East
- 5.4.6. Saudi Arabia
- 5.1. Market Analysis, Insights and Forecast - by Product
- 6. Global Mixed Martial Art Equipment Market Analysis, Insights and Forecast, 2021-2033
- 6.1. Market Analysis, Insights and Forecast - by Product
- 6.1.1. MMA gloves
- 6.1.2. Ankle/ Knee/ Elbow Guard
- 6.1.3. Punching Bags
- 6.1.4. Hand Wraps
- 6.1.5. Shin Guard
- 6.1.6. Mouth Guard
- 6.1.7. Head Gear
- 6.2. Market Analysis, Insights and Forecast - by End-User
- 6.2.1. Personal-use
- 6.2.2. Institution
- 6.3. Market Analysis, Insights and Forecast - by Distribution Channel
- 6.3.1. Offline Retail Stores
- 6.3.2. Online Retail Stores
- 6.1. Market Analysis, Insights and Forecast - by Product
- 7. North America Mixed Martial Art Equipment Market Analysis, Insights and Forecast, 2020-2032
- 7.1. Market Analysis, Insights and Forecast - by Product
- 7.1.1. MMA gloves
- 7.1.2. Ankle/ Knee/ Elbow Guard
- 7.1.3. Punching Bags
- 7.1.4. Hand Wraps
- 7.1.5. Shin Guard
- 7.1.6. Mouth Guard
- 7.1.7. Head Gear
- 7.2. Market Analysis, Insights and Forecast - by End-User
- 7.2.1. Personal-use
- 7.2.2. Institution
- 7.3. Market Analysis, Insights and Forecast - by Distribution Channel
- 7.3.1. Offline Retail Stores
- 7.3.2. Online Retail Stores
- 7.1. Market Analysis, Insights and Forecast - by Product
- 8. Europe Mixed Martial Art Equipment Market Analysis, Insights and Forecast, 2020-2032
- 8.1. Market Analysis, Insights and Forecast - by Product
- 8.1.1. MMA gloves
- 8.1.2. Ankle/ Knee/ Elbow Guard
- 8.1.3. Punching Bags
- 8.1.4. Hand Wraps
- 8.1.5. Shin Guard
- 8.1.6. Mouth Guard
- 8.1.7. Head Gear
- 8.2. Market Analysis, Insights and Forecast - by End-User
- 8.2.1. Personal-use
- 8.2.2. Institution
- 8.3. Market Analysis, Insights and Forecast - by Distribution Channel
- 8.3.1. Offline Retail Stores
- 8.3.2. Online Retail Stores
- 8.1. Market Analysis, Insights and Forecast - by Product
- 9. Asia Pacific Mixed Martial Art Equipment Market Analysis, Insights and Forecast, 2020-2032
- 9.1. Market Analysis, Insights and Forecast - by Product
- 9.1.1. MMA gloves
- 9.1.2. Ankle/ Knee/ Elbow Guard
- 9.1.3. Punching Bags
- 9.1.4. Hand Wraps
- 9.1.5. Shin Guard
- 9.1.6. Mouth Guard
- 9.1.7. Head Gear
- 9.2. Market Analysis, Insights and Forecast - by End-User
- 9.2.1. Personal-use
- 9.2.2. Institution
- 9.3. Market Analysis, Insights and Forecast - by Distribution Channel
- 9.3.1. Offline Retail Stores
- 9.3.2. Online Retail Stores
- 9.1. Market Analysis, Insights and Forecast - by Product
- 10. South America Mixed Martial Art Equipment Market Analysis, Insights and Forecast, 2020-2032
- 10.1. Market Analysis, Insights and Forecast - by Product
- 10.1.1. MMA gloves
- 10.1.2. Ankle/ Knee/ Elbow Guard
- 10.1.3. Punching Bags
- 10.1.4. Hand Wraps
- 10.1.5. Shin Guard
- 10.1.6. Mouth Guard
- 10.1.7. Head Gear
- 10.2. Market Analysis, Insights and Forecast - by End-User
- 10.2.1. Personal-use
- 10.2.2. Institution
- 10.3. Market Analysis, Insights and Forecast - by Distribution Channel
- 10.3.1. Offline Retail Stores
- 10.3.2. Online Retail Stores
- 10.1. Market Analysis, Insights and Forecast - by Product
- 11. Middle East Mixed Martial Art Equipment Market Analysis, Insights and Forecast, 2020-2032
- 11.1. Market Analysis, Insights and Forecast - by Product
- 11.1.1. MMA gloves
- 11.1.2. Ankle/ Knee/ Elbow Guard
- 11.1.3. Punching Bags
- 11.1.4. Hand Wraps
- 11.1.5. Shin Guard
- 11.1.6. Mouth Guard
- 11.1.7. Head Gear
- 11.2. Market Analysis, Insights and Forecast - by End-User
- 11.2.1. Personal-use
- 11.2.2. Institution
- 11.3. Market Analysis, Insights and Forecast - by Distribution Channel
- 11.3.1. Offline Retail Stores
- 11.3.2. Online Retail Stores
- 11.1. Market Analysis, Insights and Forecast - by Product
- 12. Saudi Arabia Mixed Martial Art Equipment Market Analysis, Insights and Forecast, 2020-2032
- 12.1. Market Analysis, Insights and Forecast - by Product
- 12.1.1. MMA gloves
- 12.1.2. Ankle/ Knee/ Elbow Guard
- 12.1.3. Punching Bags
- 12.1.4. Hand Wraps
- 12.1.5. Shin Guard
- 12.1.6. Mouth Guard
- 12.1.7. Head Gear
- 12.2. Market Analysis, Insights and Forecast - by End-User
- 12.2.1. Personal-use
- 12.2.2. Institution
- 12.3. Market Analysis, Insights and Forecast - by Distribution Channel
- 12.3.1. Offline Retail Stores
- 12.3.2. Online Retail Stores
- 12.1. Market Analysis, Insights and Forecast - by Product
- 13. Competitive Analysis
- 13.1. Company Profiles
- 13.1.1 Adidas AG
- 13.1.1.1. Company Overview
- 13.1.1.2. Products
- 13.1.1.3. Company Financials
- 13.1.1.4. SWOT Analysis
- 13.1.2 Everlast Worldwide Inc
- 13.1.2.1. Company Overview
- 13.1.2.2. Products
- 13.1.2.3. Company Financials
- 13.1.2.4. SWOT Analysis
- 13.1.3 Combat Sports Inc
- 13.1.3.1. Company Overview
- 13.1.3.2. Products
- 13.1.3.3. Company Financials
- 13.1.3.4. SWOT Analysis
- 13.1.4 Goodwin*List Not Exhaustive
- 13.1.4.1. Company Overview
- 13.1.4.2. Products
- 13.1.4.3. Company Financials
- 13.1.4.4. SWOT Analysis
- 13.1.5 Fairtex King Professional
- 13.1.5.1. Company Overview
- 13.1.5.2. Products
- 13.1.5.3. Company Financials
- 13.1.5.4. SWOT Analysis
- 13.1.6 Century LLC
- 13.1.6.1. Company Overview
- 13.1.6.2. Products
- 13.1.6.3. Company Financials
- 13.1.6.4. SWOT Analysis
- 13.1.7 Twins Special Co LTD
- 13.1.7.1. Company Overview
- 13.1.7.2. Products
- 13.1.7.3. Company Financials
- 13.1.7.4. SWOT Analysis
- 13.1.8 Ringside Inc
- 13.1.8.1. Company Overview
- 13.1.8.2. Products
- 13.1.8.3. Company Financials
- 13.1.8.4. SWOT Analysis
- 13.1.9 Title Boxing LLC
- 13.1.9.1. Company Overview
- 13.1.9.2. Products
- 13.1.9.3. Company Financials
- 13.1.9.4. SWOT Analysis
- 13.1.10 Hayabusa Fightwear Inc
- 13.1.10.1. Company Overview
- 13.1.10.2. Products
- 13.1.10.3. Company Financials
- 13.1.10.4. SWOT Analysis
- 13.1.1 Adidas AG
- 13.2. Market Entropy
- 13.2.1 Company's Key Areas Served
- 13.2.2 Recent Developments
- 13.3. Company Market Share Analysis 2025
- 13.3.1 Top 5 Companies Market Share Analysis
- 13.3.2 Top 3 Companies Market Share Analysis
- 13.4. List of Potential Customers
- 14. Research Methodology
List of Figures
- Figure 1: Global Mixed Martial Art Equipment Market Revenue Breakdown (billion, %) by Region 2025 & 2033
- Figure 2: Global Mixed Martial Art Equipment Market Volume Breakdown (K Units, %) by Region 2025 & 2033
- Figure 3: North America Mixed Martial Art Equipment Market Revenue (billion), by Product 2025 & 2033
- Figure 4: North America Mixed Martial Art Equipment Market Volume (K Units), by Product 2025 & 2033
- Figure 5: North America Mixed Martial Art Equipment Market Revenue Share (%), by Product 2025 & 2033
- Figure 6: North America Mixed Martial Art Equipment Market Volume Share (%), by Product 2025 & 2033
- Figure 7: North America Mixed Martial Art Equipment Market Revenue (billion), by End-User 2025 & 2033
- Figure 8: North America Mixed Martial Art Equipment Market Volume (K Units), by End-User 2025 & 2033
- Figure 9: North America Mixed Martial Art Equipment Market Revenue Share (%), by End-User 2025 & 2033
- Figure 10: North America Mixed Martial Art Equipment Market Volume Share (%), by End-User 2025 & 2033
- Figure 11: North America Mixed Martial Art Equipment Market Revenue (billion), by Distribution Channel 2025 & 2033
- Figure 12: North America Mixed Martial Art Equipment Market Volume (K Units), by Distribution Channel 2025 & 2033
- Figure 13: North America Mixed Martial Art Equipment Market Revenue Share (%), by Distribution Channel 2025 & 2033
- Figure 14: North America Mixed Martial Art Equipment Market Volume Share (%), by Distribution Channel 2025 & 2033
- Figure 15: North America Mixed Martial Art Equipment Market Revenue (billion), by Country 2025 & 2033
- Figure 16: North America Mixed Martial Art Equipment Market Volume (K Units), by Country 2025 & 2033
- Figure 17: North America Mixed Martial Art Equipment Market Revenue Share (%), by Country 2025 & 2033
- Figure 18: North America Mixed Martial Art Equipment Market Volume Share (%), by Country 2025 & 2033
- Figure 19: Europe Mixed Martial Art Equipment Market Revenue (billion), by Product 2025 & 2033
- Figure 20: Europe Mixed Martial Art Equipment Market Volume (K Units), by Product 2025 & 2033
- Figure 21: Europe Mixed Martial Art Equipment Market Revenue Share (%), by Product 2025 & 2033
- Figure 22: Europe Mixed Martial Art Equipment Market Volume Share (%), by Product 2025 & 2033
- Figure 23: Europe Mixed Martial Art Equipment Market Revenue (billion), by End-User 2025 & 2033
- Figure 24: Europe Mixed Martial Art Equipment Market Volume (K Units), by End-User 2025 & 2033
- Figure 25: Europe Mixed Martial Art Equipment Market Revenue Share (%), by End-User 2025 & 2033
- Figure 26: Europe Mixed Martial Art Equipment Market Volume Share (%), by End-User 2025 & 2033
- Figure 27: Europe Mixed Martial Art Equipment Market Revenue (billion), by Distribution Channel 2025 & 2033
- Figure 28: Europe Mixed Martial Art Equipment Market Volume (K Units), by Distribution Channel 2025 & 2033
- Figure 29: Europe Mixed Martial Art Equipment Market Revenue Share (%), by Distribution Channel 2025 & 2033
- Figure 30: Europe Mixed Martial Art Equipment Market Volume Share (%), by Distribution Channel 2025 & 2033
- Figure 31: Europe Mixed Martial Art Equipment Market Revenue (billion), by Country 2025 & 2033
- Figure 32: Europe Mixed Martial Art Equipment Market Volume (K Units), by Country 2025 & 2033
- Figure 33: Europe Mixed Martial Art Equipment Market Revenue Share (%), by Country 2025 & 2033
- Figure 34: Europe Mixed Martial Art Equipment Market Volume Share (%), by Country 2025 & 2033
- Figure 35: Asia Pacific Mixed Martial Art Equipment Market Revenue (billion), by Product 2025 & 2033
- Figure 36: Asia Pacific Mixed Martial Art Equipment Market Volume (K Units), by Product 2025 & 2033
- Figure 37: Asia Pacific Mixed Martial Art Equipment Market Revenue Share (%), by Product 2025 & 2033
- Figure 38: Asia Pacific Mixed Martial Art Equipment Market Volume Share (%), by Product 2025 & 2033
- Figure 39: Asia Pacific Mixed Martial Art Equipment Market Revenue (billion), by End-User 2025 & 2033
- Figure 40: Asia Pacific Mixed Martial Art Equipment Market Volume (K Units), by End-User 2025 & 2033
- Figure 41: Asia Pacific Mixed Martial Art Equipment Market Revenue Share (%), by End-User 2025 & 2033
- Figure 42: Asia Pacific Mixed Martial Art Equipment Market Volume Share (%), by End-User 2025 & 2033
- Figure 43: Asia Pacific Mixed Martial Art Equipment Market Revenue (billion), by Distribution Channel 2025 & 2033
- Figure 44: Asia Pacific Mixed Martial Art Equipment Market Volume (K Units), by Distribution Channel 2025 & 2033
- Figure 45: Asia Pacific Mixed Martial Art Equipment Market Revenue Share (%), by Distribution Channel 2025 & 2033
- Figure 46: Asia Pacific Mixed Martial Art Equipment Market Volume Share (%), by Distribution Channel 2025 & 2033
- Figure 47: Asia Pacific Mixed Martial Art Equipment Market Revenue (billion), by Country 2025 & 2033
- Figure 48: Asia Pacific Mixed Martial Art Equipment Market Volume (K Units), by Country 2025 & 2033
- Figure 49: Asia Pacific Mixed Martial Art Equipment Market Revenue Share (%), by Country 2025 & 2033
- Figure 50: Asia Pacific Mixed Martial Art Equipment Market Volume Share (%), by Country 2025 & 2033
- Figure 51: South America Mixed Martial Art Equipment Market Revenue (billion), by Product 2025 & 2033
- Figure 52: South America Mixed Martial Art Equipment Market Volume (K Units), by Product 2025 & 2033
- Figure 53: South America Mixed Martial Art Equipment Market Revenue Share (%), by Product 2025 & 2033
- Figure 54: South America Mixed Martial Art Equipment Market Volume Share (%), by Product 2025 & 2033
- Figure 55: South America Mixed Martial Art Equipment Market Revenue (billion), by End-User 2025 & 2033
- Figure 56: South America Mixed Martial Art Equipment Market Volume (K Units), by End-User 2025 & 2033
- Figure 57: South America Mixed Martial Art Equipment Market Revenue Share (%), by End-User 2025 & 2033
- Figure 58: South America Mixed Martial Art Equipment Market Volume Share (%), by End-User 2025 & 2033
- Figure 59: South America Mixed Martial Art Equipment Market Revenue (billion), by Distribution Channel 2025 & 2033
- Figure 60: South America Mixed Martial Art Equipment Market Volume (K Units), by Distribution Channel 2025 & 2033
- Figure 61: South America Mixed Martial Art Equipment Market Revenue Share (%), by Distribution Channel 2025 & 2033
- Figure 62: South America Mixed Martial Art Equipment Market Volume Share (%), by Distribution Channel 2025 & 2033
- Figure 63: South America Mixed Martial Art Equipment Market Revenue (billion), by Country 2025 & 2033
- Figure 64: South America Mixed Martial Art Equipment Market Volume (K Units), by Country 2025 & 2033
- Figure 65: South America Mixed Martial Art Equipment Market Revenue Share (%), by Country 2025 & 2033
- Figure 66: South America Mixed Martial Art Equipment Market Volume Share (%), by Country 2025 & 2033
- Figure 67: Middle East Mixed Martial Art Equipment Market Revenue (billion), by Product 2025 & 2033
- Figure 68: Middle East Mixed Martial Art Equipment Market Volume (K Units), by Product 2025 & 2033
- Figure 69: Middle East Mixed Martial Art Equipment Market Revenue Share (%), by Product 2025 & 2033
- Figure 70: Middle East Mixed Martial Art Equipment Market Volume Share (%), by Product 2025 & 2033
- Figure 71: Middle East Mixed Martial Art Equipment Market Revenue (billion), by End-User 2025 & 2033
- Figure 72: Middle East Mixed Martial Art Equipment Market Volume (K Units), by End-User 2025 & 2033
- Figure 73: Middle East Mixed Martial Art Equipment Market Revenue Share (%), by End-User 2025 & 2033
- Figure 74: Middle East Mixed Martial Art Equipment Market Volume Share (%), by End-User 2025 & 2033
- Figure 75: Middle East Mixed Martial Art Equipment Market Revenue (billion), by Distribution Channel 2025 & 2033
- Figure 76: Middle East Mixed Martial Art Equipment Market Volume (K Units), by Distribution Channel 2025 & 2033
- Figure 77: Middle East Mixed Martial Art Equipment Market Revenue Share (%), by Distribution Channel 2025 & 2033
- Figure 78: Middle East Mixed Martial Art Equipment Market Volume Share (%), by Distribution Channel 2025 & 2033
- Figure 79: Middle East Mixed Martial Art Equipment Market Revenue (billion), by Country 2025 & 2033
- Figure 80: Middle East Mixed Martial Art Equipment Market Volume (K Units), by Country 2025 & 2033
- Figure 81: Middle East Mixed Martial Art Equipment Market Revenue Share (%), by Country 2025 & 2033
- Figure 82: Middle East Mixed Martial Art Equipment Market Volume Share (%), by Country 2025 & 2033
- Figure 83: Saudi Arabia Mixed Martial Art Equipment Market Revenue (billion), by Product 2025 & 2033
- Figure 84: Saudi Arabia Mixed Martial Art Equipment Market Volume (K Units), by Product 2025 & 2033
- Figure 85: Saudi Arabia Mixed Martial Art Equipment Market Revenue Share (%), by Product 2025 & 2033
- Figure 86: Saudi Arabia Mixed Martial Art Equipment Market Volume Share (%), by Product 2025 & 2033
- Figure 87: Saudi Arabia Mixed Martial Art Equipment Market Revenue (billion), by End-User 2025 & 2033
- Figure 88: Saudi Arabia Mixed Martial Art Equipment Market Volume (K Units), by End-User 2025 & 2033
- Figure 89: Saudi Arabia Mixed Martial Art Equipment Market Revenue Share (%), by End-User 2025 & 2033
- Figure 90: Saudi Arabia Mixed Martial Art Equipment Market Volume Share (%), by End-User 2025 & 2033
- Figure 91: Saudi Arabia Mixed Martial Art Equipment Market Revenue (billion), by Distribution Channel 2025 & 2033
- Figure 92: Saudi Arabia Mixed Martial Art Equipment Market Volume (K Units), by Distribution Channel 2025 & 2033
- Figure 93: Saudi Arabia Mixed Martial Art Equipment Market Revenue Share (%), by Distribution Channel 2025 & 2033
- Figure 94: Saudi Arabia Mixed Martial Art Equipment Market Volume Share (%), by Distribution Channel 2025 & 2033
- Figure 95: Saudi Arabia Mixed Martial Art Equipment Market Revenue (billion), by Country 2025 & 2033
- Figure 96: Saudi Arabia Mixed Martial Art Equipment Market Volume (K Units), by Country 2025 & 2033
- Figure 97: Saudi Arabia Mixed Martial Art Equipment Market Revenue Share (%), by Country 2025 & 2033
- Figure 98: Saudi Arabia Mixed Martial Art Equipment Market Volume Share (%), by Country 2025 & 2033
List of Tables
- Table 1: Global Mixed Martial Art Equipment Market Revenue billion Forecast, by Product 2020 & 2033
- Table 2: Global Mixed Martial Art Equipment Market Volume K Units Forecast, by Product 2020 & 2033
- Table 3: Global Mixed Martial Art Equipment Market Revenue billion Forecast, by End-User 2020 & 2033
- Table 4: Global Mixed Martial Art Equipment Market Volume K Units Forecast, by End-User 2020 & 2033
- Table 5: Global Mixed Martial Art Equipment Market Revenue billion Forecast, by Distribution Channel 2020 & 2033
- Table 6: Global Mixed Martial Art Equipment Market Volume K Units Forecast, by Distribution Channel 2020 & 2033
- Table 7: Global Mixed Martial Art Equipment Market Revenue billion Forecast, by Region 2020 & 2033
- Table 8: Global Mixed Martial Art Equipment Market Volume K Units Forecast, by Region 2020 & 2033
- Table 9: Global Mixed Martial Art Equipment Market Revenue billion Forecast, by Product 2020 & 2033
- Table 10: Global Mixed Martial Art Equipment Market Volume K Units Forecast, by Product 2020 & 2033
- Table 11: Global Mixed Martial Art Equipment Market Revenue billion Forecast, by End-User 2020 & 2033
- Table 12: Global Mixed Martial Art Equipment Market Volume K Units Forecast, by End-User 2020 & 2033
- Table 13: Global Mixed Martial Art Equipment Market Revenue billion Forecast, by Distribution Channel 2020 & 2033
- Table 14: Global Mixed Martial Art Equipment Market Volume K Units Forecast, by Distribution Channel 2020 & 2033
- Table 15: Global Mixed Martial Art Equipment Market Revenue billion Forecast, by Country 2020 & 2033
- Table 16: Global Mixed Martial Art Equipment Market Volume K Units Forecast, by Country 2020 & 2033
- Table 17: United States Mixed Martial Art Equipment Market Revenue (billion) Forecast, by Application 2020 & 2033
- Table 18: United States Mixed Martial Art Equipment Market Volume (K Units) Forecast, by Application 2020 & 2033
- Table 19: Canada Mixed Martial Art Equipment Market Revenue (billion) Forecast, by Application 2020 & 2033
- Table 20: Canada Mixed Martial Art Equipment Market Volume (K Units) Forecast, by Application 2020 & 2033
- Table 21: Mexico Mixed Martial Art Equipment Market Revenue (billion) Forecast, by Application 2020 & 2033
- Table 22: Mexico Mixed Martial Art Equipment Market Volume (K Units) Forecast, by Application 2020 & 2033
- Table 23: Rest of North America Mixed Martial Art Equipment Market Revenue (billion) Forecast, by Application 2020 & 2033
- Table 24: Rest of North America Mixed Martial Art Equipment Market Volume (K Units) Forecast, by Application 2020 & 2033
- Table 25: Global Mixed Martial Art Equipment Market Revenue billion Forecast, by Product 2020 & 2033
- Table 26: Global Mixed Martial Art Equipment Market Volume K Units Forecast, by Product 2020 & 2033
- Table 27: Global Mixed Martial Art Equipment Market Revenue billion Forecast, by End-User 2020 & 2033
- Table 28: Global Mixed Martial Art Equipment Market Volume K Units Forecast, by End-User 2020 & 2033
- Table 29: Global Mixed Martial Art Equipment Market Revenue billion Forecast, by Distribution Channel 2020 & 2033
- Table 30: Global Mixed Martial Art Equipment Market Volume K Units Forecast, by Distribution Channel 2020 & 2033
- Table 31: Global Mixed Martial Art Equipment Market Revenue billion Forecast, by Country 2020 & 2033
- Table 32: Global Mixed Martial Art Equipment Market Volume K Units Forecast, by Country 2020 & 2033
- Table 33: United Kingdom Mixed Martial Art Equipment Market Revenue (billion) Forecast, by Application 2020 & 2033
- Table 34: United Kingdom Mixed Martial Art Equipment Market Volume (K Units) Forecast, by Application 2020 & 2033
- Table 35: Germany Mixed Martial Art Equipment Market Revenue (billion) Forecast, by Application 2020 & 2033
- Table 36: Germany Mixed Martial Art Equipment Market Volume (K Units) Forecast, by Application 2020 & 2033
- Table 37: Spain Mixed Martial Art Equipment Market Revenue (billion) Forecast, by Application 2020 & 2033
- Table 38: Spain Mixed Martial Art Equipment Market Volume (K Units) Forecast, by Application 2020 & 2033
- Table 39: France Mixed Martial Art Equipment Market Revenue (billion) Forecast, by Application 2020 & 2033
- Table 40: France Mixed Martial Art Equipment Market Volume (K Units) Forecast, by Application 2020 & 2033
- Table 41: Italy Mixed Martial Art Equipment Market Revenue (billion) Forecast, by Application 2020 & 2033
- Table 42: Italy Mixed Martial Art Equipment Market Volume (K Units) Forecast, by Application 2020 & 2033
- Table 43: Russia Mixed Martial Art Equipment Market Revenue (billion) Forecast, by Application 2020 & 2033
- Table 44: Russia Mixed Martial Art Equipment Market Volume (K Units) Forecast, by Application 2020 & 2033
- Table 45: Rest of Europe Mixed Martial Art Equipment Market Revenue (billion) Forecast, by Application 2020 & 2033
- Table 46: Rest of Europe Mixed Martial Art Equipment Market Volume (K Units) Forecast, by Application 2020 & 2033
- Table 47: Global Mixed Martial Art Equipment Market Revenue billion Forecast, by Product 2020 & 2033
- Table 48: Global Mixed Martial Art Equipment Market Volume K Units Forecast, by Product 2020 & 2033
- Table 49: Global Mixed Martial Art Equipment Market Revenue billion Forecast, by End-User 2020 & 2033
- Table 50: Global Mixed Martial Art Equipment Market Volume K Units Forecast, by End-User 2020 & 2033
- Table 51: Global Mixed Martial Art Equipment Market Revenue billion Forecast, by Distribution Channel 2020 & 2033
- Table 52: Global Mixed Martial Art Equipment Market Volume K Units Forecast, by Distribution Channel 2020 & 2033
- Table 53: Global Mixed Martial Art Equipment Market Revenue billion Forecast, by Country 2020 & 2033
- Table 54: Global Mixed Martial Art Equipment Market Volume K Units Forecast, by Country 2020 & 2033
- Table 55: China Mixed Martial Art Equipment Market Revenue (billion) Forecast, by Application 2020 & 2033
- Table 56: China Mixed Martial Art Equipment Market Volume (K Units) Forecast, by Application 2020 & 2033
- Table 57: Japan Mixed Martial Art Equipment Market Revenue (billion) Forecast, by Application 2020 & 2033
- Table 58: Japan Mixed Martial Art Equipment Market Volume (K Units) Forecast, by Application 2020 & 2033
- Table 59: India Mixed Martial Art Equipment Market Revenue (billion) Forecast, by Application 2020 & 2033
- Table 60: India Mixed Martial Art Equipment Market Volume (K Units) Forecast, by Application 2020 & 2033
- Table 61: Australia Mixed Martial Art Equipment Market Revenue (billion) Forecast, by Application 2020 & 2033
- Table 62: Australia Mixed Martial Art Equipment Market Volume (K Units) Forecast, by Application 2020 & 2033
- Table 63: Rest of Asia Pacific Mixed Martial Art Equipment Market Revenue (billion) Forecast, by Application 2020 & 2033
- Table 64: Rest of Asia Pacific Mixed Martial Art Equipment Market Volume (K Units) Forecast, by Application 2020 & 2033
- Table 65: Global Mixed Martial Art Equipment Market Revenue billion Forecast, by Product 2020 & 2033
- Table 66: Global Mixed Martial Art Equipment Market Volume K Units Forecast, by Product 2020 & 2033
- Table 67: Global Mixed Martial Art Equipment Market Revenue billion Forecast, by End-User 2020 & 2033
- Table 68: Global Mixed Martial Art Equipment Market Volume K Units Forecast, by End-User 2020 & 2033
- Table 69: Global Mixed Martial Art Equipment Market Revenue billion Forecast, by Distribution Channel 2020 & 2033
- Table 70: Global Mixed Martial Art Equipment Market Volume K Units Forecast, by Distribution Channel 2020 & 2033
- Table 71: Global Mixed Martial Art Equipment Market Revenue billion Forecast, by Country 2020 & 2033
- Table 72: Global Mixed Martial Art Equipment Market Volume K Units Forecast, by Country 2020 & 2033
- Table 73: Brazil Mixed Martial Art Equipment Market Revenue (billion) Forecast, by Application 2020 & 2033
- Table 74: Brazil Mixed Martial Art Equipment Market Volume (K Units) Forecast, by Application 2020 & 2033
- Table 75: Argentina Mixed Martial Art Equipment Market Revenue (billion) Forecast, by Application 2020 & 2033
- Table 76: Argentina Mixed Martial Art Equipment Market Volume (K Units) Forecast, by Application 2020 & 2033
- Table 77: Rest of South America Mixed Martial Art Equipment Market Revenue (billion) Forecast, by Application 2020 & 2033
- Table 78: Rest of South America Mixed Martial Art Equipment Market Volume (K Units) Forecast, by Application 2020 & 2033
- Table 79: Global Mixed Martial Art Equipment Market Revenue billion Forecast, by Product 2020 & 2033
- Table 80: Global Mixed Martial Art Equipment Market Volume K Units Forecast, by Product 2020 & 2033
- Table 81: Global Mixed Martial Art Equipment Market Revenue billion Forecast, by End-User 2020 & 2033
- Table 82: Global Mixed Martial Art Equipment Market Volume K Units Forecast, by End-User 2020 & 2033
- Table 83: Global Mixed Martial Art Equipment Market Revenue billion Forecast, by Distribution Channel 2020 & 2033
- Table 84: Global Mixed Martial Art Equipment Market Volume K Units Forecast, by Distribution Channel 2020 & 2033
- Table 85: Global Mixed Martial Art Equipment Market Revenue billion Forecast, by Country 2020 & 2033
- Table 86: Global Mixed Martial Art Equipment Market Volume K Units Forecast, by Country 2020 & 2033
- Table 87: Global Mixed Martial Art Equipment Market Revenue billion Forecast, by Product 2020 & 2033
- Table 88: Global Mixed Martial Art Equipment Market Volume K Units Forecast, by Product 2020 & 2033
- Table 89: Global Mixed Martial Art Equipment Market Revenue billion Forecast, by End-User 2020 & 2033
- Table 90: Global Mixed Martial Art Equipment Market Volume K Units Forecast, by End-User 2020 & 2033
- Table 91: Global Mixed Martial Art Equipment Market Revenue billion Forecast, by Distribution Channel 2020 & 2033
- Table 92: Global Mixed Martial Art Equipment Market Volume K Units Forecast, by Distribution Channel 2020 & 2033
- Table 93: Global Mixed Martial Art Equipment Market Revenue billion Forecast, by Country 2020 & 2033
- Table 94: Global Mixed Martial Art Equipment Market Volume K Units Forecast, by Country 2020 & 2033
- Table 95: South Africa Mixed Martial Art Equipment Market Revenue (billion) Forecast, by Application 2020 & 2033
- Table 96: South Africa Mixed Martial Art Equipment Market Volume (K Units) Forecast, by Application 2020 & 2033
- Table 97: Rest of Middle East Mixed Martial Art Equipment Market Revenue (billion) Forecast, by Application 2020 & 2033
- Table 98: Rest of Middle East Mixed Martial Art Equipment Market Volume (K Units) Forecast, by Application 2020 & 2033
Frequently Asked Questions
1. What is the projected Compound Annual Growth Rate (CAGR) of the Mixed Martial Art Equipment Market?
The projected CAGR is approximately 6.9%.
2. Which companies are prominent players in the Mixed Martial Art Equipment Market?
Key companies in the market include Adidas AG, Everlast Worldwide Inc, Combat Sports Inc, Goodwin*List Not Exhaustive, Fairtex King Professional, Century LLC, Twins Special Co LTD, Ringside Inc, Title Boxing LLC, Hayabusa Fightwear Inc.
3. What are the main segments of the Mixed Martial Art Equipment Market?
The market segments include Product, End-User, Distribution Channel.
4. Can you provide details about the market size?
The market size is estimated to be USD 9.54 billion as of 2022.
5. What are some drivers contributing to market growth?
Increase in Sports Participation; Trend of Athleisure.
6. What are the notable trends driving market growth?
Rising number of people participating in combat sports.
7. Are there any restraints impacting market growth?
Availability of Fake and Counterfeit Products.
8. Can you provide examples of recent developments in the market?
In September 2022, Adidas opened its new flagship store for Central and Eastern Europe in Warsaw. Generally, the store has created a space that is accessible to fans of an active lifestyle, as well as temporary sports installations to promote an active lifestyle.
9. What pricing options are available for accessing the report?
Pricing options include single-user, multi-user, and enterprise licenses priced at USD 4750, USD 5250, and USD 8750 respectively.
10. Is the market size provided in terms of value or volume?
The market size is provided in terms of value, measured in billion and volume, measured in K Units.
11. Are there any specific market keywords associated with the report?
Yes, the market keyword associated with the report is "Mixed Martial Art Equipment Market," which aids in identifying and referencing the specific market segment covered.
12. How do I determine which pricing option suits my needs best?
The pricing options vary based on user requirements and access needs. Individual users may opt for single-user licenses, while businesses requiring broader access may choose multi-user or enterprise licenses for cost-effective access to the report.
13. Are there any additional resources or data provided in the Mixed Martial Art Equipment Market report?
While the report offers comprehensive insights, it's advisable to review the specific contents or supplementary materials provided to ascertain if additional resources or data are available.
14. How can I stay updated on further developments or reports in the Mixed Martial Art Equipment Market?
To stay informed about further developments, trends, and reports in the Mixed Martial Art Equipment Market, consider subscribing to industry newsletters, following relevant companies and organizations, or regularly checking reputable industry news sources and publications.
Methodology
Step 1 - Identification of Relevant Samples Size from Population Database


Step 2 - Approaches for Defining Global Market Size (Value, Volume* & Price*)

Note*: In applicable scenarios
Step 3 - Data Sources
Primary Research
- Web Analytics
- Survey Reports
- Research Institute
- Latest Research Reports
- Opinion Leaders
Secondary Research
- Annual Reports
- White Paper
- Latest Press Release
- Industry Association
- Paid Database
- Investor Presentations

Step 4 - Data Triangulation
Involves using different sources of information in order to increase the validity of a study
These sources are likely to be stakeholders in a program - participants, other researchers, program staff, other community members, and so on.
Then we put all data in single framework & apply various statistical tools to find out the dynamic on the market.
During the analysis stage, feedback from the stakeholder groups would be compared to determine areas of agreement as well as areas of divergence