

Key Insights
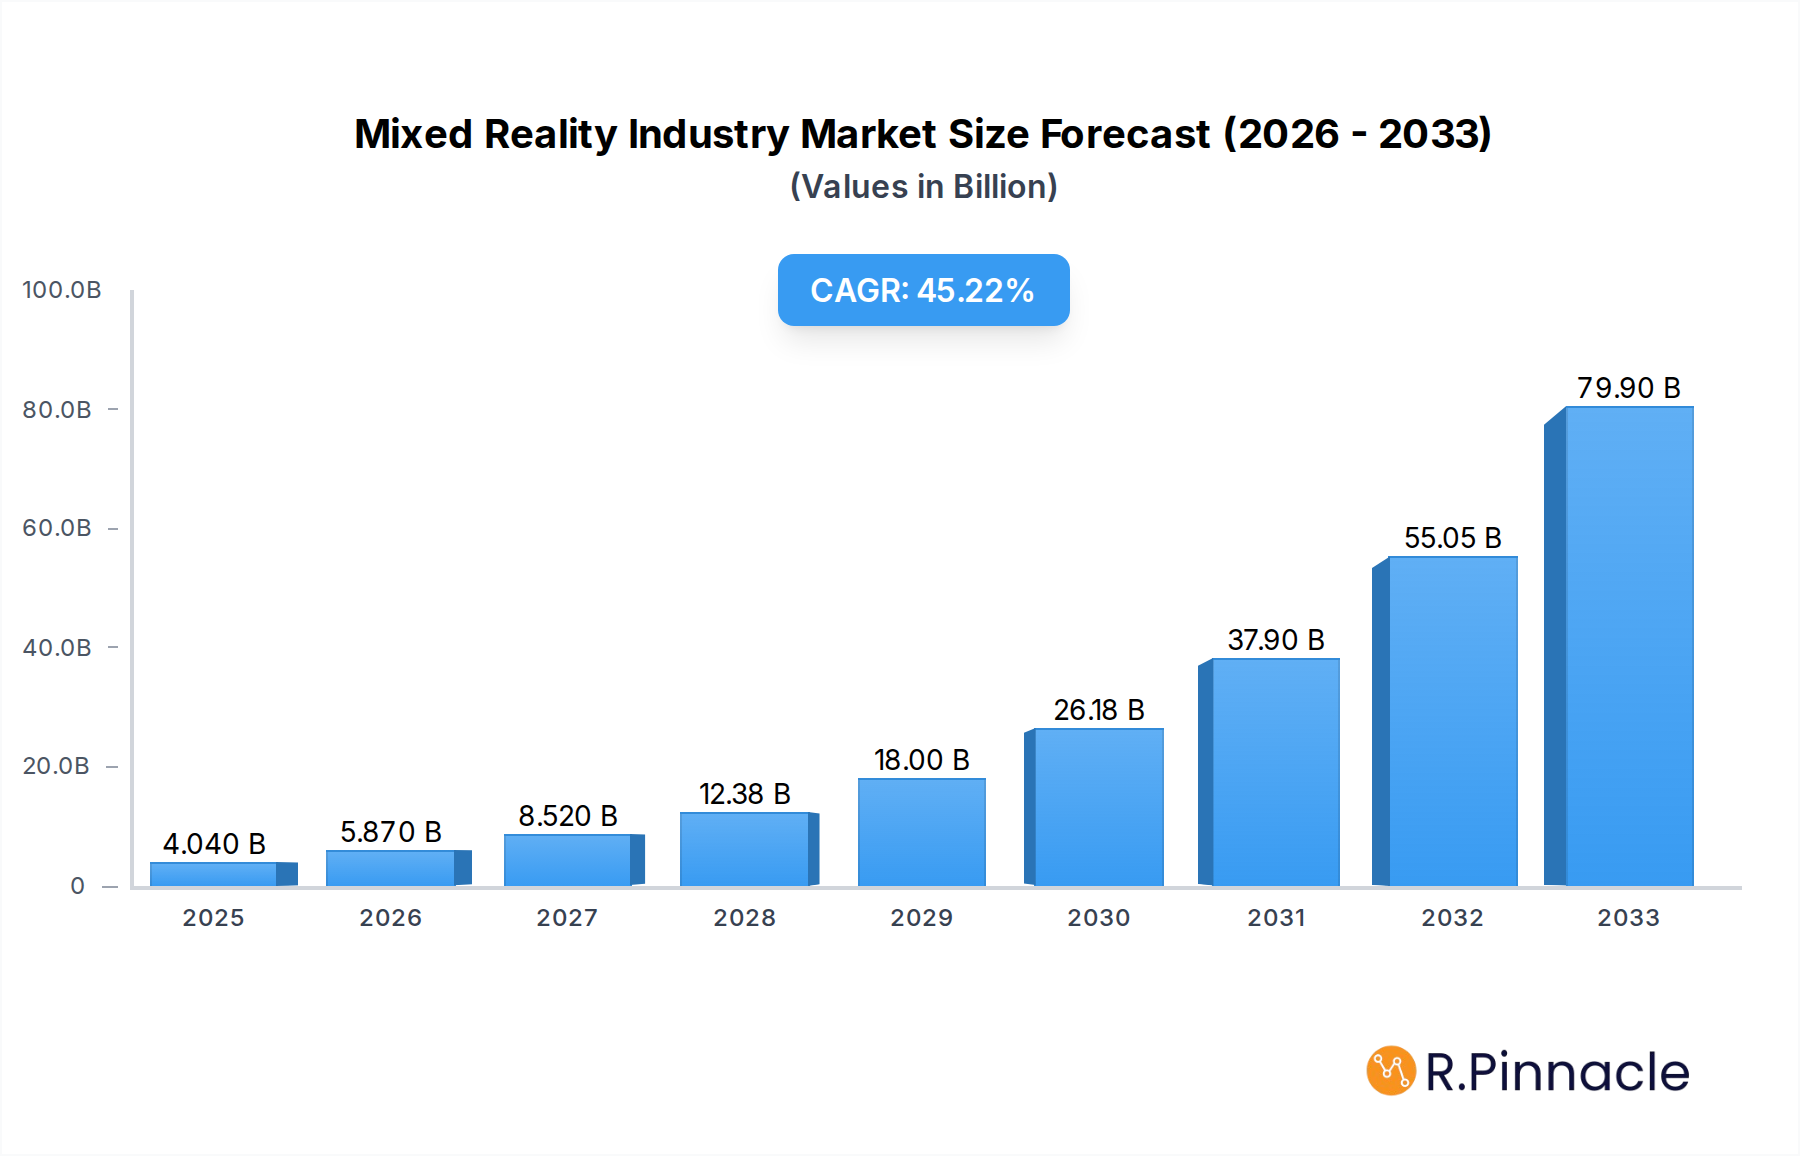
The Mixed Reality (MR) industry is poised for explosive growth, with a current market size estimated at $4,040 million. This burgeoning sector is projected to witness a remarkable CAGR of 45.34% over the forecast period of 2025-2033. This exceptional growth trajectory is fueled by a confluence of powerful drivers, including advancements in hardware capabilities, increasing adoption across diverse end-user verticals, and a growing demand for immersive digital experiences. The development of more sophisticated headsets, enhanced spatial computing, and the integration of AI are significantly lowering barriers to entry and expanding the practical applications of MR. Early adoption in sectors like entertainment and gaming is rapidly evolving, paving the way for more substantial integration into professional fields such as engineering, healthcare, and education, where MR offers unprecedented opportunities for training, simulation, and remote collaboration. The increasing availability of compelling MR content and platforms further accelerates this adoption cycle.

Mixed Reality Industry Market Size (In Billion)
Despite the immense potential, certain restraints could influence the pace of widespread adoption. High initial hardware costs, though decreasing, remain a concern for mass-market penetration. Additionally, the development of robust and intuitive user interfaces, along with the need for standardized development tools, are critical areas for continued innovation. Regulatory considerations and data privacy concerns, particularly in enterprise and healthcare applications, will also require careful navigation. However, the overwhelming positive trends, including significant investments from major technology players like Samsung Electronics, Microsoft, and Meta Platforms, alongside a surge in innovative startups such as Magic Leap and Amber Garage (Holokit), indicate a strong commitment to overcoming these challenges. The market's segmentation by end-user verticals, with education, engineering, entertainment, and healthcare emerging as key growth areas, highlights the versatility and transformative potential of mixed reality technology across the global economy.
Mixed Reality Industry Company Market Share
Mixed Reality Industry Market Research Report: Unveiling the Future of Immersive Experiences
Explore the rapidly evolving Mixed Reality (MR) industry with our comprehensive market research report. Spanning from 2019 to 2033, this in-depth analysis provides critical insights into market structure, dynamics, innovations, and future potential. Leveraging high-ranking keywords like "mixed reality market," "augmented reality," "virtual reality," "XR technology," "immersive technology," and "metaverse," this report is meticulously crafted for industry professionals seeking to navigate and capitalize on this transformative sector.
Mixed Reality Industry Market Structure & Innovation Trends
The mixed reality industry is characterized by a dynamic market structure with both established tech giants and innovative startups vying for market share. Key players like Microsoft Corporation, Meta Platform Inc, Samsung Electronics Company Limited, and Magic Leap Inc dominate significant portions of the market. Innovation is primarily driven by advancements in display technology, sensor accuracy, and processing power, enabling more realistic and interactive MR experiences. Regulatory frameworks are still evolving, with a focus on data privacy and user safety. Product substitutes, though nascent, include advanced AR applications and highly immersive VR systems. End-user demographics are broadening, with increasing adoption across professional and consumer segments. Mergers and acquisitions (M&A) activity, such as potential deals valued in the hundreds of millions, continues to shape the competitive landscape as companies seek to acquire cutting-edge technology and talent. Market concentration varies across sub-segments, with hardware manufacturing showing higher consolidation compared to content creation. The interplay between hardware and software innovation remains a crucial determinant of market leadership and overall industry growth. Understanding these structural elements is paramount for strategic decision-making in this high-growth sector.
Mixed Reality Industry Market Dynamics & Trends
The mixed reality market is poised for exponential growth, driven by a confluence of technological advancements, increasing consumer and enterprise adoption, and a burgeoning metaverse ecosystem. The market is projected to witness a Compound Annual Growth Rate (CAGR) of approximately 35% over the forecast period (2025-2033). Technological disruptions, including the miniaturization of optics, enhanced haptic feedback, and AI-powered spatial understanding, are continuously pushing the boundaries of what's possible in MR. Consumer preferences are shifting towards more intuitive and seamless immersive experiences, with a growing demand for entertainment, gaming, and social interaction applications. Enterprise adoption is accelerating across various verticals, including education, engineering, and healthcare, as businesses recognize the value of MR for training, design, remote collaboration, and patient care. Competitive dynamics are intense, with companies investing heavily in R&D and strategic partnerships to gain a competitive edge. Market penetration is still in its early stages, presenting significant opportunities for early adopters and innovators. The increasing affordability and accessibility of MR hardware, coupled with the development of compelling content and applications, will further fuel market expansion. The convergence of MR with other emerging technologies, such as 5G and edge computing, will unlock new use cases and redefine the immersive digital landscape. The integration of sophisticated AI algorithms for object recognition, scene understanding, and personalized user experiences will be a key differentiator for market leaders.
Dominant Regions & Segments in Mixed Reality Industry
The North America region stands as the dominant force in the Mixed Reality industry, driven by robust technological infrastructure, significant venture capital investments, and a high concentration of leading MR technology companies. Within North America, the United States spearheads innovation and adoption.
- Economic Policies & Funding: Strong government support for R&D, coupled with substantial private investment in XR (Extended Reality) startups, fuels rapid development and market expansion. The availability of venture capital is critical for the growth of emerging MR companies.
- Infrastructure Development: Advanced telecommunications networks, including 5G deployment, are crucial for enabling low-latency, high-fidelity MR experiences, particularly for remote collaboration and real-time data streaming.
- Technological Hubs: The presence of established tech giants and research institutions in regions like Silicon Valley fosters a fertile ground for talent acquisition and breakthrough innovations.
Among the End-user Verticals, Engineering and Entertainment are currently leading the charge in MR adoption.
- Engineering: MR applications in engineering are revolutionizing product design, prototyping, and maintenance. Engineers utilize MR for visualizing complex 3D models, conducting virtual walkthroughs of construction sites, and providing remote assistance for field technicians. This leads to reduced design cycles, improved accuracy, and significant cost savings. The market size in this segment is projected to reach several hundred million by the base year, with robust growth anticipated throughout the forecast period.
- Entertainment: The entertainment sector is experiencing a surge in MR adoption for immersive gaming, interactive storytelling, and enhanced live event experiences. Companies are leveraging MR to create unique and engaging content that blurs the lines between the physical and digital worlds. This segment also contributes significantly to the overall market size and is expected to see substantial growth as consumer-grade MR hardware becomes more accessible and sophisticated.
While Education and Healthcare are also experiencing significant growth, their adoption rates are gradually catching up to the pioneering sectors, presenting substantial future expansion opportunities.
Mixed Reality Industry Product Innovations
Product innovations in the mixed reality industry are rapidly transforming user experiences. Developments focus on lighter, more comfortable headsets with wider fields of view, improved display resolutions (e.g., micro-OLEDs), and advanced spatial tracking for seamless interaction. The integration of AI for gesture recognition and environmental understanding enhances intuitiveness. Applications are diversifying beyond gaming and entertainment to include sophisticated enterprise solutions for design visualization, remote assistance, surgical training, and educational simulations. These innovations offer significant competitive advantages by providing more immersive, efficient, and cost-effective solutions for a wide range of industries.
Report Scope & Segmentation Analysis
This report segments the Mixed Reality Industry by End-user Verticals: Education, Engineering, Entertainment, Healthcare, and Other End-user Verticals.
- Education: Projected to grow significantly as MR offers immersive learning experiences and virtual field trips, enhancing student engagement and comprehension. Market size is expected to reach over fifty million by 2025.
- Engineering: A leading segment driven by MR's utility in design, simulation, and remote collaboration, offering substantial efficiency gains. Projected market size exceeds one hundred million by 2025.
- Entertainment: Continues to be a major driver, fueled by immersive gaming, interactive media, and enhanced live events. Significant growth is anticipated, with a projected market size in the hundreds of millions.
- Healthcare: Demonstrating rapid growth due to applications in surgical training, patient education, and remote diagnostics. This segment is projected to expand substantially, reaching tens of millions in market size.
- Other End-user Verticals: Encompasses diverse applications in retail, manufacturing, and logistics, showing promising growth as businesses explore MR for operational improvements.
Key Drivers of Mixed Reality Industry Growth
The growth of the Mixed Reality industry is propelled by several key factors. Technologically, advancements in high-resolution displays, precise spatial tracking sensors, and powerful mobile processors are crucial. Economically, increasing investments from both venture capital and corporate R&D budgets are fueling innovation and market expansion, with billions of dollars being injected annually. Regulatory support, though still developing, is beginning to focus on enabling innovation while addressing privacy concerns. The increasing availability of affordable and powerful hardware, coupled with a growing ecosystem of compelling applications and content, further stimulates demand across consumer and enterprise sectors.
Challenges in the Mixed Reality Industry Sector
Despite its promising outlook, the Mixed Reality industry faces several challenges. Regulatory hurdles, particularly concerning data privacy and user safety in immersive environments, can slow down adoption. Supply chain issues for specialized components can impact hardware production and availability. High development costs for advanced MR content and applications remain a barrier for some businesses. Intense competitive pressures among major players necessitate continuous innovation and significant R&D investment. Furthermore, overcoming user adoption inertia and ensuring widespread accessibility beyond early adopters is a significant challenge.
Emerging Opportunities in Mixed Reality Industry
Emerging opportunities in the Mixed Reality industry are vast and multifaceted. The continued development of the metaverse presents a significant avenue for growth, enabling new forms of social interaction, commerce, and entertainment. Advancements in haptic feedback technology offer the potential for more realistic and engaging sensory experiences. The expansion of MR into nascent markets, such as developing nations, presents untapped potential. Furthermore, the increasing integration of AI and machine learning with MR will unlock personalized and adaptive immersive experiences, driving further innovation and market expansion.
Leading Players in the Mixed Reality Industry Market
- Samsung Electronics Company Limited
- Acer Inc
- Hewlett Packard Enterprise Company
- Magic Leap Inc
- Amber Garage (Holokit)
- Microsoft Corporation
- AsusTek Computer Inc
- Meta Platform Inc
- Dell Technologies Inc
- Occipital Inc
Key Developments in Mixed Reality Industry Industry
- 2023: Meta Platforms launches Quest 3, featuring a significant leap in mixed reality capabilities and affordability, driving consumer adoption.
- 2023: Apple unveils Apple Vision Pro, setting a new benchmark for spatial computing and premium mixed reality experiences, signaling increased competition in the high-end market.
- 2024: Microsoft enhances its HoloLens platform with enterprise-focused software updates, expanding its use cases in industrial settings and remote assistance.
- 2024: Magic Leap secures substantial new funding, indicating continued investment and development in its enterprise-grade mixed reality solutions.
- 2025: Samsung Electronics announces plans to explore a new generation of AR/MR glasses, potentially leveraging their display technology expertise to challenge existing market leaders.
Future Outlook for Mixed Reality Industry Market
The future outlook for the Mixed Reality industry is exceptionally bright, with continued exponential growth anticipated throughout the forecast period. Innovations in hardware, software, and content creation will drive deeper immersion and broader application across all sectors. The increasing maturity of the metaverse and the convergence of MR with other emerging technologies like AI and 5G will unlock unprecedented opportunities for innovation and market expansion. Strategic collaborations and ongoing R&D investments will solidify the industry's trajectory towards becoming a mainstream computing platform, revolutionizing how we work, learn, and play.
Mixed Reality Industry Segmentation
-
1. End-user Verticals
- 1.1. Education
- 1.2. Engineering
- 1.3. Entertainment
- 1.4. Healthcare
- 1.5. Other End-user Verticals
Mixed Reality Industry Segmentation By Geography
-
1. North America
- 1.1. United States
- 1.2. Canada
-
2. Europe
- 2.1. United Kingdom
- 2.2. France
- 2.3. Rest of Europe
-
3. Asia Pacific
- 3.1. China
- 3.2. India
- 3.3. Japan
- 3.4. Rest of Asia Pacific
- 4. Rest of the World
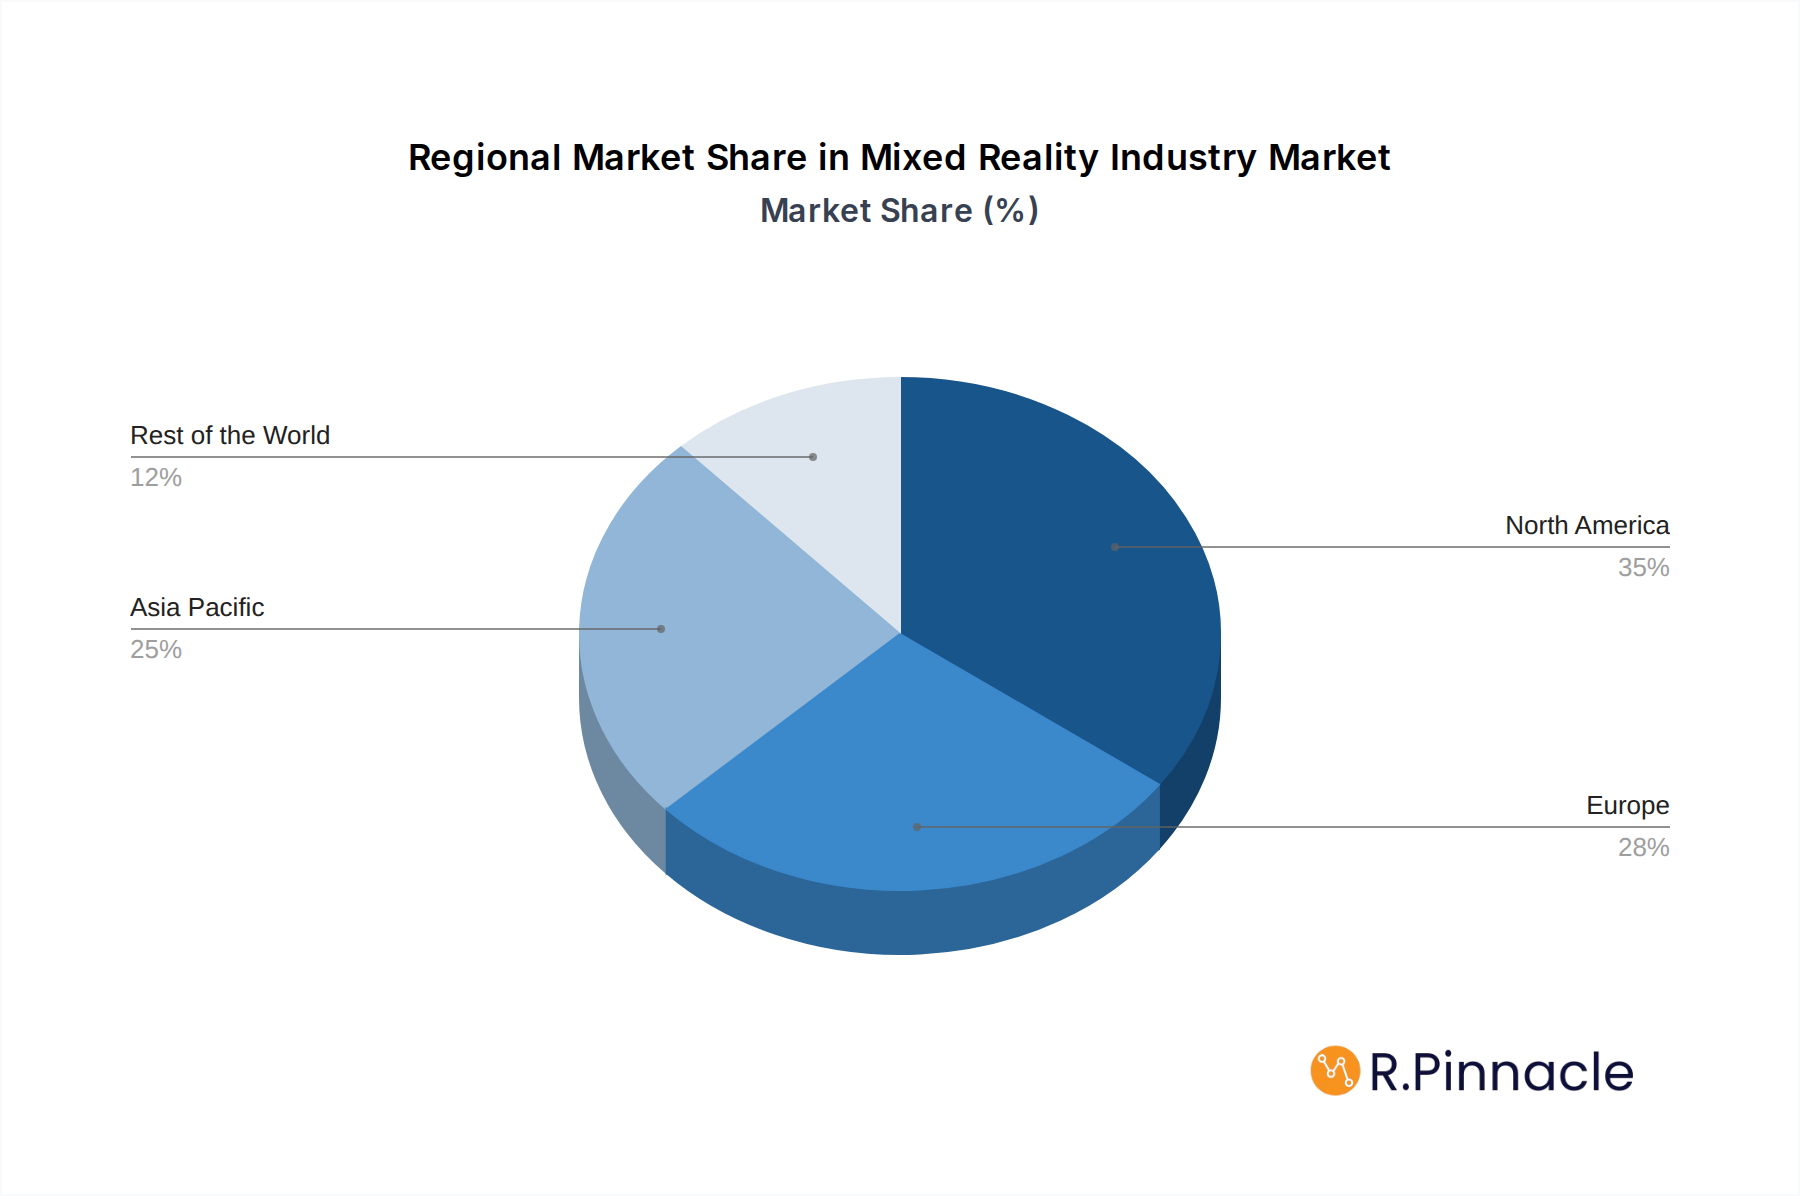
Mixed Reality Industry Regional Market Share
Geographic Coverage of Mixed Reality Industry
Mixed Reality Industry REPORT HIGHLIGHTS
| Aspects | Details |
|---|---|
| Study Period | 2020-2034 |
| Base Year | 2025 |
| Estimated Year | 2026 |
| Forecast Period | 2026-2034 |
| Historical Period | 2020-2025 |
| Growth Rate | CAGR of 45.34% from 2020-2034 |
| Segmentation |
|
Table of Contents
- 1. Introduction
- 1.1. Research Scope
- 1.2. Market Segmentation
- 1.3. Research Objective
- 1.4. Definitions and Assumptions
- 2. Executive Summary
- 2.1. Market Snapshot
- 3. Market Dynamics
- 3.1. Market Drivers
- 3.2. Market Restrains
- 3.3. Market Trends
- 3.4. Market Opportunities
- 4. Market Factor Analysis
- 4.1. Porters Five Forces
- 4.1.1. Bargaining Power of Suppliers
- 4.1.2. Bargaining Power of Buyers
- 4.1.3. Threat of New Entrants
- 4.1.4. Threat of Substitutes
- 4.1.5. Competitive Rivalry
- 4.2. PESTEL analysis
- 4.3. BCG Analysis
- 4.3.1. Stars (High Growth, High Market Share)
- 4.3.2. Cash Cows (Low Growth, High Market Share)
- 4.3.3. Question Mark (High Growth, Low Market Share)
- 4.3.4. Dogs (Low Growth, Low Market Share)
- 4.4. Ansoff Matrix Analysis
- 4.5. Supply Chain Analysis
- 4.6. Regulatory Landscape
- 4.7. Current Market Potential and Opportunity Assessment (TAM–SAM–SOM Framework)
- 4.8. PRI Analyst Note
- 4.1. Porters Five Forces
- 5. Market Analysis, Insights and Forecast 2021-2033
- 5.1. Market Analysis, Insights and Forecast - by End-user Verticals
- 5.1.1. Education
- 5.1.2. Engineering
- 5.1.3. Entertainment
- 5.1.4. Healthcare
- 5.1.5. Other End-user Verticals
- 5.2. Market Analysis, Insights and Forecast - by Region
- 5.2.1. North America
- 5.2.2. Europe
- 5.2.3. Asia Pacific
- 5.2.4. Rest of the World
- 5.1. Market Analysis, Insights and Forecast - by End-user Verticals
- 6. Global Mixed Reality Industry Analysis, Insights and Forecast, 2021-2033
- 6.1. Market Analysis, Insights and Forecast - by End-user Verticals
- 6.1.1. Education
- 6.1.2. Engineering
- 6.1.3. Entertainment
- 6.1.4. Healthcare
- 6.1.5. Other End-user Verticals
- 6.1. Market Analysis, Insights and Forecast - by End-user Verticals
- 7. North America Mixed Reality Industry Analysis, Insights and Forecast, 2020-2032
- 7.1. Market Analysis, Insights and Forecast - by End-user Verticals
- 7.1.1. Education
- 7.1.2. Engineering
- 7.1.3. Entertainment
- 7.1.4. Healthcare
- 7.1.5. Other End-user Verticals
- 7.1. Market Analysis, Insights and Forecast - by End-user Verticals
- 8. Europe Mixed Reality Industry Analysis, Insights and Forecast, 2020-2032
- 8.1. Market Analysis, Insights and Forecast - by End-user Verticals
- 8.1.1. Education
- 8.1.2. Engineering
- 8.1.3. Entertainment
- 8.1.4. Healthcare
- 8.1.5. Other End-user Verticals
- 8.1. Market Analysis, Insights and Forecast - by End-user Verticals
- 9. Asia Pacific Mixed Reality Industry Analysis, Insights and Forecast, 2020-2032
- 9.1. Market Analysis, Insights and Forecast - by End-user Verticals
- 9.1.1. Education
- 9.1.2. Engineering
- 9.1.3. Entertainment
- 9.1.4. Healthcare
- 9.1.5. Other End-user Verticals
- 9.1. Market Analysis, Insights and Forecast - by End-user Verticals
- 10. Rest of the World Mixed Reality Industry Analysis, Insights and Forecast, 2020-2032
- 10.1. Market Analysis, Insights and Forecast - by End-user Verticals
- 10.1.1. Education
- 10.1.2. Engineering
- 10.1.3. Entertainment
- 10.1.4. Healthcare
- 10.1.5. Other End-user Verticals
- 10.1. Market Analysis, Insights and Forecast - by End-user Verticals
- 11. Competitive Analysis
- 11.1. Company Profiles
- 11.1.1 Samsung Electronics Company Limited
- 11.1.1.1. Company Overview
- 11.1.1.2. Products
- 11.1.1.3. Company Financials
- 11.1.1.4. SWOT Analysis
- 11.1.2 Acer Inc
- 11.1.2.1. Company Overview
- 11.1.2.2. Products
- 11.1.2.3. Company Financials
- 11.1.2.4. SWOT Analysis
- 11.1.3 Hewlett Packard Enterprise Company
- 11.1.3.1. Company Overview
- 11.1.3.2. Products
- 11.1.3.3. Company Financials
- 11.1.3.4. SWOT Analysis
- 11.1.4 Magic Leap Inc
- 11.1.4.1. Company Overview
- 11.1.4.2. Products
- 11.1.4.3. Company Financials
- 11.1.4.4. SWOT Analysis
- 11.1.5 Amber Garage (Holokit)
- 11.1.5.1. Company Overview
- 11.1.5.2. Products
- 11.1.5.3. Company Financials
- 11.1.5.4. SWOT Analysis
- 11.1.6 Microsoft Corporation
- 11.1.6.1. Company Overview
- 11.1.6.2. Products
- 11.1.6.3. Company Financials
- 11.1.6.4. SWOT Analysis
- 11.1.7 AsusTek Computer Inc
- 11.1.7.1. Company Overview
- 11.1.7.2. Products
- 11.1.7.3. Company Financials
- 11.1.7.4. SWOT Analysis
- 11.1.8 Meta Platform Inc
- 11.1.8.1. Company Overview
- 11.1.8.2. Products
- 11.1.8.3. Company Financials
- 11.1.8.4. SWOT Analysis
- 11.1.9 Dell Technologies Inc
- 11.1.9.1. Company Overview
- 11.1.9.2. Products
- 11.1.9.3. Company Financials
- 11.1.9.4. SWOT Analysis
- 11.1.10 Occipital Inc *List Not Exhaustive
- 11.1.10.1. Company Overview
- 11.1.10.2. Products
- 11.1.10.3. Company Financials
- 11.1.10.4. SWOT Analysis
- 11.1.1 Samsung Electronics Company Limited
- 11.2. Market Entropy
- 11.2.1 Company's Key Areas Served
- 11.2.2 Recent Developments
- 11.3. Company Market Share Analysis 2025
- 11.3.1 Top 5 Companies Market Share Analysis
- 11.3.2 Top 3 Companies Market Share Analysis
- 11.4. List of Potential Customers
- 12. Research Methodology
List of Figures
- Figure 1: Global Mixed Reality Industry Revenue Breakdown (Million, %) by Region 2025 & 2033
- Figure 2: North America Mixed Reality Industry Revenue (Million), by End-user Verticals 2025 & 2033
- Figure 3: North America Mixed Reality Industry Revenue Share (%), by End-user Verticals 2025 & 2033
- Figure 4: North America Mixed Reality Industry Revenue (Million), by Country 2025 & 2033
- Figure 5: North America Mixed Reality Industry Revenue Share (%), by Country 2025 & 2033
- Figure 6: Europe Mixed Reality Industry Revenue (Million), by End-user Verticals 2025 & 2033
- Figure 7: Europe Mixed Reality Industry Revenue Share (%), by End-user Verticals 2025 & 2033
- Figure 8: Europe Mixed Reality Industry Revenue (Million), by Country 2025 & 2033
- Figure 9: Europe Mixed Reality Industry Revenue Share (%), by Country 2025 & 2033
- Figure 10: Asia Pacific Mixed Reality Industry Revenue (Million), by End-user Verticals 2025 & 2033
- Figure 11: Asia Pacific Mixed Reality Industry Revenue Share (%), by End-user Verticals 2025 & 2033
- Figure 12: Asia Pacific Mixed Reality Industry Revenue (Million), by Country 2025 & 2033
- Figure 13: Asia Pacific Mixed Reality Industry Revenue Share (%), by Country 2025 & 2033
- Figure 14: Rest of the World Mixed Reality Industry Revenue (Million), by End-user Verticals 2025 & 2033
- Figure 15: Rest of the World Mixed Reality Industry Revenue Share (%), by End-user Verticals 2025 & 2033
- Figure 16: Rest of the World Mixed Reality Industry Revenue (Million), by Country 2025 & 2033
- Figure 17: Rest of the World Mixed Reality Industry Revenue Share (%), by Country 2025 & 2033
List of Tables
- Table 1: Global Mixed Reality Industry Revenue Million Forecast, by End-user Verticals 2020 & 2033
- Table 2: Global Mixed Reality Industry Revenue Million Forecast, by Region 2020 & 2033
- Table 3: Global Mixed Reality Industry Revenue Million Forecast, by End-user Verticals 2020 & 2033
- Table 4: Global Mixed Reality Industry Revenue Million Forecast, by Country 2020 & 2033
- Table 5: United States Mixed Reality Industry Revenue (Million) Forecast, by Application 2020 & 2033
- Table 6: Canada Mixed Reality Industry Revenue (Million) Forecast, by Application 2020 & 2033
- Table 7: Global Mixed Reality Industry Revenue Million Forecast, by End-user Verticals 2020 & 2033
- Table 8: Global Mixed Reality Industry Revenue Million Forecast, by Country 2020 & 2033
- Table 9: United Kingdom Mixed Reality Industry Revenue (Million) Forecast, by Application 2020 & 2033
- Table 10: France Mixed Reality Industry Revenue (Million) Forecast, by Application 2020 & 2033
- Table 11: Rest of Europe Mixed Reality Industry Revenue (Million) Forecast, by Application 2020 & 2033
- Table 12: Global Mixed Reality Industry Revenue Million Forecast, by End-user Verticals 2020 & 2033
- Table 13: Global Mixed Reality Industry Revenue Million Forecast, by Country 2020 & 2033
- Table 14: China Mixed Reality Industry Revenue (Million) Forecast, by Application 2020 & 2033
- Table 15: India Mixed Reality Industry Revenue (Million) Forecast, by Application 2020 & 2033
- Table 16: Japan Mixed Reality Industry Revenue (Million) Forecast, by Application 2020 & 2033
- Table 17: Rest of Asia Pacific Mixed Reality Industry Revenue (Million) Forecast, by Application 2020 & 2033
- Table 18: Global Mixed Reality Industry Revenue Million Forecast, by End-user Verticals 2020 & 2033
- Table 19: Global Mixed Reality Industry Revenue Million Forecast, by Country 2020 & 2033
Frequently Asked Questions
1. What is the projected Compound Annual Growth Rate (CAGR) of the Mixed Reality Industry?
The projected CAGR is approximately 45.34%.
2. Which companies are prominent players in the Mixed Reality Industry?
Key companies in the market include Samsung Electronics Company Limited, Acer Inc, Hewlett Packard Enterprise Company, Magic Leap Inc, Amber Garage (Holokit), Microsoft Corporation, AsusTek Computer Inc, Meta Platform Inc, Dell Technologies Inc, Occipital Inc *List Not Exhaustive.
3. What are the main segments of the Mixed Reality Industry?
The market segments include End-user Verticals.
4. Can you provide details about the market size?
The market size is estimated to be USD 4.04 Million as of 2022.
5. What are some drivers contributing to market growth?
High End-Electronic Consumer Market; Growing Adoption in Various Industries; Growing Awarness of Technology. along with Content Availability.
6. What are the notable trends driving market growth?
Education Sector will Hold a Significant Market Share.
7. Are there any restraints impacting market growth?
Lack of Standardization for Security of Digital Content.
8. Can you provide examples of recent developments in the market?
N/A
9. What pricing options are available for accessing the report?
Pricing options include single-user, multi-user, and enterprise licenses priced at USD 4750, USD 5250, and USD 8750 respectively.
10. Is the market size provided in terms of value or volume?
The market size is provided in terms of value, measured in Million.
11. Are there any specific market keywords associated with the report?
Yes, the market keyword associated with the report is "Mixed Reality Industry," which aids in identifying and referencing the specific market segment covered.
12. How do I determine which pricing option suits my needs best?
The pricing options vary based on user requirements and access needs. Individual users may opt for single-user licenses, while businesses requiring broader access may choose multi-user or enterprise licenses for cost-effective access to the report.
13. Are there any additional resources or data provided in the Mixed Reality Industry report?
While the report offers comprehensive insights, it's advisable to review the specific contents or supplementary materials provided to ascertain if additional resources or data are available.
14. How can I stay updated on further developments or reports in the Mixed Reality Industry?
To stay informed about further developments, trends, and reports in the Mixed Reality Industry, consider subscribing to industry newsletters, following relevant companies and organizations, or regularly checking reputable industry news sources and publications.
Methodology
Step 1 - Identification of Relevant Samples Size from Population Database


Step 2 - Approaches for Defining Global Market Size (Value, Volume* & Price*)

Note*: In applicable scenarios
Step 3 - Data Sources
Primary Research
- Web Analytics
- Survey Reports
- Research Institute
- Latest Research Reports
- Opinion Leaders
Secondary Research
- Annual Reports
- White Paper
- Latest Press Release
- Industry Association
- Paid Database
- Investor Presentations

Step 4 - Data Triangulation
Involves using different sources of information in order to increase the validity of a study
These sources are likely to be stakeholders in a program - participants, other researchers, program staff, other community members, and so on.
Then we put all data in single framework & apply various statistical tools to find out the dynamic on the market.
During the analysis stage, feedback from the stakeholder groups would be compared to determine areas of agreement as well as areas of divergence